The CLoud-Aerosol-Radiation Interaction and Forcing: Year 2017 (CLARIFY-2017) measurement campaign - ACP
←
→
Page content transcription
If your browser does not render page correctly, please read the page content below
Atmos. Chem. Phys., 21, 1049–1084, 2021
https://doi.org/10.5194/acp-21-1049-2021
© Author(s) 2021. This work is distributed under
the Creative Commons Attribution 4.0 License.

The CLoud–Aerosol–Radiation Interaction and Forcing:
Year 2017 (CLARIFY-2017) measurement campaign
Jim M. Haywood1,2 , Steven J. Abel2 , Paul A. Barrett2 , Nicolas Bellouin3 , Alan Blyth4 , Keith N. Bower5 ,
Melissa Brooks2 , Ken Carslaw4 , Haochi Che6,a , Hugh Coe5 , Michael I. Cotterell1,b , Ian Crawford5 , Zhiqiang Cui4 ,
Nicholas Davies1,c , Beth Dingley1,6 , Paul Field2,4 , Paola Formenti7 , Hamish Gordon4,d , Martin de Graaf8 ,
Ross Herbert3 , Ben Johnson2 , Anthony C. Jones1,2 , Justin M. Langridge2 , Florent Malavelle1,2 , Daniel G. Partridge1 ,
Fanny Peers1,e , Jens Redemann9 , Philip Stier6 , Kate Szpek2 , Jonathan W. Taylor5 , Duncan Watson-Parris6 ,
Robert Wood10 , Huihui Wu5 , and Paquita Zuidema11
1 College of Engineering, Mathematics and Physical Science, University of Exeter, Exeter, EX4 4QE, UK
2 Met Office, Exeter, EX1 3PB, UK
3 Department of Meteorology, University of Reading, Reading, RG6 6BB, UK
4 School of Earth and Environment, University of Leeds, Leeds, LS2 9JT, UK
5 Department of Earth and Environmental Sciences, University of Manchester, Manchester, M13 9PL, UK
6 Atmospheric, Oceanic and Planetary Physics, Department of Physics, University of Oxford, Oxford, OX1 3PU, UK
7 LISA, UMR CNRS 7583, Université Paris-Est-Créteil, Université de Paris,

Institut Pierre Simon Laplace (IPSL), Créteil, France
8 KNMI, De Bilt, 3731, the Netherlands
9 School of Meteorology, University of Oklahoma, Norman, Oklahoma, USA
10 Department of Atmospheric Sciences, University of Washington, Seattle, Washington, USA
11 Rosenstiel School of Marine and Atmospheric Science, University of Miami, Miami, Florida, USA
a now at: Department of Geophysics, Tel Aviv University, Tel Aviv, Israel
b now at: School of Chemistry, University of Bristol, Bristol, BS8 1TS, UK
c now at: Haseltine Lake Kempner, Bristol, BS1 6HU, UK
d now at: Engineering Research Accelerator, Carnegie Mellon University, Pittsburgh, Pennsylvania, USA
e now at: Laboratoire d’Optique Atmosphérique Université de Lille, 59655 Villeneuve d’Ascq CEDEX, France

Correspondence: Jim M. Haywood (j.m.haywood@exeter.ac.uk)

Received: 17 July 2020 – Discussion started: 21 August 2020
Revised: 23 November 2020 – Accepted: 23 November 2020 – Published: 27 January 2021

Abstract. The representations of clouds, aerosols, and           and temporal resolution, nor the required level of precision
cloud–aerosol–radiation impacts remain some of the largest       to allow for a process-level assessment. Detailed measure-
uncertainties in climate change, limiting our ability to ac-     ments from high spatial and temporal resolution airborne at-
curately reconstruct past climate and predict future climate.    mospheric measurements in the region are very sparse, lim-
The south-east Atlantic is a region where high atmospheric       iting their use in assessing the performance of aerosol mod-
aerosol loadings and semi-permanent stratocumulus clouds         elling in numerical weather prediction and climate models.
are co-located, providing an optimum region for studying         CLARIFY-2017 was a major consortium programme con-
the full range of aerosol–radiation and aerosol–cloud interac-   sisting of five principal UK universities with project partners
tions and their perturbations of the Earth’s radiation budget.   from the UK Met Office and European- and USA-based uni-
While satellite measurements have provided some useful in-       versities and research centres involved in the complementary
sights into aerosol–radiation and aerosol–cloud interactions     ORACLES, LASIC, and AEROCLO-sA projects. The aims
over the region, these observations do not have the spatial      of CLARIFY-2017 were fourfold: (1) to improve the repre-

Published by Copernicus Publications on behalf of the European Geosciences Union.
1050                  J. M. Haywood et al.: Overview: the cloud–aerosol–radiation interaction and forcing for year 2017

sentation and reduce uncertainty in model estimates of the        carbon is a strong absorber of sunlight (e.g. Shindell et al.,
direct, semi-direct, and indirect radiative effect of absorbing   2012; Bond et al., 2013), and certain organic compounds (so-
biomass burning aerosols; (2) to improve our knowledge and        called “brown” carbon) also absorb sunlight, particularly at
representation of the processes determining stratocumulus         shorter UV wavelengths (e.g. Andreae and Gelencsér, 2006).
cloud microphysical and radiative properties and their tran-      BBA is an important component of anthropogenic aerosol
sition to cumulus regimes; (3) to challenge, validate, and im-    and is produced from fires associated with deforestation,
prove satellite retrievals of cloud and aerosol properties and    savannah burning, agricultural waste, and domestic biofu-
their radiative impacts; (4) to improve the impacts of aerosols   els, with global emissions estimated to have increased by
in weather and climate numerical models. This paper de-           25 % since pre-industrial times (Lamarque et al., 2010). The
scribes the modelling and measurement strategies central to       African continent is the largest global source of BBA, cur-
the CLARIFY-2017 deployment of the FAAM BAe146 in-                rently contributing around 2–29 Tg[C] yr−1 (with [C] indi-
strumented aircraft campaign, summarizes the flight objec-        cating that this emission rate corresponds to that of carbon)
tives and flight patterns, and highlights some key results from   or 50 % of global emissions (e.g. van der Werf et al., 2010;
our initial analyses.                                             Bond et al., 2013). The meteorological transport of BBA over
                                                                  southern Africa during the dry season is dominated by an an-
                                                                  ticyclonic circulation, with westward transport on the north-
                                                                  ern periphery and eastward transport on the southern periph-
1   Introduction and rationale                                    ery (Adebiyi and Zuidema, 2016; Swap et al., 2002; Garstang
                                                                  et al., 1996). Over the continent, vertical mixing is inhibited
The interactions of clouds, aerosols, and radiation are high-     by stable layers at the top of the continental boundary layer
lighted as key climate uncertainties in the most recent Inter-    and by the main subsidence inversion (around 5–6 km a.s.l. –
governmental Panel on Climate Change (IPCC) assessment            above sea level) (Harrison, 1993; Garstang et al., 1996).
report (Boucher et al., 2013). Aerosol–radiation interactions        Over the south-east (SE) Atlantic, the BBA in the resid-
stem from direct scattering and absorption of solar and ter-      ual continental boundary layer (CBL) overrides the marine
restrial radiation by aerosols, thereby changing the planetary    boundary layer (MBL) where low sea-surface temperatures
albedo. Aerosol–cloud interactions, also termed indirect ef-      and large-scale subsidence give rise to persistent stratocumu-
fects, arise from aerosols acting as cloud condensation nu-       lus cloud, as evidenced in Fig. 1 that shows the climatology
clei (CCN) or ice nuclei in clouds. An increase in the num-       of cloud fraction and aerosol optical depth (AOD). A large
ber of activated CCN for fixed liquid water path translates       temperature inversion may inhibit mixing between the BBA
into larger concentrations of smaller cloud droplets, increas-    in the elevated residual CBL and the marine boundary layer,
ing cloud albedo (Twomey, 1977). Both aerosol–radiation           which, in turn, may limit the interaction with the clouds.
and aerosol–cloud interactions trigger fast adjustments to        However, prior to CLARIFY-2017, the degree of aerosol–
the profiles of temperature, moisture, and cloud water con-       cloud interaction was highly uncertain, highlighting the need
tent, which ultimately may affect cloud formation and pre-        for comprehensive in situ measurements.
cipitation rates and cloud lifetime (e.g. Albrecht, 1989; Pin-       While developing the scientific rationale for CLARIFY-
cus and Baker, 1994; Johnson et al., 2004). The quantifica-       2017, it became obvious that interest in aerosol–cloud and
tion of interactions in the cloud–aerosol–radiation system re-    aerosol–radiation interactions in the SE Atlantic region ex-
mains elusive. The recent IPCC report (Boucher et al., 2013)      tended well beyond the UK community. Not only were addi-
stresses that aerosol climate impacts remain the largest un-      tional European project partners entrained into CLARIFY-
certainty in driving climate change, with a global mean effec-    2017, but synergistic measurement campaigns planned by
tive forcing of −0.50 ± 0.40 W m−2 for aerosol–radiation in-      other multi-national research groups were also developed. Of
teraction and in the range of 0.0 to −0.9 W m−2 for aerosol–      specific complementary synergy were the following:
cloud interaction, thereby counterbalancing a significant,
but poorly constrained, fraction of greenhouse gas-induced          – LASIC (Layered Atlantic Smoke Interactions with
global warming, which is estimated to be +2.8 ± 0.3 W m−2             Clouds), which deployed a large suite of surface-
(Myhre et al., 2013a). This uncertainty impacts our ability           based observations via the Atmospheric Radiation
to attribute climate change and to quantify climate sensitiv-         Measurement (ARM) Mobile Facility (AMF; https:
ity and therefore to improve the accuracy of future climate           //www.arm.gov/capabilities/observatories/amf, last ac-
change projections. In regions with strong anthropogenic in-          cess: January 2021) to Ascension Island between
fluences, aerosol radiative forcings are an order of magnitude        July 2016–October 2017 (Zuidema et al., 2018a);
larger than their global mean values, limiting our ability to
provide reliable regional climate projections.                      – ORACLES (ObseRvations of Aerosols above CLouds
   Biomass burning smoke aerosol (BBA) consists of com-               and their intEractionS), which deployed the high-
plex organic carbon compounds mixed with black carbon                 altitude ER2 and heavily instrumented P3 aircraft to
(BC) and inorganic species such as nitrate and sulfate. Black         Walvis Bay, Namibia, in September 2016 and the

Atmos. Chem. Phys., 21, 1049–1084, 2021                                            https://doi.org/10.5194/acp-21-1049-2021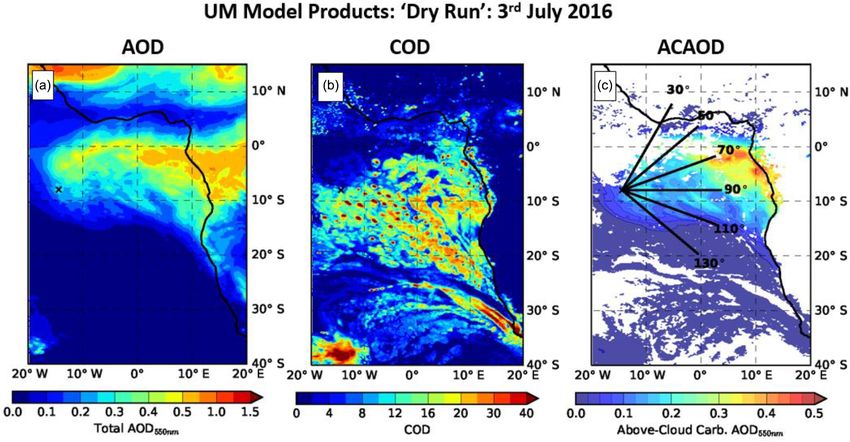
J. M. Haywood et al.: Overview: the cloud–aerosol–radiation interaction and forcing for year 2017 1051
paign prior to intensive modelling and observations. We defer
a discussion of these various studies to later sections of this
work.
1.1 Aerosol–radiation interactions (ARI)
On a global mean basis, BBA is estimated to exert a neutral
direct radiative forcing of −0.1 to +0.1 W m−2 (Boucher et
al., 2013). Even the sign of the global mean direct radiative
forcing is in doubt because the single scattering albedo (SSA,
the ratio of optical attenuation coefficients for scattering and
extinction) of BBAs is close to the balance point between net
Figure 1. 2003–2011 mean August–October AODs at 550 nm reflection and net absorption of sunlight (e.g. Haywood and
(coloured contours) retrieved from the MODIS satellite, MODIS
Shine, 1995). However, regionally, BBA plays a far more im-
cloud fraction (black and white colour scale), and Global Fire Emis-
sions Dataset (GFED) aerosol emission estimates (colours over
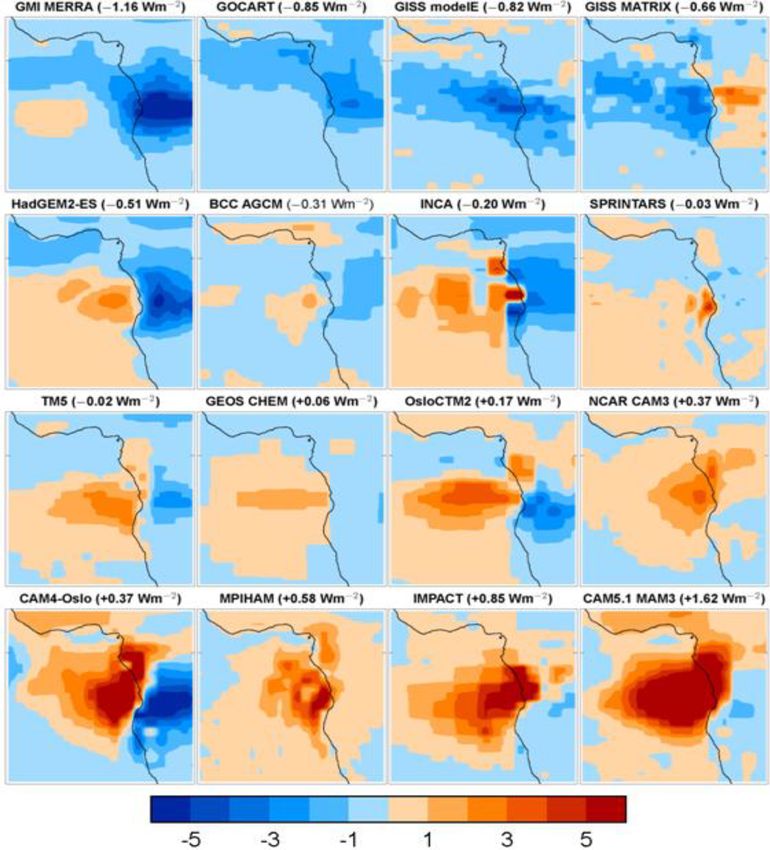
portant role: nowhere is the uncertainty in the direct radiative
land). The yellow star shows the position of Ascension Island, with effect and forcing more apparent than over the SE Atlantic
a dashed circle representing the approximate operating range of the than during the August–September dry season (Fig. 2).
FAAM aircraft. The position of São Tomé, where ORACLES op- Figure 2 shows the “direct” radiative effect derived from
erations were performed, and Walvis Bay, where both ORACLES models participating in AEROCOM (Myhre et al., 2013b;
and AEROCLO-sA operations were performed, is marked by red Stier et al., 2013), indicating a regional hotspot for BBA
and green stars respectively. forcing over the SE Atlantic but with significant uncertainty
because BBA can exist either above the stratocumulus, de-
creasing the planetary albedo, or above open ocean, where
P3 alone to São Tomé in August 2017 and October 2018 it increases the planetary albedo. To accurately model the
(Redemann et al., 2020); aerosol direct effect, models need to represent all of the fol-
– AEROCLO-sA (AErosol, RadiatiOn and CLOuds in lowing correctly: the magnitude and geographic distribution
southern Africa), which deployed a surface mobile plat- of the AOD, the wavelength-dependent SSA, the BBA verti-
form and the instrumented French Falcon 20 envi- cal profile, the geographic distribution of the cloud, the cloud
ronmental research aircraft of Safire in Henties Bay fraction, the cloud liquid water content, the cloud droplet ef-
and Walvis Bay, respectively, in 2017 (Formenti et al., fective radii, and the cloud vertical profile (Keil and Hay-
2019). wood, 2003; Abel et al., 2005; Samset et al., 2013; Stier et
al., 2013). At a more detailed aerosol process level, we need
All of these measurement campaigns comprised major de- to understand the optical properties of black carbon, organic
ployments of research assets to the South Atlantic region carbon, and inorganic compounds as a function of mixing
during 2017 (Zuidema et al., 2016). The location of these state and how these properties vary as a function of altitude
campaigns is summarized in Fig. 1. The scientific steer- and relative humidity and as a function of ageing from emis-
ing committees of the four synergistic projects frequently sion to deposition.
included members from the other projects. Planning teams Another implication of BBA overlying cloud is that satel-
from CLARIFY-2017, ORACLES, LASIC, and AEROCLO- lite retrievals of cloud that rely on visible wavelengths are
sA kept in close contact during their planning, deployment, generally biased low in cloud optical depth (COD) and
and analysis phases, which led to many benefits such as fore- effective radius (e.g. Hsu et al., 2003; Haywood et al.,
cast model sharing, joint special sessions at the EGU and 2004; Wilcox and Platnick, 2009), with implications for re-
AGU, and a mutual physically located workshop in Paris motely sensed correlative studies of aerosol–cloud interac-
and a virtual workshop in Miami (owing to Covid-19 travel tions (Quaas et al., 2008). Recently, de Graaf et al. (2012)
restrictions) dedicated to cross-campaign collaboration. An used high spectral resolution satellite data to show that the
intercomparison flight was performed between the FAAM direct radiative effect of BBA over clouds in the SE Atlantic
BAe146 aircraft and the NASA P3 aircraft when both were region could be stronger than +130 W m−2 instantaneously
operating from Ascension Island during 2017, allowing for and +23 W m−2 in the monthly mean. These values are far
an assessment and intercomparison of the performance char- stronger than those diagnosed in climate models which reach
acteristics of the aircraft instruments (Barrett et al., 2021a). only +50 W m−2 instantaneously (e.g. de Graaf et al., 2014),
We acknowledge here that the results from CLARIFY- suggesting that models misrepresent at least one of the key
2017, ORACLES, LASIC, and AEROCLO-sA campaigns parameters noted above.
are already starting to appear in the scientific literature, par- A further aerosol–radiation interaction occurs as a fast ad-
ticularly as part of this thematic special issue. This section justment to the direct effect and is called the semi-direct ef-
lays out the original motivation of the CLARIFY-2017 cam- fect (SDE), whereby the heating of the absorbing BBA layer
https://doi.org/10.5194/acp-21-1049-2021 Atmos. Chem. Phys., 21, 1049–1084, 2021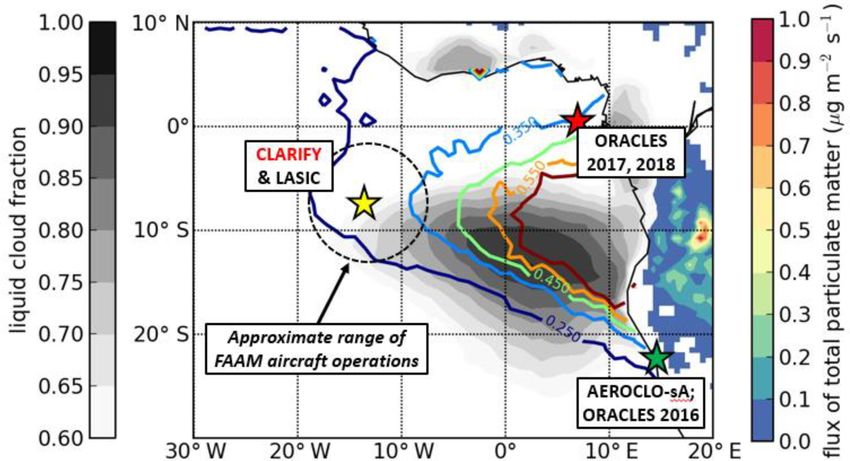
1052                   J. M. Haywood et al.: Overview: the cloud–aerosol–radiation interaction and forcing for year 2017

Figure 2. The annual mean direct radiative forcing (aerosol–radiation interaction) of BBA calculated by 16 different AEROCOM models.
Units are W m−2 . The most negative radiative forcing is in the top left-hand corner, while the most positive radiative forcing is the bottom
right-hand corner. Reproduced according to Zuidema et al. (2016).

and the reduction in surface temperature modify the atmo-                wood, 2010; Randles and Ramaswamy, 2010) but are un-
spheric stability, surface fluxes, clouds, and hence radiation.          able to represent the detailed process-level mechanisms cap-
Satellite observations over southern Atlantic stratocumulus              tured by LEMs. Studies in LEMs and global climate mod-
have shown a thickening of cloud underlying BBA (Wilcox,                 els have emphasized the importance of the vertical profile of
2012; Costantino and Breon, 2013), which could be a re-                  aerosol and the degree of absorption (Johnson, 2004; Ran-
sult of heating of the above-cloud column intensifying the               dles and Ramaswamy, 2010; Samset et al., 2013). Randles
cloud top inversion and reducing entrainment. Wilcox (2012)              and Ramaswamy (2010) and Allen and Sherwood (2010)
estimated that this produced a negative radiative effect that            document the response to the semi-direct effect via atmo-
compensated for 60 % of the above-cloud positive direct ef-              spheric impacts on stabilization, reduced surface fluxes, and
fect. Large eddy model (LEM) simulations have been used                  subsequent evolution of the modelled dynamical impacts.
to explore the detailed mechanisms of the semi-direct ef-                Johnson (2004) found the semi-direct effect to be 5 times
fect (e.g. Johnson et al., 2004; Hill and Dobbie, 2008) al-              smaller in global-scale models compared to LEMs, although
though they typically have relatively small domain sizes and             these results are challenged by Allen and Sherwood (2010).
therefore cannot account for the impact of aerosol in mod-               In addition, internal variability masks local semi-direct ef-
ifying synoptic-scale circulations. Global modelling stud-               fects, severely decreasing the statistical significance in previ-
ies are able to represent impacts on synoptic- and regional-             ous studies of modelled semi-direct effects (e.g. Ghan et al.,
scale dynamics and circulation patterns (e.g. Allen and Sher-            2012) and our ability to assess their fidelity.

Atmos. Chem. Phys., 21, 1049–1084, 2021                                                     https://doi.org/10.5194/acp-21-1049-2021
J. M. Haywood et al.: Overview: the cloud–aerosol–radiation interaction and forcing for year 2017                                    1053

1.2   Aerosol–cloud interactions (ACI)

Despite considerable advances in modelling clouds using
models of different resolutions, considerable uncertainties
remain in modelling even the relatively simple cases of stra-
tocumulus, owing to uncertainties in precipitation, decou-
pling, moisture budgets, and entrainment. Unsurprisingly,
climate models show considerable inter-model biases in
cloud fraction, liquid water path, effective radius, and COD
when compared against satellite observations, leading to
large discrepancies in the solar fluxes and hence the energy
absorbed by the ocean in the region (e.g. Bodas-Salcedo et
al., 2014).
   Aerosol–cloud interactions, or “indirect effects”, remain          Figure 3. The annual mean aerosol indirect effect (cloud–aerosol
one of the most elusive but key parameters in climate pre-            interaction) and aerosol semi-direct effect diagnosed for two aerosol
diction (Stevens and Feingold, 2009; Boucher et al., 2013).           schemes (CLASSIC and GLOMAP-MODE) within the HadGEM2
For stratocumulus, the effect of increased CCN leading to             climate model. Units are W m−2 .
cloud brightening can be modulated by changes in precipita-
tion and subsequent changes to cloud water amounts through
entrainment processes (e.g. Ackerman et al., 2004). Satellite-        necessarily lead to an increase in the aerosol number or CCN
borne lidar studies of aerosol–cloud interactions in the region       as the aerosol size distribution will tend to shift to larger
emphasize the critical role of the vertical profile of aerosol        sizes as more volatile organic precursors condense upon pre-
and cloud (Costantino and Breon, 2013) and the relative po-           existing aerosol particles (Fig. 3b). Therefore, when com-
sition of the two to each other (Chand et al., 2009). How-            bined with a slight reduction in the cloud fraction associated
ever, it is difficult to fully discern the level of interaction be-   with the aerosol-semi direct effect, some areas of the South
tween clouds and aerosols because of the sensitivity of li-           Atlantic shown in Fig. 3b are subject to a positive radiative
dars in the free troposphere (Watson-Parris et al., 2018) and         effect. The over-strong aerosol–cloud interaction in CLAS-
the attenuating effects of a thick layer of aerosols overly-          SIC compared to GLOMAP-MODE has been noted in other
ing clouds. Global bulk aerosol models and empirical rep-             studies that have used satellite retrievals to assess their valid-
resentations of aerosol indirect effects are being replaced           ity (e.g. Malavelle et al., 2017).
with microphysical aerosol models such as ECHAM5-HAM                     An assessment of parametric uncertainty in the GLOMAP-
(Stier et al., 2005) and GLOMAP (also known as UKCA                   MODE global model driven by ECMWF meteorology and
mode) (e.g. Mann et al., 2010; Bellouin et al., 2013), and            observed low-level clouds (Lee et al., 2013) showed that
more explicit representations of cloud and precipitation pro-         BBA particles are one of the largest sources of uncertainty
cesses (Hill et al., 2015; Grosvenor et al., 2017) have also          in CCN at cloud base. However, Lee et al. (2013) did not as-
been developed. Such schemes require extensive evaluation,            sess the effect of uncertainties in the physical model, which
which is often achieved through multi-model intercompari-             control the extent to which BBA and clouds mix, nor struc-
son studies (e.g. Quaas et al., 2009) and comparison to obser-        tural model uncertainties.
vations. The spatial resolution of global numerical weather              The stratocumulus decks of the SE Atlantic have been
prediction (NWP) and climate models (typically 10–100 km)             linked via global teleconnections to precipitation anomalies
is widely recognized as inadequate for investigating essen-           in Brazilian rainfall; SE Atlantic stratocumulus that is too
tial aerosol–cloud interaction processes at the cloud scale           bright can lead to precipitation deficits in the Nordeste and
(∼ 10 m; Lebo et al., 2017). Thus, relationships between sub-         Amazonian regions (Milton and Earnshaw, 2007; Jones et al.,
grid-scale variables such as cloud updraft velocity and en-           2009). Similarly, Atlantic sea-surface temperature gradients
trainment from LEMs and their link to large-scale bound-              and the hemispherical asymmetry in the energy balance are
ary layer variables are being sought but, while promising, are        strongly impacted by SE Atlantic stratocumulus (Jones and
far from well established (e.g. Golaz et al., 2011; Malavelle         Haywood, 2012; Stephens et al., 2016), influencing the posi-
et al., 2014). Simulations with HadGEM2 Coupled Large-                tion of the intertropical convergence zone (ITCZ) and hence
scale Aerosol Scheme for Studies In Climate (CLASSIC)                 the African and Asian monsoon.
suggest that while BBA interaction with cloud may be lim-
ited by vertical stratification, it does enter the MBL and in-        1.3   Previous measurements in the region and advances
teract with cloud, producing a strong indirect effect in the re-            since then
gion (Fig. 3a). However, the more sophisticated GLOMAP-
MODE two-moment scheme leads to a much reduced aerosol                The last major international measurement campaign in-
indirect effect because an increase in aerosol mass does not          vestigating biomass burning (BB) in southern Africa

https://doi.org/10.5194/acp-21-1049-2021                                                Atmos. Chem. Phys., 21, 1049–1084, 2021
1054                  J. M. Haywood et al.: Overview: the cloud–aerosol–radiation interaction and forcing for year 2017

was the Southern AFricAn Regional science Initiative              sentation and their impacts on local, regional, and global
in 2000 (SAFARI-2000). The SAFARI-2000 dry-season in-             weather and climate. Experience suggested that these objec-
tensive campaign focussed on the emissions, transport, and        tives were best achieved by conducting an intensive airborne
transformation of BBA plumes and the validation of satellite      field campaign with supporting surface and satellite measure-
remote sensing retrievals of aerosol and cloud from the Terra     ments. The measurements were used to challenge and de-
satellite (Swap et al., 2002). The majority of investigations     velop improved models at different spatial scales from the
over the SE Atlantic were basic aerosol microphysics and          cloud scale to the global scale that couple aerosols, clouds,
cloud-free radiative impact studies (Haywood et al., 2003;        and radiation.
Keil and Haywood, 2003; Osborne et al., 2004. Magi et al.,           Specific key objectives of CLARIFY-2017 were as fol-
2008). Since SAFARI-2000, significant advances in airborne        lows:
measurement of BC (e.g. Schwarz et al., 2008; McMeeking
                                                                      – Key objective 1: measure and understand processes
et al., 2011); organic and inorganic aerosol compounds (Mor-
                                                                        governing the physical, chemical, optical and radiative
gan et al., 2010); and aerosol physical properties have oc-
                                                                        properties of BBAs in the SE Atlantic region.
curred. In addition, improvements in the accuracy and sen-
sitivity of measurements of aerosol optical properties, no-           – Key objective 2: understand, evaluate and improve the
tably absorption (e.g. Sedlacek and Lee, 2007; Lack et al.,             representation of physical properties of the SE Atlantic
2008), have been made. Airborne lidar instrumentation and               stratocumulus clouds and their environment in a range
retrievals allow for concurrent mapping of vertical distribu-           of models.
tions of aerosols above clouds (e.g. Marenco et al., 2011).
                                                                      – Key objective 3: evaluate and improve the representa-
An extensive set of measurements of stratocumulus clouds
                                                                        tion of BBA–radiation interactions over the SE Atlantic
has been performed during VOCALS off the Pacific coast of
                                                                        when clouds are absent/present at a range of model
South America (Wood et al., 2011), with one of the foci be-
                                                                        scales and resolutions.
ing aerosol–cloud interactions (e.g. Yang et al., 2011; Paine-
mal and Zuidema, 2013). However, the aerosol composition,             – Key objective 4: evaluate and improve the representa-
sources, and interaction with the clouds in the VOCALS re-              tion of BBA–cloud interactions over the SE Atlantic at
gion are very different to those over the SE Atlantic, which is         a range of model scales and resolutions.
dominated by relatively strongly absorbing biomass burning
                                                                  The purpose of this work is to describe the deployment strat-
aerosol (e.g. Haywood et al., 2003).
                                                                  egy (Sect. 2), the aircraft- and surface-based instrumentation
   Model capabilities have also improved. At the time of
                                                                  (Sect. 3), the flight patterns used to deliver specific objectives
SAFARI-2000, aerosol modelling was in its infancy, with
                                                                  (Sect. 4), and a summary of the flights performed (Sect. 5)
only two global chemical transport models reporting the
                                                                  and to signpost certain key initial results (Sect. 6). Conclu-
direct radiative forcing and cloud albedo indirect forcing
                                                                  sions are presented in Sect. 7.
of BBA in the IPCC report (Ramaswamy et al., 2003).
Since 2000, the focus for aerosol–radiation interactions has
shifted to areas where model results diverge (e.g. SE At-         2    Deployment strategy
lantic; see Figs. 2 and 3). Global aerosol microphysics mod-
els have also been developed and are coupled to climate mod-      CLARIFY was originally scheduled to operate from
els and to cloud models at high resolution. Aerosol–cloud         Walvis Bay, Namibia, in August–September 2016. August–
interactions are now studied at scales ranging from LEMs          September was chosen as an optimal operating window via
with resolutions of a few metres, through cloud resolving         analysis of multi-year satellite analyses and surface-based
models, and limited area numerical weather prediction mod-        sun photometer observations (Adebiyi et al., 2015; multi-
els to global models with resolutions of ∼ 100 km. New ap-        year means presented in detail in Redemann et al., 2020).
proaches to understand sources of aerosol uncertainty have        There was also evidence that suitably high aerosol load-
also been developed (Lee et al., 2013). However, high-quality     ings had been encountered during this period during air-
validation data in the SE Atlantic with which to challenge the    craft operations with the UK’s instrumented C-130 aircraft
global and cloud resolving models are almost entirely lack-       and the University of Washington’s CV-580 aircraft during
ing.                                                              SAFARI-2000 (Haywood et al., 2003; Hobbs, 2003; Os-
                                                                  borne et al., 2004). However, operating permissions were
1.4    Key aims and objectives                                    not forthcoming, although permission was eventually given
                                                                  for operations in 2016 for the ORACLES campaign and
With the rationale as described above, CLARIFY-2017               in 2017 for the AEROCLO-sA campaign. Given the ORA-
aimed to use the natural laboratory of the SE Atlantic to im-     CLES and AEROCLO-sA deployments were based in conti-
prove the representation of BBAs and clouds in models of a        nental Africa relatively close to the sources of biomass burn-
range of scales and increase the fidelity of aerosol–radiation    ing, additional merits were envisaged by locating CLARIFY-
and aerosol–cloud interaction processes and cloud repre-          2017 operations at a downstream location, enabling very

Atmos. Chem. Phys., 21, 1049–1084, 2021                                             https://doi.org/10.5194/acp-21-1049-2021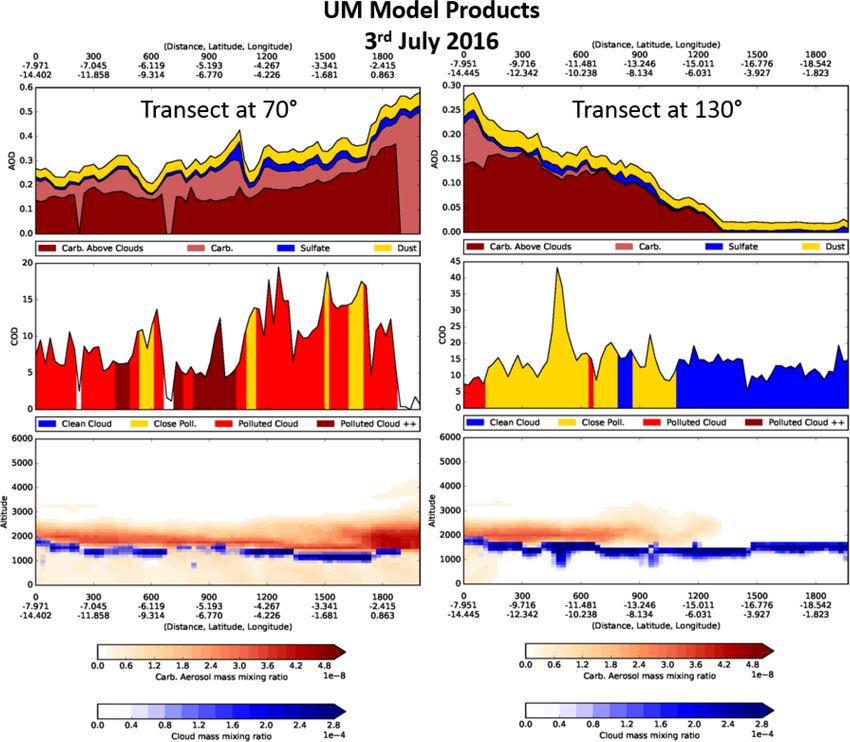
J. M. Haywood et al.: Overview: the cloud–aerosol–radiation interaction and forcing for year 2017                                  1055

Figure 4. Model forecasts with the CLUMP model for a wavelength of 550 nm for (a) aerosol optical depth (AOD), (b) cloud optical
depth (COD), and (c) above-cloud AOD (ACAOD; white where there is no cloud). The solid lines in (c) indicate transects over which
vertical–horizontal distribution maps aerosol, and cloud properties were provided as data products, some of which are provided in Fig. 5.

aged BBA to be sampled. These factors, together with the de-           with emissions from industrial pollution and dimethyl sul-
ployment of the AMF under the LASIC proposal, led to the               fide (DMS); (ii) a simplified two-bin mineral dust scheme
decision to relocate to Ascension Island and delay deploy-             based on Woodward (2001) with interactive emissions and
ment until August–September 2017, given that the biomass               data assimilation from MODIS Aqua (Pope et al., 2016;
plume and underlying stratocumulus decks could be accessed             O’Sullivan et al., 2020); and (iii) “carbonaceous aerosols”
from Ascension Island. The deployment was given the full               with real-time fire emissions from fossil fuel and biofuel
support of UK’s Joint Forces Command, which aided the lo-              (Global Fire Assimilation System (GFAS); Kaiser et al.,
gistics of deployment.                                                 2012) combined into one tracer. The three aerosol compo-
   To ensure that model and observational products were                nents were chosen as a compromise because the model was
readily available and that the scientists were familiar with           also used in the South West Asian Aerosol Monsoon Interac-
the likely meteorological, cloud, and aerosol conditions, dry          tion (SWAAMI) campaign (e.g. Brooks et al., 2019) and in
run periods were established 1 year ahead of deployment                the Dynamics–aerosol–chemistry–cloud interactions in West
(July–September 2016) and 1 month prior to deployment                  Africa (DACCIWA) project (Knippertz et al., 2015). This
(July–August 2017). The benefits of holding a dry run dur-             three-component aerosol model is known as the CLASSIC-
ing August–September 2016 were enhanced by the in-field                Lumped (CLUMP) model, owing to the emissions being
operations and the associated modelling support of the OR-             lumped into source terms for the three aerosol components.
ACLES campaign.                                                        While the limitations of such single-moment schemes are
   Tools for flight planning included global and regional              recognized, the primary purpose of the scheme was to lo-
model forecasts, satellite analyses, and data feeds from               cate the aircraft in approximately the right place at the right
surface-based instrumentation. Global modelling efforts for            time. Note that, with the exception of the impacts of min-
2016 included the following models: ECMWF, UK Met Of-                  eral dust that are included in the operational model, aerosol–
fice, the Global Forecasting System of NCEP, and the GEOS-             radiation interactions and aerosol–cloud interactions are ex-
5 model (see Redemann et al., 2020), all of which provided             plicitly turned off in CLUMP so that the dynamical evolution
their standard meteorological variables, such as cloud frac-           of the developmental model is identical to the operational
tion, cloud liquid water, and boundary layer depth. In addi-           model. Examples of some of the bespoke products are shown
tion, the Met Office developed a bespoke three-component               in Figs. 4 and 5.
aerosol system for use in its development version of the                  Figure 4a shows the expected pattern of aerosol optical
global NWP model (Walters et al., 2011) which ran at around            depth, although it is to the north of the seasonally aver-
15 km spatial resolution. The aerosol model was essentially            aged August–October AODs (Fig. 1), owing to the more
a derivative of the CLASSIC scheme (e.g. Bellouin et al.,              northerly location of biomass burning at this time of year.
2011) in which aerosols are modelled as externally mixed.              The CODs shown in Fig. 4b show the level of detail that
The three components that were chosen were (i) sulfate                 is possible in a high-resolution numerical weather predic-

https://doi.org/10.5194/acp-21-1049-2021                                                 Atmos. Chem. Phys., 21, 1049–1084, 2021
1056                    J. M. Haywood et al.: Overview: the cloud–aerosol–radiation interaction and forcing for year 2017

Figure 5. Model products derived at the 70◦ transect (column 1) and 130◦ transect (column 2) shown in Fig. 4. Aerosol optical depth (AOD)
at 550 nm is split into the three component aerosol types within the CLUMP model, and the carbonaceous (carb) aerosols that include
BBA are further subdivided into above-cloud and below-cloud components. Cloud optical depth (COD) is subdivided into (i) “clean”
(aerosol concentrations < 3 µg kg−1 ), (ii) clean but close to pollution (aerosol concentrations < 3 µg kg−1 but within 200 m in the verti-
cal of aerosol ≥ 3 µg kg−1 ), (iii) polluted (aerosol concentrations ≥ 3 µg kg−1 ), and (iv) very polluted (aerosol concentrations ≥ 10 µg kg−1 ).
The third row shows the vertical profile of carbonaceous aerosols (red) and cloud (blue) mass mixing ratios.

tion model. Figure 4c shows the above-cloud aerosol optical                25 % being contained within the MBL. This leads to classifi-
depth (ACAOD) that is diagnosed from the model, together                   cations of cloud that are generally polluted (arbitrary thresh-
with transects on radials originating from Ascension Island                old of 3 µg kg−1 of BBA) or very polluted (arbitrary thresh-
that were routinely analysed during the dry run and deploy-                old of 10 µg kg−1 of BBA) within the modelling framework.
ment periods.                                                                 The 130◦ transect is very different with the carbonaceous
   Figure 5 shows further bespoke model products along the                 aerosol almost entirely overlying cloud. This leads to classi-
70 and 130◦ transects shown in Fig. 4c. The 70◦ radial heads               fications of cloud that are either “close” to interacting with
into the heart of the biomass burning plume and suggests a                 cloud (when the aerosol base is within 200 m of the cloud)
very different degree of vertical mixing when compared to                  or “clean” when there is little in the way of biomass burn-
that at 130◦ . The 70◦ transect suggests that the carbonaceous             ing present to the south of the region. Of course, the utility
aerosol originating from biomass burning is mixed through-                 of the model as a forecast tool depends on its ability to ac-
out the boundary layer with around 75 % on average of car-                 curately represent the details of mixing of the BBA down
bonaceous aerosol residing above cloud and the remaining                   from the residual CBL into the MBL; we will show that the

Atmos. Chem. Phys., 21, 1049–1084, 2021                                                        https://doi.org/10.5194/acp-21-1049-2021
J. M. Haywood et al.: Overview: the cloud–aerosol–radiation interaction and forcing for year 2017                              1057

model is indeed capable of capturing these features in Sect. 6.      details of this instrumentation together with the aircraft in-
In addition to the UK Met Office 15 km resolution model,             strumentation are given in Sect. 3.
two other global aerosol models were available. ECMWF
were a project partner on the CLARIFY project and pro-
vided ECMWF-based model forecasts from Copernicus At-                3   Aircraft and surface-based instrumentation
mosphere Monitoring Service (CAMS; https://atmosphere.
                                                                     The BAe146 FAAM aircraft is the UK’s NERC-funded at-
copernicus.eu/, last access: January 2021) and the NASA-
                                                                     mospheric research aircraft and is part-funded by the UK’s
based GEOS5 (https://gmao.gsfc.nasa.gov/GEOS/, last ac-
                                                                     Met Office. It has the largest payload of any European at-
cess: January 2021) that was run in support of the ORACLES
                                                                     mospheric research aircraft, capable of carrying three crew,
programme (Redemann et al., 2020).
                                                                     18 scientists, and a total scientific payload of up to 4000 kg
   Limited area NWP forecast models were also utilized,
                                                                     for a distance of 3700 km with a ceiling of 35 000 ft (feet)
with a horizontal grid spacing of 4 km and a domain of
                                                                     (10.7 km) and has a typical science airspeed of 110 m s−1 .
around 2000 km × 2000 km, with boundary conditions pro-
                                                                     The endurance of the BAe146 aircraft is typically up to 6 h
vided by the global NWP model; this model did not in-
                                                                     depending on the scientific payload, the flight patterns, ambi-
clude aerosol transport but provided even higher resolution
                                                                     ent meteorological conditions, and the proximity of diversion
cloud products. Regional models that did include aerosol
                                                                     airports.
were also run in support of ORACLES, e.g. WRF-Chem at
                                                                         The aircraft instrumentation used in this configuration is
36 km resolution and full chemistry and WRF with aerosol-
                                                                     an enhanced version of that used in previous aerosol and ra-
aware microphysics at 12 km resolution (Saide et al., 2016),
                                                                     diation campaigns such as DABEX and GERBILS (e.g. Hay-
the latter model being the primary ORACLES aerosol fore-
                                                                     wood et al., 2008, 2011) and is broken down into subsets
cast tool. The formulation and resolution of the WRF with
                                                                     corresponding to aerosol microphysics, aerosol composition
aerosol-aware microphysics simulations are similar to those
                                                                     and optical properties, cloud physics, radiation and remote
of the Met Office NWP-CLUMP model, although the NWP-
                                                                     sensing, trace gas chemistry, and thermodynamics (Table 1).
CLUMP model had aerosol–radiation and aerosol–cloud in-
                                                                         The instrumentation was chosen to provide an optimal in-
teractions disabled. Output data products from these models
                                                                     strumentational fit to meet the key objectives while keeping
were also made available to the CLARIFY team (Redemann
                                                                     down the operational weight of the aircraft to maintain a rea-
et al., 2020).
                                                                     sonable range.
   Satellite products provided another important tool for
                                                                         In addition to the aircraft instrumentation and the sun pho-
planning aircraft flights. MODIS was used to provide 1-
                                                                     tometer and lidar deployed at the airfield, the campaign bene-
day-old observations of aerosol optical depth in cloud-free
                                                                     fitted from the synergistic deployment of the AMF to Ascen-
regions, while the geostationary SEVIRI instrument was
                                                                     sion Island. The AMF was located on a more remote wind-
used for nowcasting cloud conditions, with images of cloud
                                                                     ward side of the island, to avoid local aerosol sources, at a
conditions being periodically relayed to the FAAM aircraft
                                                                     site approximately 300 m (1000 ft) above sea level (Zuidema
throughout the flight. Before the dry runs and deployment,
                                                                     et al., 2016, 2018a). The deployment spanned July 2016–
a register of the timing and track of overpasses from polar
                                                                     October 2017 and thus captured two distinct biomass burn-
orbiting satellites (e.g. Terra, Aqua) that were in the vicinity
                                                                     ing seasons. The FAAM aircraft made several fly-pasts of
of Ascension Island was made, taking care to exclude areas
                                                                     the AMF site at 1000 ft a.s.l. (approximately 300 m), off-
where the satellite was influenced by sun glint. This allowed
                                                                     set by approximately 2 km to the east so that it was oper-
scientists to decide on the relative priorities of flights. In the
                                                                     ating at the same altitude, thus allowing for a comparison
case that forecasted AOD and cloud-cover conditions were
                                                                     of aerosol, trace gas, and radiation measurements. A new
expected to be consistent for several days, priority was given
                                                                     Handix Portable Optical Particle Counter (POPS) was also
to those days with local satellite overpasses, so the aircraft
                                                                     operated at the AMF by the University of Exeter for the du-
measurements could provide data for satellite validation and
                                                                     ration of the FAAM deployment to help provide a long-term
allowing the satellite measurements to put the aircraft mea-
                                                                     characterization of the instrument (Liu et al., 2021). Standard
surements into a wider geographical context.
                                                                     meteorological measurements were also made by the Met
   Further information from ground-based instrumentation
                                                                     Office located at the airfield, including precipitation mea-
was utilized for nowcasting. This included information on the
                                                                     surements. A long-standing standard Cimel sun photometer
aerosol optical depth from two Cimel sun photometers based
                                                                     has also been operational on Ascension Island as part of the
at the AERONET and AMF sites, a handheld Microtops sun
                                                                     AERONET network since 1998.
photometer based at the operations centre in Georgetown,
and a Leosphere depolarizing lidar, operated by KNMI at the
airfield. This combination of equipment allowed for an as-
sessment of the aerosol loadings and the vertical distribution
of aerosol relative to cloud prior to aircraft take-off. Further

https://doi.org/10.5194/acp-21-1049-2021                                              Atmos. Chem. Phys., 21, 1049–1084, 2021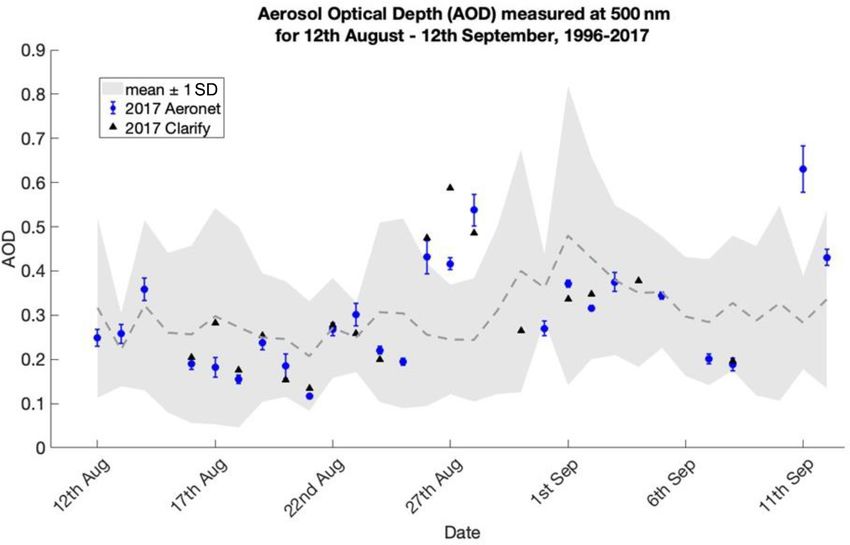
J. M. Haywood et al.: Overview: the cloud–aerosol–radiation interaction and forcing for year 2017

                                                                                                                                                                                                                                                                                   https://doi.org/10.5194/acp-21-1049-2021
                                                                                                    Table 1. Summary of instruments of major relevance to detachment. FAAM – Facility for Airborne Atmospheric Measurements, Met O – Met Office, UoM – University of Manchester,
                                                                                                    NCAS – National Centre for Atmospheric Science. Size classifications for cloud and particle distributions are given in diameter.
                                                                                                     Instrument                                      Facility        Details                                                          Comment
                                                                                                     Aerosol microphysics
                                                                                                     DMT-SPP200 PCASP-100X                           FAAM            0.10–3 µm size distribution                                      Wing-mounted
                                                                                                     TSI 3786 Condensation Particle Counter (CPC)    FAAM            Total number, size > 3 nm.
                                                                                                     Scanning Mobility Particle Sizer (SMPS)         UoM             20–350 nm size distribution
                                                                                                     DMT CCN-200 Dual Channel Condensation           FAAM            Continuous flow CCN at 2 supersaturations
                                                                                                     Nuclei Counter (CCN)
                                                                                                     CVI PCASP                                       Met O           0.10–3 µm size distribution                                      Brechtel inlet
                                                                                                     CVI TSI 3025 CPC                                Met O           Total number of residual particles > 3 nm.                       Brechtel inlet
                                                                                                     DMT-SPP 200 PCASP-100X                          Met O           0.10–3 µm size distribution                                      EXSCALABAR (cabin)
                                                                                                     Brechtel Counterflow Virtual Impactor (CVI)     Met O/NCAS      Aerosol residual chemical composition                            Brechtel Inlet
                                                                                                     DMT UHSAS Ultra-High Sensitivity Aerosol        UoM             50–1000 nm size distribution                                     Brechtel inlet
                                                                                                     Spectrometer
                                                                                                     TSI 3321 Aerosol Particle Sizer (APS)           UoM             0.5–20 µm size distribution                                      Brechtel inlet
                                                                                                     GRIMM Optical Particle Counter                  UoM             0.25–32 µm size distribution                                     Brechtel inlet
                                                                                                     Aerosol composition and optical properties
                                                                                                     Compact Time-of-Flight Aerosol Mass             UoM             50–700 nm non-refractory size-resolved aerodynamic diam.
                                                                                                     Spectrometer (ToF-AMS)
                                                                                                     Single Particle Soot Photometer (SP2)           UoM             Single-particle soot detection by laser-induced incandescence

                                                                                                                                                                                                                                                                                   Atmos. Chem. Phys., 21, 1049–1084, 2021
                                                                                                     Filters                                         UoM             Sub- and supermicron nucleopore
                                                                                                     TSI 3563 Nephelometer                           FAAM            Scattering coefficient at 450, 550, and 700 nm.
                                                                                                     Radiance Research Particle Soot Absorption      FAAM            Absorption coefficient at 530 nm.
                                                                                                     Photometer (PSAP)
                                                                                                     EXSCALABAR photo-acoustic spectrometer          Met O           Dry absorption coefficient at 405, 514, and 658 nm, thermally    EXSCALABAR PAS,
                                                                                                     (PAS)                                                           denuded at 405 and 658 nm                                        CRDS, PCASP, and TAP <
                                                                                                     EXSCALABAR cavity ring-down                     Met O           Dry extinction coefficient at 405 and 658 nm. 75 % and 90 % RH   1.3 µm diameter
                                                                                                     spectrometer (CRDS)                                             extinction coefficient at 405 nm.                                impactor applied to
                                                                                                     EXSCALABAR Tri-Absorption Photometer            Met O           Dry absorption coefficient at 467, 528, and 652 nm.              remove coarse aerosol.
                                                                                                     (TAP)
1058
Table 1. Continued.
Instrument Facility Details Comment
Cloud physics
DMT Cloud Droplet Probe FAAM 2–50 µm size distribution, 1 Hz, polarization Wing-mounted
(CDP-2) & BCPOL
DMT Clouds aerosol and precipitation probe UoM 0.5–960 µm size distribution 1 Hz Wing-mounted
(CAPS CIP-15, CAS)
SPEC 2D-S cloud-drizzle spectrometer (2D-S) UoM 10–128 000 µm size distribution, 100 Hz Wing-mounted
SPEC FCDP/FFSSP (ultra-fast cloud droplet UoM 1–60 µm size distribution, 50 Hz Wing-mounted
spectrometer)
Cloud Imaging Probe-15: CIP-15 FAAM 15–960 µm size distribution, 1 Hz Wing-mounted
https://doi.org/10.5194/acp-21-1049-2021
Cloud Imaging Probe-100: CIP-100 FAAM 100–6400 µm size distribution. Wing-mounted
Nevzorov hot wire probe FAAM Liquid and total water content (LWC and TWC)
SEA hot wire probe FAAM Liquid and total water content (LWC and TWC)
Radiation/remote sensing
Leosphere lidar – EZALS450 Met O 355 nm UV backscattering lidar with depolarization
Eppley broadband radiometers (BBRs) Met O Upper and lower (0.3–3.0 µm) and (0.3–0.7 µm) fluxes. Broadband
Shortwave Spectrometer (SWS) Met O Resolved radiances 300–1700 nm at 3–6 nm resolution. Pointable
Shortwave Hemispheric Integrating Met O Resolved irradiances 300–1700 nm at 3–6 nm resolution.
Measurement System (SHIMS)
MARRS Met O 89 and 157 GHz for liquid water path retrievals
Trace gas chemistry
Aero-Laser AL5002 FAAM CO ±2.8 ppb @ 1 Hz
Teco 49 FAAM O3 by UV photometry Sens 1 ppb @ 60 s
Los Gatos Research Inc Fast Greenhouse Gas Analyser FAAM CO2 and CH4 ±1.28 ppb/0.17 ppm @ 1 Hz
TEi43C FAAM SO2 ±0.1 ppb @ 60 s
Thermodynamics
Rosemount Temperature Sensors FAAM True air temperature 32 Hz De-iced, non-deiced housing
Chilled Mirror dew point hygrometer FAAM Dew point ∼ 1 Hz
J. M. Haywood et al.: Overview: the cloud–aerosol–radiation interaction and forcing for year 2017
Total water probe Met O Total water content, 64 Hz
WVSS-II: water vapour Met O Water vapour content, 0.4 Hz
Dropsonde systems FAAM Profile of temperature, humidity, wind
AIMMS Met O 3-D winds, 20 Hz
Turbulence probe FAAM 3-D winds, 32 Hz
Atmos. Chem. Phys., 21, 1049–1084, 2021
10591060 J. M. Haywood et al.: Overview: the cloud–aerosol–radiation interaction and forcing for year 2017
Figure 6. Schematic diagram of the manoeuvres that were typically performed during cloud-free and cloudy conditions. The numbers marked
on the schematic represent the manoeuvres referred to in the text.
4 Flight patterns for the objectives A series of predetermined, but flexible, flight patterns
were developed (e.g. Fig. 6). Each flight pattern was made
Because the aircraft was operating from Ascension Island up of a series of manoeuvres including “straight and level
where there are no diversion airports, island holding restric- runs” (SLRs) (denoted no. 1–no. 5 in Fig. 6), “profiles”
tions were in place, resulting in a reduced operating dura- (denoted no. 6 in Fig. 6), “sawtooths” (denoted no. 4
tion of around 3.5–4 h. Owing to these restrictions, extended in the cloudy-flight schematic of Fig. 6), and “orbits”
operations at distances far from Ascension Island were cur- (denoted no. 4 in the cloud-free schematic of Fig. 6).
tailed. However, owing to the significant cooperation of the SLRs of differing duration were made at constant pres-
RAF, USAF, ATC, fire crew, and ground crew, the aircraft sure levels. Profiles were typically made at a constant
was able to operate for two flights per day if required from rate of descent/ascent of 1000 ft min−1 (5 m s−1 ) (although
09:00–12:30 LT followed by re-fuelling and flying 14:00– 500 ft min−1 (2.5 m s−1 ) was typical at the lowest levels),
17:30 LT Monday–Friday. No flights were permitted on Sat- while sawtooths were frequently used from cloud top to
urday afternoons, taking account of other air traffic utilizing cloud base to characterize clouds. Orbits in conjunction with
the airstrip, and Sunday was classed as a hard-down day with the SWS instrument are flown at high angles of bank (typ-
no flying permitted to provide a scheduled rest day. Scien- ically 60◦ ), take less than 2 min to complete, and allow for
tific outreach showcasing the aircraft and our science was via measurements that are analogous to Cimel almucantar scans
guided tours of the aircraft and talks on the scientific research (Osborne et al., 2008, 2011).
being performed to the general population of Ascension Is- A manoeuvre carried out when the skies were predomi-
land (approximately one-third of the island’s entire civilian nantly cloud-free while the aircraft was on the ground con-
population was present). sisted of a “pirouette”, rotating the aircraft through 360◦ over
Depending on the aerosol and cloud conditions determined a period of around 2 min while the aircraft was on the As-
from forecast products, satellite retrievals, and ground-based cension Island runway or apron. This allowed two separate
observation data, the FAAM aircraft flights were designed to measurements to be made. Firstly, levelling corrections for
characterize the main aerosol and cloud state in clean and the Eppley BBR and SHIMS instruments (Table 1) could
polluted conditions and to study properties and processes be performed from these manoeuvres, and any impacts of
rather than to build a spatially and temporally representative dome degradation via aerosol impaction on the front faces of
mapping of the region (see Redemann et al., 2020, for OR- the BBR and SHIMS domes could be assessed by examin-
ACLES flight plans for building such a representative map- ing pre- and post-flight data (Barrett et al., 2021a). Secondly,
ping). This strategy for flight planning ensured that suitable by setting the SWS instruments’ viewing geometry to match
data sets were collected to facilitate meeting the key objec- the solar zenith angle (or the solar angle plus 10◦ ), the SWS
tives described in Sect. 1.4. instrument effectively made almucantar scans analogous to
those made by Cimel sun photometers where the radiance is
Atmos. Chem. Phys., 21, 1049–1084, 2021 https://doi.org/10.5194/acp-21-1049-2021J. M. Haywood et al.: Overview: the cloud–aerosol–radiation interaction and forcing for year 2017 1061
mapped out as a function of the scattering angle. By setting together with a series of sawtooths through the cloud to fur-
the SWS viewing geometry to the solar zenith angle plus 10◦ , ther characterize the variability of the cloud top and cloud
the range of scattering angles sampled was from 10◦ to twice base and to provide detailed characterization of cloud micro-
the solar zenith angle plus 20◦ . physical parameters within cloud and at cloud top from in
Flight patterns for aerosol characterization generally con- situ measurements (effective radius, LWP, and liquid water
sisted of either SLRs through the BBA layer or vertical pro- content, LWC).
files/sawtooths to constrain their vertical distribution in the SLRs just below cloud base and just above cloud base were
atmospheric column. Because both the radiation and cloud used to investigate CCN budgets, closure, and aerosol loss
sorties described below involved many measurements of due to scavenging. SLRs below cloud, in cloud, and above
aerosol, specific flight patterns focussing solely on aerosol cloud measured CCN, cloud droplet size distributions, and
characterization were not performed; aerosol characteriza- drizzle size distribution below cloud base to provide informa-
tion was implicit within the other sorties and mainly used tion on the entrainment process, the influence of entrainment
a combination of SLRs and vertical profiles. on cloud microphysics, and constraints on BBA entrainment
rates into cloud top. Vertical profile, sawtooth, and stepped
4.1 Flight patterns for radiation objectives profile measurements were made of the size distribution of
cloud droplets and precipitation over the diameter size range
An example of the flight patterns performed for determining 2 µm to 6 mm, capturing cloud droplets and precipitation.
the radiative effects of BBA in cloud-free and cloudy skies The onboard AMS, SP2, and OPCs were switched between
is shown in Fig. 6 based on preconceived ideas of what we the CVI inlet to measure droplet residuals and the total in-
would expect based on prior experience from SAFARI-2000 let to determine the size and composition of the nucleation
(Haywood et al., 2003). scavenged and interstitial aerosol as a function of position
The patterns shown in Fig. 6 were typically orientated so and height in the cloud. Measurements higher in the cloud
that the SLRs and profiles avoided running within 30◦ of together with turbulence measurements examined the evolu-
the into-sun heading. This is to avoid making radiative trans- tion of the cloud microphysics as condensational growth and
fer measurements where aerosol may have been impacted on coalescence occur.
the front face of the Eppley BBRs and SHIMS instruments,
which could lead to a reduction in measured irradiance. Ow- 4.3 Planning logistics
ing to the variability of cloud, the order of the runs was
typically changed during CLARIFY-2017 so that the high- All satellite overpasses, satellite observations from previous
level SLR leg was followed by a reciprocal turn and profile overpasses, model data, and observations from the AMF and
descent followed by a reciprocal turn and SLR just above from the KNMI lidar installed at the airfield were available
cloud top. This ensured the minimum length of time had to the planning teams (see Sects. 2 and 3). Owing to the
elapsed between the two legs to minimize differences caused high intensity of the flying programme, the flight planning
by changes in cloud fields below the aircraft (e.g. Peers et teams were separated into two, an aircraft-based team fly-
al., 2019, 2020). Because of the shape of this sequence, the ing the mission and a second ground-based team which pre-
pattern is known as a “Z pattern”. pared flight plans for the forthcoming flight. The team on
Radiometric measurements above and below the BBA the ground also was responsible for sending updates to the
characterized broadband and spectral irradiances and ra- aircraft via SATCOM, providing updates of the cloud con-
diances, provided aerosol vertical distribution from lidar, ditions from the geostationary satellites and measurements
and enabled sea-surface reflectance characterization. Profiles from the surface-based instrumentation. After a debrief of
through the BBA characterized the aerosol extinction and ab- the flight, the ground-based team and aircraft-based team
sorption coefficient from the EXtinction, Scattering and Ab- then swapped roles so that each team “owned” the flight
sorption of Light for AirBorne Aerosol Research (EXSCAL- from inception, through planning and execution. As per stan-
ABAR) instrument and hence the aerosol optical depth and dard campaign operating procedures, a running tally of hours
aerosol absorption optical depth. When BBA overlies cloud, allocated to specific aerosol characterization, cloud charac-
SLRs above and below BBA provided remotely sensed esti- terization, aerosol–radiation and aerosol–cloud interactions,
mates of cloud top droplet effective radius and liquid water and other aspects such as pocket of open cell (POC) inves-
path (LWP) from solar and microwave instrumentation. tigations was maintained during the campaign so that future
flights could target any science gaps in the key objectives.
4.2 Flight patterns for cloud characterization
objectives
5 Summary of the flights performed
Flight patterns for examining clouds typically resembled a
series of stacked SLRs below cloud, within cloud, above A total of 28 science flights were performed on 18 d during
cloud, and within aerosol. Typically, the patterns were used CLARIFY-2017 for a total of around 99 h (Table 2); the ge-
https://doi.org/10.5194/acp-21-1049-2021 Atmos. Chem. Phys., 21, 1049–1084, 20211062 J. M. Haywood et al.: Overview: the cloud–aerosol–radiation interaction and forcing for year 2017
cantly different from the long-term data from the AERONET
Cimel.
6 Key results
With reference to the Key Objectives of Sect. 1.4, the follow-
ing sections report the key results from our analyses.
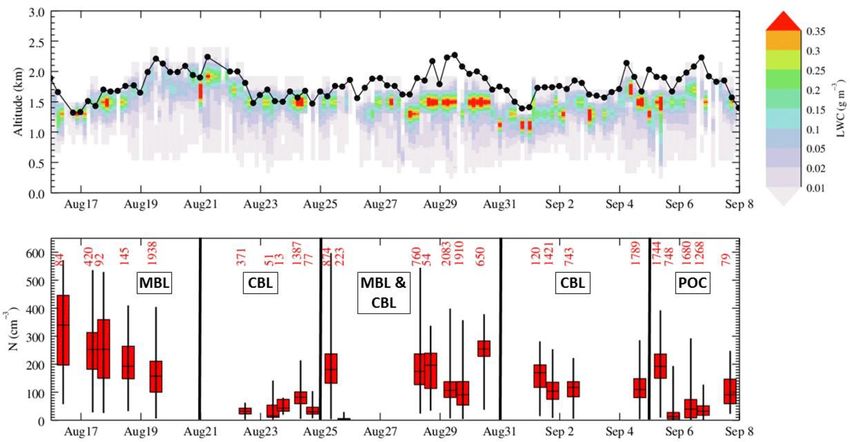
6.1 Vertical profiles
CLARIFY-2017 was able to show that the vertical structure
is quite complex, with aerosols existing either predominantly
in the MBL, predominantly in the residual CBL, or existing
in both the MBL and residual CBL (Fig. 9).
Figure 9 shows that the CLUMP model is generally able
to represent the distribution of aerosol in the MBL and the
residual CBL. Figure 9 shows that the one notable exception
is when a POC was observed over Ascension Island. Dur-
ing the POC event towards the end of the measurement cam-
paign, the model does not accurately represent the close-to-
pristine nature of the MBL (see Abel et al., 2020).
A hierarchical cluster analysis was performed based on
the mean and maximum BBA concentrations and the alti-
tude of the maximum concentrations in the free troposphere
and the mean concentration within the boundary layer for
each flight. The cluster analysis based on these criteria re-
vealed two distinct groups, with the first group (G1) includ-
ing flights C028–C032 (16–19 August 2017) corresponding
to the period when the aerosol was solely in the MBL, with a
mean concentration over the size range 0.1–3.0 µm (Table 2)
measured by the PCASP instrument on the FAAM aircraft
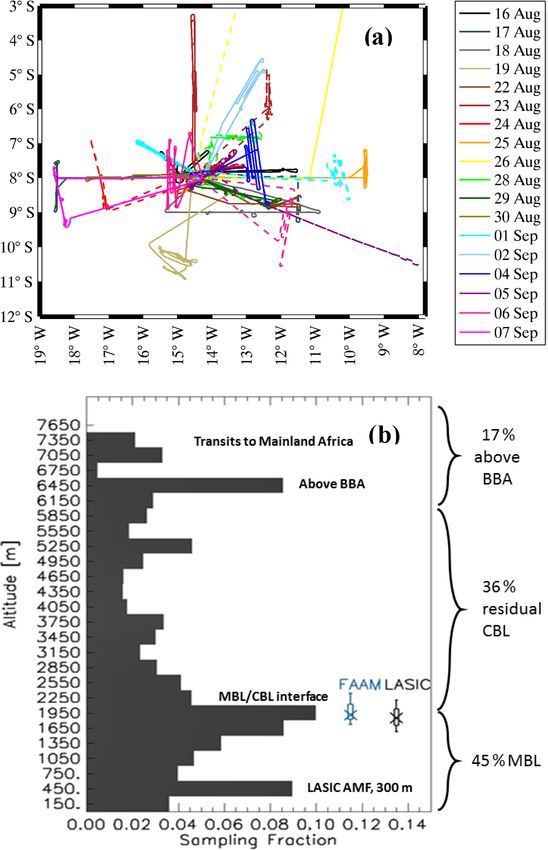
Figure 7. (a) Geographical position of the sorties that were per-
formed during CLARIFY-2017 and (b) an analysis of the sampling
of 685 cm−3 in the MBL but just 35 cm−3 in the free tro-
altitudes during the campaign, with the boundary layer heights from posphere. The second group contained two subgroups with
FAAM and the LASIC AMF diagnosed during the campaign shown flights C034, C035, C042, and C047–C050, i.e. those show-
by the bar and whiskers. ing little aerosol in the MBL (∼ 78 cm−3 ) but much in the
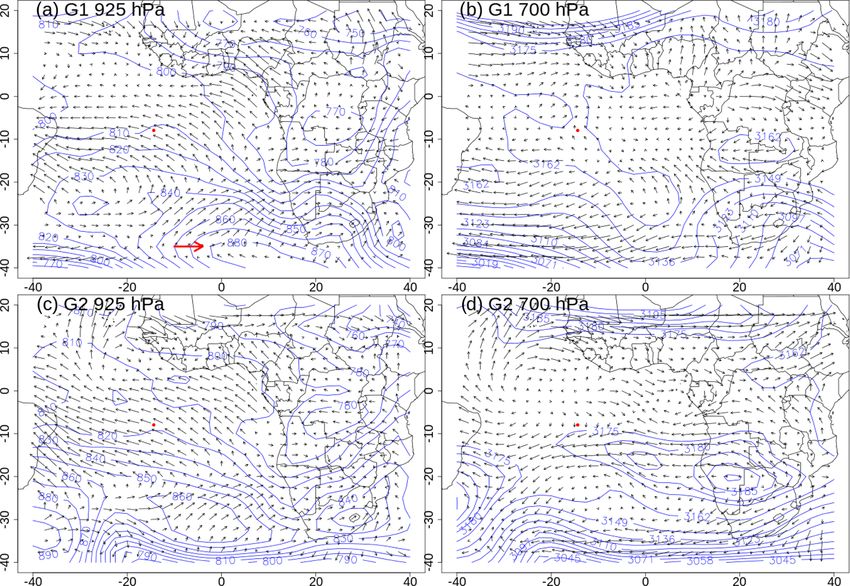
residual CBL (∼ 884 cm−3 ). These are denoted group G2.
The mean synoptic geopotential height based on these two
ographic distribution of the flight tracks for CLARIFY-2017 clusters and the associated wind speed vectors are shown in
is shown in Fig. 7. Fig. 10.
While the climatological mean of the AOD shows a max- Figure 10 shows that, although south-east winds associ-
imum almost directly east of Ascension Island (Fig. 1), in ated with a subtropical high dominated in the MBL at the
practice Fig. 7a shows that the flights were performed in location of Ascension Island (as indicated by the 925 hPa
various directions because of the filament-like nature of the geopotential height contours and wind vectors) for both
aerosol plume on any specific day. An analysis of the time groups G1 and G2, the locations of the high-pressure cen-
the aircraft spent at different altitudes is shown in Fig. 7b, tres were different. In G1, the centre of the high pressure was
which reveals that 45 % of the time the FAAM aircraft was located around 40◦ S, 0–20◦ E, while under G2, the centre of
operating in the MBL and 36 % of the time in the residual the high pressure was around 30◦ S, 0–10◦ W. For both G1
CBL in the BBA layer, with the remaining time spent above and G2, the MBL around Ascension Island can be influ-
the BBA while transiting to or from mainland Africa (C041, enced by air of continental origin, but the MBL in G2 is
C041) or making radiometric measurements. also influenced by air recirculating around the subtropical
The aerosol optical depth measured at Ascension Island high that does not pass over the African continent, owing
via the Cimel and Microtops sun photometers at 500 nm to the non-geostrophic and divergent flow around high pres-
ranged from values of 0.14 to 0.54 (Table 2, Fig. 8), and a sures. This recirculation characteristic of G2 appears to ex-
t test value of 0.9879 indicates that the AOD was not signifi- plain the relatively clean MBL during the periods 21–25 Au-
Atmos. Chem. Phys., 21, 1049–1084, 2021 https://doi.org/10.5194/acp-21-1049-2021You can also read