Evaluating Physical Climate Risk for Equity Funds with Quantitative Modelling - How Exposed are Sustainable Funds?
←
→
Page content transcription
If your browser does not render page correctly, please read the page content below

UPTEC W 20 028

                              Examensarbete 30 hp
                                        Juni 2020

Evaluating Physical Climate
Risk for Equity Funds with
Quantitative Modelling
- How Exposed are Sustainable Funds?

Sofia Wiklund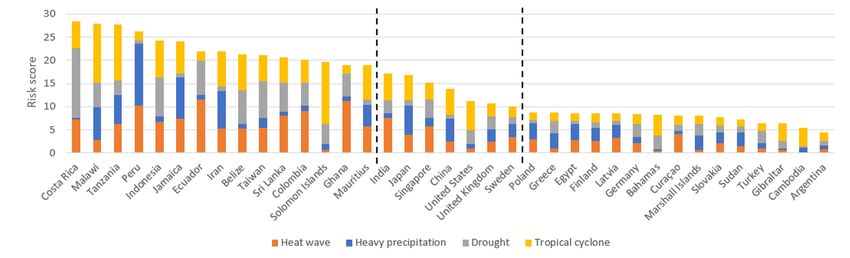
Abstract
Evaluating Physical Climate Risk for Equity Funds with Quantitative
Modelling - How Exposed are Sustainable Funds?
Sofia Wiklund

The climate system is undergoing rapid changes because of anthropogenic emissions of
greenhouse gases. The effects from a warmer climate are already noticeable today with
more frequent extreme weather events. These extreme weather events have financial conse-
quences and pose risks to the financial system. This study evaluates such physical climate
risks for the periods 2021-2025 and 2026-2030 by developing a quantitative model. Phys-
ical risks are here limited to heat waves, heavy precipitation events, drought and tropical
cyclones. The model applies climate data from CMIP5 to evaluate hazard intensity at
the location of a company. Vulnerability of the certain hazard is determined based on the
sector. Physical risks from supply chain relations are also considered. The result is then
aggregated on portfolio level. The model is applied to compare the exposure of physical
climate risks on sustainable equity funds with the exposure on the general market and to
determine what characteristics that contribute to low respectively high climate risks.

Generally, the total climate risk proves to be lower for the period 2021-2025 compared
to 2026-2030 because of the natural variability in the climate system. Europe has the
lowest climate risk, and the GICS-sector with the highest risk is Real Estate. No clear
conclusion can be drawn in the comparison of physical risk exposure between sustainable
funds and the market; however, the result indicates that sustainable funds select securities
of lower risk within a specific investment universe. The average sustainable funds select
equities with lower risk within regions, sectors and market cap sizes in almost all studied
cases. Regional allocation proves to be important for the exposure to physical climate
risks. This is also related to market cap size since larger companies are likely to have
their assets distributed in several countries which contributes to diversification. On fund
level, the strategy of carbon minimising is shown to have no significant impact on physical
climate risks, neither positively nor negatively.

The awareness among investors on physical climate risks is currently low, and sustainabil-
ity labels seems to offer no guarantee for minimising physical risk exposure. This study
adds to the very small pool of studies on physical climate risks in investment management
and provides a market wide overview. Hopefully, development of this research area can
contribute to increase the awareness of investors and thereby drive capital towards a more
resilient society.

Keywords: climate change, ESG, sustainable finance, sustainable investment.

Department of Forest Economics, SLU
SE - 750 07, Uppsala.

                                             i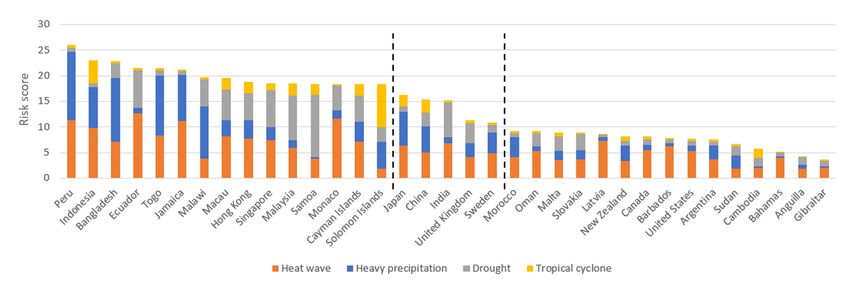
Referat
Utvärdering av fysiska klimatrisker för aktiefonder genom kvantitativ
modellering - Hur utsatta är hållbara fonder?

Sofia Wiklund

Klimatet genomgår en snabb förändring på grund av antropogena utsläpp av växthus-
gaser. Effekterna av ett varmare klimat är redan kännbara idag med mer frekventa
extremväderhändelser. De här extremväderhändelserna har finansiella konsekvenser och
utgör en risk för det finansiella systemet. Den här studien utvärderar sådan fysisk klima-
trisk för perioderna 2021-2025 och 2026-2030 genom att utveckla en kvantitativ modell.
I begreppet fysiska klimatrisker innefattas här värmeböljor, kraftiga skyfall, torka och
tropiska cykloner. Modellen använder sig av klimatdata från CMIP5 för att utvärdera
intensiteten av naturfenomenet på den geografiska platsen för företagets tillgångar. Käns-
lighet för naturfenomenet bestäms baserat på sektorn. Fysiska risker från värdekedjan
inkluderas också. Resultatet är sedan aggregerat på portföljnivå. Modellen är applicerad
för att jämföra fysiska klimatrisker för hållbarhetsfonder jämfört med den generella mark-
naden och för att bestämma vilka faktorer som bidrar till en hög respektive låg klimatrisk.

Generellt visades att den fysiska klimatrisken var lägre för perioden 2021-2025 jämfört
med perioden 2026-2030 på grund av naturlig variabilitet i klimatsystemet. Europa hade
den lägsta klimatrisken, och GICS-sektorn med högst risk var fastighetssektorn. Ingen
tydlig slutsats kan dras i jämförelsen av klimatrisk för hållbarhetsfonder och marknaden,
men resultatet indikerar att hållbarhetsfonder väljer aktier med lägre klimatrisk inom
ett specifikt investeringsunivers. Den genomsnittliga hållbarhetsfonden väljer aktier med
lägre risk inom regioner, sektorer och market-cap storlek i nästan alla studerade fall.
Regional allokering visade sig vara en viktig faktor för exponering av klimatrisk. Det
relaterar också till storlek av företaget eftersom större företag är mer troliga att ha till-
gångarna fördelade i flera länder vilket bidrar till diversifiering. På fondnivå visades att
strategin att minimera koldioxidintensitet inte påverkar klimatrisken signifikant, varken
negativ eller positiv.

Medvetenheten om fysisk klimatrisk bland investerare är idag låg, och hållbarhetsmärkningar
tycks inte innebära någon garanti för att minimera exponeringen till fysisk klimatrisk.
Den här studien bidrar till den mycket lilla gruppen av studier inom fysisk klimatrisk
i investeringar och erbjuder en överblick över hela marknaden. Förhoppningsvis kan
utveckling av detta forskningsområde bidra till att öka medvetenheten hos investerare
och därmed driva kapital mot ett mer resilient samhälle.

Nyckelord: ESG, hållbar finans, hållbar investering, klimatförändring.

Institutionen för skogsekonomi, SLU
SE - 750 07, Uppsala.

                                             ii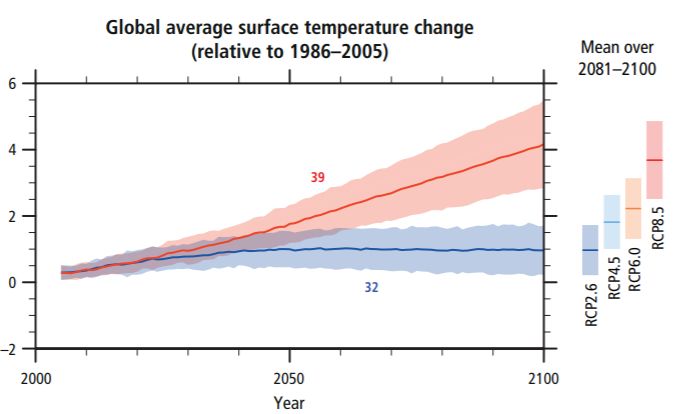
Preface
This study was conducted as a Master’s thesis as part of the Master’s Programme in
Environmental and Water Engineering at Uppsala University and the Swedish University
of Agricultural Sciences (SLU). The thesis supervisor was Professor Cecila Mark-Herbert
at the Department of Forest Economics, SLU. The project was conducted at the Large
Corporate and Financial Institution division of SEB. The thesis supervisor at SEB was
Sofia Duvander.

I would like to thank my supervisor Cecilia Mark-Herbert for sharing my engagement in
this project and supporting me with as well personal enthusiasm and academic stringency
throughout the full process. From the university, I would also like to thank Gabriele Mes-
sori for sharing his knowledge on climate models and providing his input on indicators for
natural hazards.

I would like to thank my team at SEB that has understood the value of bringing finance
and natural sciences together. Through the open and innovative environment of the team,
I have been able to test my ideas. A special thank you to my supervisor at SEB Sofia
Duvander that has supported me through the project.

Finally, I would like to thank my family and loved ones. Henrik, thank you for standing
being locked-in with me and my Master’s thesis during times of quarantine! Your input
at the dinner table has helped me bringing the study to the next level.

Sofia Wiklund
Uppsala, June 2020

©Sofia Wiklund and the Department of Forest Economics, SLU
UPTEC W 20 028, ISSN 1401-5765
Published digitally at the Department of Forest Economics, Uppsala 2020.

                                                 iii
Populärvetenskaplig sammanfattning
Det råder stor osäkerhet om det framtida klimatet. Vart kommer världens insatser för
att minska den globala uppvärmningen att leda? Kommer vi att nå målet om två graders
uppvärmning? Något som dock är säkert är att oavsett dessa framtida insatser så kom-
mer vi att se ett förändrat klimat som konsekvens av tidigare utsläpp av växthusgaser.
Dessa förändringar kommer utgöra en risk för samhället och för det finansiella systemet.
Extremväderhändelser kan orsaka kostsamma skador på infrastruktur och byggnader, en
högre temperatur minskar effektiviteten av arbetskraft och förändrade nederbördsmönster
påverkar inte minst skörden från jordbruk. Medvetenheten om sådana klimatrisker har
varit och är fortfarande generellt sett låg hos finansiella aktörer. Det tongivande initia-
tivet Task Force on Climate-related Financial Disclosures skrev år 2017 att klimatrisker
är bland de ”mest betydande, men kanske mest missförstådda risker som organisationer
står inför idag” (TCFD 2017, p. ii). Lagstiftning för att synliggöra klimatrisker börjar nu
dock att komma ikapp, både inom EU och utanför. För investerare finns idag endast my-
cket vag vägledning för hur de ska hantera och minimera klimatrisker. Många investerare
förlitar sig på samma indikatorer som i andra hållbarhetsfrågor - hållbarhetsmärkningar
eller ett lågt koldioxidavtryck. Mycket lite forskning har gjorts på hur klimatrisk förhåller
sig på marknaden där investerare navigerar.
Denna studie tar ett brett grepp på klimatrisker, genom kvantitativ modellering ges en
översiktlig bild av hela marknaden för aktiefonder. Mer specifikt gäller studien fysiska
klimatrisker, alltså klimatrisker som orsakas av de direkta fysiska förändringarna av kli-
matet, till exempel skada från extremväderhändelser. Fokus ligger på hållbara aktiefonder
och att jämföra den fysiska klimatrisken för dessa fonder jämfört med den generella mark-
naden. De fyra klimatrisker som undersöktes var värmeböljor, kraftiga skyfall, torka och
tropiska cykloner. Alla dessa väderhändelser förväntas öka i antingen frekvens eller in-
tensitet i ett varmare klimat och deras påverkan är viktig ur ett globalt perspektiv.
Fysisk klimatrisk modellerades för varje innehav i en aktieportfölj som en produkt av två
faktorer: intensiteten av väderhändelsen och känsligheten för den specifika händelsen.
Intensiteten av väderhändelsen modellerades på den geografiska plats som företaget har
sina tillgångar och beräknas som en skillnad jämfört med idag. Om värmeböljor kommer
öka signifikant jämfört med idag klassades det som en hög intensitet av väderhändelsen.
Känsligheten för den specifika händelsen beror av den sektor som företaget opererar inom.
Hur känslig är sektorn för mer frekventa värmeböljor? Detta gjordes för vardera av de
fyra valda väderhändelserna. I en allt mer globaliserad värld är det också viktigt att ta
hänsyn till företags leverantörskedjor - om leverantörerna inte kan leverera påverkar det
också företaget. Detta inkluderades därför också i modellen. Den fysiska klimatrisken
modellerades för två perioder, 2021-2025 och 2026-2030.
Resultatet visade att klimatrisken var högst inom fastighetssektorn medan hälsa- sjukvård
hade lägst risk. Den regionala fördelningen av risk visade att Europa hade lägst risk i
båda studerade perioder, bland regionerna med högst risk var resultatet olika för de
två perioderna. Nordamerika hade högst risk 2021-2025 medan Oceanien hade högst
risk 2026-2030. Att resultatet skilde sig mellan de två perioderna beror troligen på att
sammansättningen av risk varierar mellan de två olika perioderna. Under 2021-2025
dominerar risk från tropiska cykloner medan värmeböljor dominerar 2026-2030. Generellt
är också risken lägre i den senare perioden 2026-2030 jämfört med 2021-2025. Detta kan
ivtyckas vara kontraintuitivt, men kan förklaras med den naturliga variabilitet som finns i
klimatsystemet. Fem år är en mycket kort period i klimatmått. Jämförelse med tidigare
studier är svårt att göra, exempelvis bidrar troligen det kortare tidsperspektivet i denna
studie till att skillnaden i risk mellan sektorer och regioner är mindre än i tidigare studier.
Inkludering av risker från leverantörskedjan gör också att sektorer och regioner med lägst
risk får högre risk, och vice versa. Vissa gemensamma trender kan dock urskiljas, till
exempel att Europa generellt har låg risk.
Gällande jämförelsen av hållbara aktiefonder med den generella marknaden studerades
tre grupper av fonder som klassificerats som hållbara enligt olika graderingar eller cer-
tifieringar på marknaden. Inga tydliga slutsatser kan dras gällande hur hållbara fonder
förhåller sig till marknaden i fysisk risk, vilket i sig är ett viktigt resultat - att förlita
sig på hållbarhetsmärkningar för att minimera fysisk risk som investerare är ingen säker
metod. Det tycks dock som att hållbara fonder väljer företag med lägre risk inom ett
givet universum, till exempel en region. Studien visar också att metoden att minimera
koldioxidavtrycket hos fonden inte påverkar den fysiska klimatrisken, varken positivt eller
negativt. Inte heller koldioxidavtryck är alltså en bra indikator för fysisk klimatrisk,
men det är möjligt att konstruera en portfölj med både låg fysisk klimatrisk och lågt
koldioxidavtryck. Valet av vilka regioner investeringen ska göras i är viktigt för fondens
exponering för fysisk klimatrisk. Storleken av företagen är också viktigt, generellt skulle
hållbarhetsfonderna gynnas ur ett klimatriskperspektiv av att välja större bolag. Detta
kan bero på att stora företag ofta har tillgångar i flera länder och därmed sprider risken
medan mindre företag snarare har alla ägg i samma korg - eller land.
Denna studie bidrar till en mycket liten grupp av kvantitativa modelleringsstudier av fysisk
klimatrisk för investerare. Utveckling av det området kan akademiskt hjälpa forskare att
hitta storskaliga mönster att studera djupare och operationellt hjälpa investerare att
systematiskt undersöka ett större investeringsuniversum för att minska exponeringen för
klimatrisk. Att hantera klimatrisk vid konstruktion av en portfölj kommer sannolikt bli
allt viktigare, huruvida investerare lyckas med det eller inte kommer att speglas i den sista
raden i resultaträkningen. Att investerare tar informerade beslut gällande klimatrisker
är viktigt för samhällets förmåga att hantera klimatförändringarna då de styr det privata
kapitalet. Om de investerar i företag som är motståndskraftiga kommer dessa företag
gynnas och kan växa. Slutligen ska dock sägas att smarta placeringar endast lindrar
symptomen av fysisk klimatrisk. För att på lång sikt minska den fysiska klimatrisken krävs
aktiva åtgärder för att vi ska nå det där målet om maximalt två graders uppvärmning.
vTable of Content
1 Introduction 1
1.1 Problem Formulation . . . . . . . . . . . . . . . . . . . . . . . . . . . . . . 2
1.2 Aim and Research Questions . . . . . . . . . . . . . . . . . . . . . . . . . . 3
1.3 Delimitations . . . . . . . . . . . . . . . . . . . . . . . . . . . . . . . . . . 3
1.4 Outline . . . . . . . . . . . . . . . . . . . . . . . . . . . . . . . . . . . . . . 3
2 Theory 5
2.1 Equity Funds . . . . . . . . . . . . . . . . . . . . . . . . . . . . . . . . . . 5
2.2 Financial Risk . . . . . . . . . . . . . . . . . . . . . . . . . . . . . . . . . . 5
2.3 Sustainable Finance . . . . . . . . . . . . . . . . . . . . . . . . . . . . . . . 7
2.3.1 Sustainable Funds . . . . . . . . . . . . . . . . . . . . . . . . . . . . 7
2.3.2 Climate Related Risk in Finance . . . . . . . . . . . . . . . . . . . 10
2.4 Climate Models . . . . . . . . . . . . . . . . . . . . . . . . . . . . . . . . . 11
2.5 Conceptual Framework . . . . . . . . . . . . . . . . . . . . . . . . . . . . . 12
3 Background Empirics 15
3.1 Climate Change - Natural Variability and Anthropogenic Impact . . . . . . 15
3.2 Effects and Consequences of Climate Change . . . . . . . . . . . . . . . . . 16
3.2.1 Heat Wave . . . . . . . . . . . . . . . . . . . . . . . . . . . . . . . . 16
3.2.2 Intense precipitation . . . . . . . . . . . . . . . . . . . . . . . . . . 17
3.2.3 Drought . . . . . . . . . . . . . . . . . . . . . . . . . . . . . . . . . 19
3.2.4 Tropical Cyclone . . . . . . . . . . . . . . . . . . . . . . . . . . . . 19
3.3 Previous Studies . . . . . . . . . . . . . . . . . . . . . . . . . . . . . . . . 21
3.3.1 Climate Related Credit Risk . . . . . . . . . . . . . . . . . . . . . . 21
3.3.2 Climate Related Equity Risk . . . . . . . . . . . . . . . . . . . . . . 23
4 Method 28
4.1 Model Construction . . . . . . . . . . . . . . . . . . . . . . . . . . . . . . . 28
4.1.1 Hazard Intensity . . . . . . . . . . . . . . . . . . . . . . . . . . . . 29
4.1.2 Sector Vulnerability . . . . . . . . . . . . . . . . . . . . . . . . . . . 34
4.2 Method of Analysis . . . . . . . . . . . . . . . . . . . . . . . . . . . . . . . 37
4.2.1 Method for Comparing Sustainable Funds with the Market . . . . . 37
4.2.2 Method for Analysing Characteristics of Funds . . . . . . . . . . . . 39
5 Results 41
5.1 Underlying Universe . . . . . . . . . . . . . . . . . . . . . . . . . . . . . . 41
5.1.1 Climate Model Data . . . . . . . . . . . . . . . . . . . . . . . . . . 41
5.1.2 Description of the Full Universe . . . . . . . . . . . . . . . . . . . . 41
5.1.3 Universe of Studied Funds . . . . . . . . . . . . . . . . . . . . . . . 43
5.1.4 Test of Alternative Model parameters . . . . . . . . . . . . . . . . . 45
5.2 Comparison of Sustainable Funds and the Market . . . . . . . . . . . . . . 48
5.3 Characteristics that Possibly Impact Climate Risk . . . . . . . . . . . . . . 51
5.3.1 Sustainable Investment Strategies . . . . . . . . . . . . . . . . . . . 51
5.3.2 Sector Allocation . . . . . . . . . . . . . . . . . . . . . . . . . . . . 52
5.3.3 Regional Allocation . . . . . . . . . . . . . . . . . . . . . . . . . . . 53
5.3.4 Market Cap Size . . . . . . . . . . . . . . . . . . . . . . . . . . . . 55
5.3.5 CAPEX . . . . . . . . . . . . . . . . . . . . . . . . . . . . . . . . . 55
vi6 Discussion 57
6.1 Discussion of Method . . . . . . . . . . . . . . . . . . . . . . . . . . . . . . 57
6.1.1 The Challenge with Tail Volatility in the Underlying Climate Data 57
6.1.2 Transparency on Assumptions to Ensure Reliability . . . . . . . . . 58
6.1.3 The Importance of a Supply Chain Perspective . . . . . . . . . . . 59
6.1.4 The Challenge to Define Sustainable Funds . . . . . . . . . . . . . . 60
6.2 Relevance of Results . . . . . . . . . . . . . . . . . . . . . . . . . . . . . . 60
6.2.1 Natural Variability is Important on a Short Time Scale . . . . . . . 60
6.2.2 Difficult to Compare Previous Studies of Sector Risk . . . . . . . . 61
6.2.3 Regional Risk Findings Resemble Previous Studies . . . . . . . . . 62
6.3 Interpretation of Results . . . . . . . . . . . . . . . . . . . . . . . . . . . . 63
6.3.1 Sustainable Funds Select Companies with Lower Risk in a
Given Universe . . . . . . . . . . . . . . . . . . . . . . . . . . . . . 63
6.3.2 The Question of Fortunate Coincidence or Active Choice . . . . . . 64
6.3.3 Region and Size are Important Characteristics for Physical Risk . . 65
6.3.4 The Creation of a Portfolio of Low Physical Risk . . . . . . . . . . 65
7 Conclusions 67
7.1 Implications . . . . . . . . . . . . . . . . . . . . . . . . . . . . . . . . . . . 67
7.2 Further Studies . . . . . . . . . . . . . . . . . . . . . . . . . . . . . . . . . 68
References 70
viiList of Figures
Figure 1 Equity risk . . . . . . . . . . . . . . . . . . . . . . . . . . . . . . . . 6
Figure 2 Impact from physical risks on the financial system . . . . . . . . . . 10
Figure 3 RCP and corresponding average surface temperature change . . . . 12
Figure 4 Conceptual framework . . . . . . . . . . . . . . . . . . . . . . . . . 13
Figure 5 Correlation between climate models . . . . . . . . . . . . . . . . . . 41
Figure 6 Sector risk for all listed companies . . . . . . . . . . . . . . . . . . . 42
Figure 7 Country risk for all listed companies 2021-2025 . . . . . . . . . . . . 42
Figure 8 Country risk for all listed companies 2026-2030 . . . . . . . . . . . . 43
Figure 9 Sector allocation of studied funds . . . . . . . . . . . . . . . . . . . 44
Figure 10 Regional allocation of studied funds . . . . . . . . . . . . . . . . . . 44
Figure 11 Sector risk in 2021-2025 with modified supply chain weight . . . . . 45
Figure 12 Regional risk in 2021-2025 with modified supply chain weight . . . . 46
Figure 13 Sector risk with altered weights of natural hazards . . . . . . . . . . 47
Figure 14 Regional risk with altered weights of natural hazards . . . . . . . . 47
Figure 15 Comparison of risk between the sustainable funds and the market . 48
Figure 16 Risk type for the sustainable funds . . . . . . . . . . . . . . . . . . 50
Figure 17 Attribution based on region comparing the funds of Morningstar
with the funds of YourSRI . . . . . . . . . . . . . . . . . . . . . . . . . . . 51
Figure 18 Risk for the National Pension Funds of Sweden compared to the
market . . . . . . . . . . . . . . . . . . . . . . . . . . . . . . . . . . . . . . 51
Figure 19 Relation between carbon intensity and risk. . . . . . . . . . . . . . 52
Figure 20 Attribution based on sector comparing sustainable funds with the
market . . . . . . . . . . . . . . . . . . . . . . . . . . . . . . . . . . . . . . 53
Figure 21 Detailed view on sector attribution of the funds of YourSRI . . . . . 53
Figure 22 Attribution based on region comparing sustainable funds with the
market . . . . . . . . . . . . . . . . . . . . . . . . . . . . . . . . . . . . . . 54
Figure 23 Detailed view of regional attribution for the funds of Morningstar . 54
Figure 24 Detailed view of size attribution for the funds of YourSRI . . . . . . 55
Figure 25 Relation between CAPEX and risks . . . . . . . . . . . . . . . . . . 56
viiiList of Abbreviations
ACWI All Countries World Index
CAPEX Capital expenditures
CRED Centre for Research on the Epidemiology of Disasters
DICE Dynamic Integrated Climate-Economy
ENSO El Niño, La Niña and the Southern Oscillation
ESG Environmental, social and governance
Eurosif The European Sustainable Investment Forum
FUND The Climate Framework for Uncertainty, Negotation and Dis-
tribution
GICS Global Industry Classification Standard
IAM Integrated assessment model
IFC International Finance Corporation
IPCC Intergovermental Panel on Climate Change
IPO Interdecadal Pacific Oscillation
NAICS North Atlantic Classification System
NOA North Atlantic Oscillation
PAGE Policy Analysis of the Greenhouse Effect
PRI Principles for Responsible Investment
RCP Representative Concentration Pathways
SRI Socially responsible investment
SST Sea surface temperature
TCFD Task Force on Climate-related Financial Disclosures
TEG Technical expert group
UNISDR United Nations Office for Disaster Risk Reduction
WITCH World Induced Technical Change Hybrid Model
ixList of Key Concepts
Attribution An analysis tool, commonly applied to explain how excess
performance was achieved for a portfolio compared to bench-
mark, but in this study applied to explain where physical risk
stems from. Brinson Fachler attribution breaks down the dif-
ference between the portfolio and the benchmark into an asset
allocation effect and a security selection effect.
Benchmark An index selected by the fund manager to compare the fund’s
performance against.
Bottom-up Fundamental analysis with focus on individual companies
rather than macroeconomics.
CAPEX Expenditures by a company to buy or maintain physical assets
such as equipment, buildings or technology.
Clausius-Clapeyron An equation in thermodynamics that describes the relation
equation between pressure and temperature in a phase transition.
Climate risk Risks stemming from adverse impact from climate change,
including physical risks and transition risks.
Credit risk The risk that a loan will not be returned.
Drought A period of precipitation deficit and warm temperatures.
ENSO Cycles of ocean-atmosphere interaction in the Pacific Ocean
with warming and cooling periods that impact the climate
globally. The cycles are approximately five years.
Equity The ownership of a part of a company’s business.
Equity portfolio A pool of money that is invested primarily in equities.
Equity risk The risk that the outcome will be lower than expected when
investing into equities.
EU Taxonomy A new regulation in the EU that will define what is sustain-
able in finance. The definition builds on the environmental
objectives of EU, where climate mitigation and climate adap-
tation have been prioritised for the two first Taxonomies.
Heat wave A period of higher temperatures than normally, measured rel-
atively to the local meteorology.
xHeavy precipitation An intense precipitation event that for example can lead to
flood or large run-off.
IAM Integrated assessment models are cross-disciplinary models
that link phenomenon in the biosphere and atmosphere with
the economy.
Index A basket of equities with weights that aims to replicate a piece
of the market.
Investment universe A set of equities that the investment manager can invest into.
Market cap or market The total value of all the equities a company has on the mar-
capitalization ket. Companies are commonly classified into large cap, mid
cap and small cap. The exact definitions of these groups vary;
however, here large cap represents companies with a market
cap value above 10 billion USD and small cap represents com-
panies with a market cap value below 2 billion USD. Mid cap
are companies with a market cap value between 2 and 10 bil-
lion USD.
Physical climate risks Climate risks related to the physical transformation of the
climate such as extreme weather.
Sustainable fund Currently, no common definition exists of what a sustain-
able fund is. Instead, there are several operational defini-
tions. In this study the operational definitions of Morningstar,
YourSRI (Lipper’s classification) and Nordic Swan Ecolabel
are applied.
Tipping point A point where a small change leads to large, non-linear con-
sequences for the climate system.
Transition Climate risks related to the transition to a low-carbon society,
climate risks including market risks, technology risks and regulatory risks.
Top-down Analysis that focuses on the big-picture, such as macroeco-
nomic trends and industry trends and apply them on individ-
ual companies.
Tropical cyclone A low pressure area with circulating air mass, it is often as-
sociated with storm systems. Typhoons and hurricanes are
other names for the same phenomenon.
xi1 Introduction
Human influence causes warming of the climate system. The average land and ocean
surface temperature has increased by 0.85 degrees between 1880 and 2012 (IPCC 2014,
p. 40). In recent decades, the impact from this warming has been observed on natural
systems. The current rate of sea level rise is higher than in the previous two millennia. In
some locations heavy precipitation events has increased, while there are signs of increased
drought events in other locations (ibid.). Climate change leads to changes in intensity and
frequency of extreme weather events (Seneviratne et al. 2012). Recent extreme weather
events reveal significant vulnerability on many human systems to climate variability -
food systems are disrupted, infrastructure is damaged and human well-being is affected
(IPCC 2014). Extreme weather and climate change also pose risk on the financial market
(TCFD 2017). The total economic losses from weather and climate extremes in member
countries of the European Economic Area amounted to EUR 453 billion between 1980
and 2017 (EEA 2017, p. 12).
The awareness of climate risks in the financial sector has in general been limited and cli-
mate risks are currently not always taken sufficiently into account (The European Com-
mission 2018). The Task Force on Climate-related Financial Disclosures (TCFD) states
that risks related to climate change are among the ”most significant, and perhaps most
misunderstood” risks that organisations face today (TCFD 2017, p. ii). However, the
high-level attention towards climate risks has recently increased. In the Global Risk Re-
port of 2020, published by World Economic Forum (2020), all the top five risks in terms
of likelihood are related to environmental aspects such as Extreme weather and Climate
action failure. The European Union (EU) identifies the transition towards a low-carbon
economy as necessary to safeguard long term competitiveness of the economy (The Euro-
pean Commission 2018).
Regulations are now also catching up to put requirements on financial actors to take cli-
mate risks into consideration in investment decisions and financial advisory. In 2018 EU
launched an action plan on sustainable finance for integration of sustainability considera-
tions into the financial policy framework. One of the key action was the incorporation of
climate risks into financial decision-making (ibid.). From 2020, all signatories of Princi-
ples for Responsible Investment (PRI) must report climate risks according to the TCFD
framework (PRI 2019). Disclosure of climate risks according to the TCFD framework was
also a prerequisite for Canadian companies in order to receive monetary support from the
government in the Covid-19 crisis (Department of Finance Canada 2020).
These changes of the landscape of sustainable finance are not happening in isolation.
As part of the EU action plan on sustainable finance, a common taxonomy on what is
sustainability in finance will also be introduced in the EU (TEG 2019). This will, at least
within the EU, replace a scattered view on sustainability and is likely to lead to significant
market changes where investors will need to rethink their strategies in building sustainable
equity funds (ibid.). The taxonomy also introduces specific criteria for economic activities
to significantly contribute to climate adaptation (TEG 2020). Meanwhile on the market
side, the demand for sustainable products is increasing and exceeding the current supply
in Europe (Eurosif 2018).
11.1 Problem Formulation
There is a growing body of research within sustainable finance. The main focus of the
research has been on financial performance of sustainable products compared to non-
sustainable products. Less focus has been given to climate risks (Ferreira et al. 2016;
Groot et al. 2015), with a particular gap for physical climate risks in investing (Bender et
al. 2019; Fang et al. 2018). Financial physical climate risks are here defined accordingly
to TCFDs definition as ”risks related to the physical impacts of climate change” (TCFD
2017, p. 5). Taking into consideration physical aspects of climate risks requires knowledge
also in natural sciences, and these fully inter-disciplinary works are lacking (Linnenluecke
et al. 2013). The increased focus on climate risks proven from financial participants in
the Global Risk Report (World Economic Forum 2020) as well as from the regulatory side
(PRI 2019; The European Commission 2018) in combination with the increasingly urgent
evidence of a changing climate (IPCC 2014) indeed calls for more research in this area.
On the operational side, investor’s methods for managing physical climate risks are cur-
rently very rudimentary (Clapp et al. 2017). A survey on CICERO Climate Finance
Advisory Board, including many representatives from fund management, reveals that the
investors often rely only on carbon intensity data from companies for assessing climate
risks on portfolio level. Company data on physical risks is largely lacking. Carbon inten-
sity does not provide information on how well the company is able to adapt to climate
change (ibid.). Ralite et al. (2019) state that climate risks are not well compatible with
traditional stress tests as traditional stress tests are non-sector specific and have a shorter
time horizon than required for assessing climate risks (ibid.).
Another investment approach for managing climate risks is to target investments labelled
as sustainable (Clapp et al. 2017). Among the many different sustainable investment
strategies, incorporation of sustainability issues in investment decision is the fastest grow-
ing strategy in Europe (Eurosif 2018). It could be so that physical climate risks are
included in these incorporated sustainability issues, but it is unclear how sustainable
products on a larger scale relate to climate risks. In credit risk, where environmental
issues has been included for much longer than in equity risk (Bender et al. 2019; Weber
et al. 2008), research has shown that organisations with good environmental sustainabil-
ity performance have lower credit risk (Höck et al. 2020; Weber et al. 2015). This has
however not been related to better management of physical climate risks but rather to
reputational risks and regulatory risks (Höck et al. 2020). The few studies conducted
in the area of physical equity risk mainly cover climate risks on aggregated sectoral or
regional level (among other: Clapp et al. 2017; Mercer 2015; Ralite et al. 2019; UNEP
Finance Initiative 2019) rather than on portfolio level.
To gain a better understanding of the growing market of sustainable products, a struc-
tured analyze on physical climate risk exposure on sustainable equity funds compared to
the general market is needed. From an operational perspective, this can guide investors
in how to decrease exposure for physical climate equity risk and from an academic per-
spective this adds to an area where only little research has been performed. The study is
conducted at the Skandinaviska Enskilda Banken AB (SEB).
21.2 Aim and Research Questions
The aim of this study is to quantitatively evaluate the physical climate risks of sustainable
equity funds in comparison to the general market on a large scale. The research questions
of the study are as follows:
• How does the physical climate risk exposure of sustainable equity funds compare to
the physical climate risk exposure of the general market?
• What factors contribute to differences in climate risk exposure of funds?
1.3 Delimitations
Sustainable finance is an interdisciplinary research area (Linnenluecke et al. 2016), which
should also be reflected in this study. Nevertheless, this study has its foundation in an
environmental engineering perspective and hence leaves out the economic analysis on how
companies’ financial result and risk affects stock prices. No analysis or discounting for
stocks is made, the results are presented on an ordinal scale instead of monetary quan-
tification.
Climate related financial risks are commonly divided into two main categories, transition
risks and physical risks (TCFD 2017). This study covers the physical risks that relate to
the extreme weather events and new climatic conditions. Risks such as changed market
preferences or regulatory risks are not considered. For some businesses climate change can
bring opportunities of business significance (CDP 2019), such opportunities are however
also outside the scope of this study. Any positive impact is simply treated as zero impact.
Physical climate risk is a broad term spanning over all potential changes in the natural
system that may affect the financial system (TCFD 2017). To limit the scope of this
study, four natural hazards are selected as focus areas: heat waves, heavy precipitation
events, droughts and tropical cyclones. See section 2.5 for a motivation of the selection.
This study takes a top-down approach where climate risks of portfolios are modelled
based on quantitative data. The geographical scope is global and the coverage of the
model includes all listed equities to provide a broad overview of the full market. However,
this also comes with limitations in the level of detail that can be achieved. The model is
not applicable for specific companies or for very local circumstances, but aims to give an
estimate of risks on an aggregated portfolio level.
1.4 Outline
Chapter 2 introduces the theoretical background behind this study, basic financial theory,
sustainable finance with climate risks and climate models. As this study targets readers
from two separate research fields, finance and climate research, the reader may already
be familiar with some of these topics. Chapter 2 also outlines the conceptual framework
of this study. Chapter 3 provides the empirical background to the study, including pre-
vious studies. In chapter 4 the modelling methodology and framework for analysis are
described. Chapter 5 presents the results of the study, first some general results and
thereafter the results on comparisons of sustainable funds and certain characteristics. In
chapter 6 the method is discussed, including the key assumptions and alternative model
3designs. Thereafter follows discussion of the relevance and interpretation of results. Fi-
nally, chapter 7 provides the conclusion of the study together with recommendations for
further studies.
42 Theory
This chapter first gives an introduction to basic financial terms for the reader that is
not familiar with finance. Thereafter follows a description of the area of sustainable
finance, with specific focus on climate risks. Climate models are also introduced with
their strengths and weaknesses. Finally, it is described how the theory presented in
this section is assimilated and applied for the purpose of this study in the conceptual
framework.
2.1 Equity Funds
Equities and stocks are the ownership of a part of a company’s business (Kumar 2014).
When investors buy equities from a company, this gives them the right to a share of a
company’s assets. The investors have, in the case of liquidation of the company, residual
claim on the company’s assets. Listed equities are traded on the stock exchange. This
is a platform for sellers and buyers. Equities play an important role for the growth of
companies. Issuing equities gives funding of investments in the expansion of the company.
The investors of common stocks are paid dividends regularly. The ownership of common
stocks also gives voting rights in the election of the directors (ibid.).
A mutual equity fund, or stock fund, can be defined as a pool of money that is invested
primarily in stocks (Sekhar 2017). The manager of the fund buys and sells equities from
the money collected from the investors of the fund. The investors receive returns from
the dividend on the investments. In turn, the fund manager earns a fee from the investors
(ibid.).
In principle, there are two main types of equity funds: passive funds and active funds
(Sekhar 2017). Passive funds follow a market index. An index is a basket of securities
with weights that aim to replicate a piece of the market. For example, the Standard &
Poor’s 500 (S&P 500) is an index of 500 large companies traded in the US and is used as
a proxy for the US stock market. The holdings and the weights of an index fund must
have the same proportion as index. Active funds have more freedom in their investment
decisions, but they must follow the stated objective of the fund. This is the objective that
the investors have agreed to when investing in the fund. For example, there are funds that
only invest in specific sectors or regions. To measure performance, active equity funds
are often compared to a certain benchmark selected by the fund manager as a standard.
Since active funds often have a higher fee than passive index funds they must outperform
the benchmark or the market to present a rational option for investors (ibid.).
2.2 Financial Risk
A central concept in finance is risk. Different situations bring different types of risks. For
example, credit risk is the risk when lending assets that the loan will not be returned
(Hull 2006). Investment risk is the risk when investing into assets that the outcome or
return will be lower than expected (Brealey et al. 1996). Investment risk of equity funds
is the focus of this study. The volatility in prices of investments is commonly measured as
the standard deviation from the expected return. In general, the higher risk the investor
is exposed to, the higher is the potential return. The compensation for the risk exposure
5compared to a risk-free asset is referred to as the risk premium. Risk is therefore con-
nected to the value of stocks and companies. Companies that manage to reduce their risk
and provide stable growth are likely to enhance their market value (Olson et al. 2010).
Risk-free assets are in theory deterministic with a standard deviation of 0 (Luenberger
1998). In practice, US Treasuries are among the investments that are the closest to be
risk free assets (Brealey et al. 1996).
Financial risk is typically divided into two broad categories, systematic risk and unsystem-
atic risk. The systematic risk affects an entire economic market. This causes an unison
movement of all stocks on the market, either up or down (Hull 2006). Unsystematic risk
is specific for the company or the stock and uncorrelated with the market. In contrast
to systematic risks, unsystematic risks can be reduced by a diversification (Luenberger
1998). Unsystematic risks can derive from the inherent external environment of the com-
pany such as the industry of business or the internal environment with internal operational
processes and resources (Olson et al. 2010). The risk when investing into equities can be
further broken down into more granular categories. One categorisation of risk according
to Investopedia (Chen 2020) groups risk into five main categories: business risk, country
risk, financial risk, liquidity risk and exchange-rate risk. See Figure 1. Please note that
also other categorisations and groupings of risk exist, for example Baker et al. (2015) that
differentiates also for example governmental risk and behavioral risks.
Figure 1: The components of equity risk according to a classification by Investopedia (Chen 2020)
.
In the definition of Investopedia (Chen 2020), illustrated in Figure 1, business risk is asso-
ciated with the company’s operations and the inherent environment where it operates, for
example sector specific characteristics. Country risk is specific for the region or country,
this could for example include political risks. Financial risk is related to the company’s
capacity to finance its operations and pay its debts. Liquidity risk is the uncertainty
when selling an asset, stocks with high liquidity can be sold easily while stocks with low
liquidity can be costly or time-consuming to sell. Finally, exchange rate risk is the risk
when investing in assets denominated in other currencies (ibid.).
6For fund managers, maintaining risk on a certain level is an important part of achieving
the fund objective. Common risk control measures applied on fund level are (Sekhar
2017):
• The investment objectives and restrictions
• Asset allocation
• Investment limits
• Positioning
• Benchmark index
The fund manager regularly monitors these control measures (Sekhar 2017). It is im-
portant for the fund to always follow the fund objective, it is a responsibility towards
the investors. A common indicator for financial performance of a portfolio is tracking
error. Tracking error is the standard deviation of the difference between the return on
investment for the fund compared to benchmark. Deviations from the benchmark implies
a risk for lower return than benchmark. Many active funds keep a low tracking error,
that is follow the benchmark closely to minimize this risk (ibid.).
2.3 Sustainable Finance
In general terms, sustainable finance is the process of incorporating environmental, social
and governance (ESG) considerations into investment decisions (Eurosif 2018; The Eu-
ropean Commission 2018). Environmental considerations refer to mitigation of negative
environmental impacts, adaptation to environmental changes and management of envi-
ronmental risks. Social considerations refer to issues such as labour conditions, inequality,
community and inclusiveness. Social and environmental aspects are often interconnected
(The European Commission 2018). Sustainable finance has an important role to play in
the strive towards a more sustainable society. Reorientation of capital can stimulate sus-
tainable initiatives, while holding non-sustainable initiatives back (ibid.). Furthermore,
investment and financing are directly present in decision making on projects and activities
that promote the environment (Ferreira et al. 2016). The demand for sustainable prod-
ucts is growing on the financial market. Currently, the demand of sustainable products
on the European market exceeds the supply (Eurosif 2018).
2.3.1 Sustainable Funds
No broadly accepted definition on what sustainable finance is exists today. This poses a
challenge for investors to set up goals and choose sustainable investments (Eurosif 2018).
In 2016, the board of The European Sustainable Investment Forum (Eurosif ) reached
consensus on how to define Socially Responsible Investment (SRI), which can represent
the European common view:
7Sustainable and responsible investment (”SRI”) is a long term oriented investment
approach which integrates ESG [Environmental, Social and Governance] factors
in the research, analysis and selection process of securities within an investment
portfolio. It combines fundamental analysis and engagement with an evaluation
of ESG factors in order to better capture long term returns for investors, and to
benefit society by influencing the behaviour of companies (Eurosif 2018, p. 12).
The lack of a shared understanding of what sustainable investments is was one of the
drivers for the EU Action Plan for Sustainable Finance. One of the pillars of the ac-
tion plan is to provide clarity in this issue (The European Commission 2018). In March
2020 the final proposal for a common language - a Taxonomy - for sustainable activities
was launched (TEG 2020). The Taxonomy contains a list of activities and corresponding
thresholds for when these are regarded sustainable. The first Taxonomy covers EU envi-
ronmental objectives for climate mitigation and climate adaptation, but also Taxonomies
for the remaining environmental objectives are to be launched. Specifically, the Taxonomy
for climate adaptation has specific criteria for what economic activities that significantly
contribute to the adaptation to a changed climate (ibid.).
Sustainable equity funds should not be mixed up with non-commercial funds. Sustainable
equity funds are expected to bring returns, and ESG integration and positive returns
should go hand in hand (Eurosif 2018; PRI 2016). In the mission statement of PRI, they
state that they believe that sustainability is necessary for long term value creation (PRI
2016). There is a broad range of sustainable investment strategies on the market today.
These can be divided into seven categories, see Table 1.
8Table 1: Sustainable investment strategies (Eurosif 2018; Scholtens 2014)
Strategy Description
Exclusion Exclusion of holdings (companies, sectors, countries)
from the investment universe based on ESG criteria
Norm-based screening Screening of investments according to international
norms (UN Global Compact, OECD Guidelines for
Multinational Enterprises, ILO Core Conventions etc.)
Engagement and voting on Active ownership of stock holders and engagement
sustainability matters to impact companies to improve in ESG aspects
Best-in-class investing Investing in leading performance companies within
selection their class based on ESG critera
Impact investing Investing in companies with the intention to
generate ESG impact, besides financial return
Sustainability themed Selecting investments based on sustainability
investment linked themes
Integration of ESG factors Inclusion of ESG risk and opportunities into
in financial analysis financial analysis
About half of the managed assets in the EU apply at least one of these strategies. His-
torically, sustainable investments have predominantly applied exclusion (Scholtens 2014).
Exclusion is still the dominant strategy, but also other strategies involving pro-active
positive screening and involvement are growing. According to questionnaire responses
from 293 European SRI market participants (asset managers, banks and asset owners),
integration of ESG factors in financial analysis is the fastest growing strategy. Integration
of ESG factors in investment decisions can include, but is not limited to, consideration of
climate risks. Exclusion is decreasing as a strategy, although still dominating. Common
exclusion criteria are weapons, tobacco and gambling. Impact investment, Best-in-class
investment and Sustainability themed investment remains small, but are growing strate-
gies (Eurosif 2018).
Despite the lack of a theoretical definition of sustainability in finance, there are many op-
erational definitions of sustainability. Many labels and certification schemes evaluate the
sustainability of equity funds based on different criteria and priorities. Some example of
providers of sustainability ratings are Morningstar, MSCI, Sustainalytic, BloombergESG,
RobescoSAM and Nordic Swan Ecolabel. A study by Kumar et al. (2019) showed that the
correlation between some of the main sustainability ratings on the market was poor. In
pair-wise correlation tests between the ESG scores of MSCI, Sustainalytics, BloomberESG
and RobescoSAM the correlation ranged between 0.46 and 0.76 (p. 2). There is also a
challenge with transparency of the methodology applied for the different ratings (ibid.).
92.3.2 Climate Related Risk in Finance
Climate risks are commonly divided into two main categories, transitional risks and phys-
ical risks. Transitional risks include policy risk from changed regulations and litigation
claims, technology risks from new innovations disrupting existing systems, market risks
with changes in demand and supply and reputational risks. The focus of this study in
only on physical risks. Physical risks include event driven and long term shifts in climate
patterns that impact organisations financially (TCFD 2017). Incremental climate change
can affect organisations’ financial performance both from the cost- and revenue side. Costs
can increase in operating costs (eg. higher price on water for cooling power plants), in
capital costs (eg. damage to facilities), higher prices on raw material, increased insurance
premiums, write-offs and early retirement of assets and negative impact on workforce.
Revenue can decrease from lower productivity and lower sales (Clapp et al. 2017; TCFD
2017). Acute changes and extreme events can lead to damage of property value, lost
production for fixed assets, operational downtime and risk to employee safety (Connell et
al. 2018; TCFD 2017). Through global supply chains and multinational companies also
companies not located in an affected area can be damaged through disrupted deliveries
or sales (Clapp et al. 2017). See Figure 2 for a systematic overview on how physical risks
impact financial risks. Adaptation to climate change can also present opportunities for
early movers. Developing risk-resilient technologies can give advantages in competition
(Clapp et al. 2017; TCFD 2017).
Figure 2: A systematic view on how physical climate risks impact financial risk. Based on Ralite et al.
(2019), p. 19.
The attention to climate risks and environmental risks has increased in recent years. In the
Global Risk Report 2020 all the top five risks in terms of likelihood, and three of five top
risks in terms of impact, were related to environmental aspects. The Global Risk Report
is an annual study published by World Economic Forum and reflects a multi-stakeholder
view of risk. Sources include experts and major insurance companies. When studying
the progress of listed risks the last ten years, there is a clear trend towards more and
more focus on environmental risks. The report of 2020 was the first ever where all the top
five risk came from the same risk category (Environment) (World Economic Forum 2020).
10In June 2017 TCFD released its ”Recommendations of the Task Force on Climate-related
Financial Disclosures” to develop voluntary and consistent financial disclosures that allow
investors to assess climate risks. TCFD developed four main recommendations for finan-
cial reporting on climate related aspects (TCFD 2017). The four recommendations relate
to disclosure of governance, strategy, risk and targets for climate risks. When describ-
ing the potential impact of climate risks on the business strategy, it is recommended to
apply a scenario-based approach (ibid.). These recommendations have been adopted by
many organisations (PwC n.d.). From 2020 and onwards all PRI signatories must report
their climate risks according to TCFD’s recommendations (PRI 2019). The recommenda-
tions apply across sectors, but the financial sector is mentioned as particularly important
(TCFD 2017).
In EU’s action plan for sustainable finance, one of the key objectives was the incorporation
of climate risks into financial decision-making (The European Commission 2018). One of
the main tools for achieving this is Regulation (EU) 2019/2088 on sustainability-related
disclosures in the financial services sector that entered into force in 2020, and that will
be applied in 2021. Article 6 states the following:
Financial market participants shall include descriptions of the following in pre-
contractual disclosures (a) the manner in which sustainability risks are integrated
into their investment decisions; and (b) the results of the assessment of the likely
impacts of sustainability risks on the returns of the financial products they make
available.
2.4 Climate Models
Climate models are fundamental research tools for understanding past and future climate
(Rummukainen 2010). In its simplest form, a climate model is derived from physical
laws which are subjected to physical approximations for the large scale climate system,
and further approximated with mathematical discretisation. Computational power con-
straints the resolution that is possible in discretisation of equations in climate models
(IPCC 2007). Global climate models have a high resolution for simulating phenomena on
the level of the general atmospheric circulation or sub-continental precipitation patterns.
The real resolution is of the order of 1,000 km (Feser et al. 2011, p. 83). With a coarse grid
resolution extremes may be averaged out since the grid represent a larger area. Certain
local phenomenon may therefore not be registered (Feser et al. 2011; Rummukainen 2010).
The starting point for numerical models, the initial conditions, are based on observed
values. Uncertainty in the choice of initial conditions is most relevant for short term
predictions. In general, the climate system is highly complex and a model cannot include
all processes. Many models exist, with different parametrisations and choices of what to
describe and what to neglect. The uncertainty that stems from model choices is struc-
tural. To reduce such uncertainty, an ensemble of models is often applied. Multi-model
ensembles are sets of model simulations from models with different structures (Tebaldi et
al. 2007). Generally, multi-model ensembles are found to better forecast climate (Rozante
et al. 2014; Tebaldi et al. 2007). Some characteristics of the climate are however still hard
to reflect in climate models.
11One such characteristic is tipping points. Tipping points are critical thresholds where the
climate shifts abruptly from one stable state to another stable state. The change may
be irreversible. The risk for tipping points is moderate in a warming of 0-1◦ but steeply
increases under further warming (IPCC 2014).
To predict future climate, the Intergovernmental Panel on Climate Change (IPCC) uses
the Representative Concentration Pathways (RCP) as a standard, see Figure 3. The
RCPs describe four scenarios for atmospheric greenhouse gas concentrations in the 21st
century (IPCC 2014) . The scenarios represents, and are labelled after, a radiative forcing
of 2.6 W/m2 to 8.5 W/m2 in 2100 (Vuuren et al. 2011).
Figure 3: Illustration of IPCC’s Representative Concentration Pathways and the corresponding average
surface temperature change (IPCC 2014, figure SPM.6 p. 11).
RCP2.6 in Figure 3 is a mitigation scenario that likely keeps the global warming below
2◦ C compared to pre-industrial levels. For RCP6.0 and RCP8.5 is the warming likely to
exceed 2◦ C, and for RCP4.5 the warming is more likely than not to exceed 2◦ C (IPCC
2014, p. 10). Business as usual leads to pathways between RCP6.0 and RCP8.5 (ibid.).
2.5 Conceptual Framework
Physical climate risk is a relatively new concept in investment finance. The traditional
financial risk analysis does not explicitly include climate risks, see Figure 1. However,
the assumption of this study is that physical climate risks can be incorporated into this
more traditional financial framework. For example, the changes of hazard probability in a
warmer climate can be incorporated under country risks as they are region specific. The
framework by Ralite et al. (2019) in Figure 2 further shows touch-points of climate risks
onto the financial system. These two frameworks, the more traditional view on equity
risk and the illustration of impact from physical climate risks, are joined together for
the purpose of this interdisciplinary study. Because of the focus on equity funds in this
study, the risk control measures on fund level according to (Sekhar 2017) are also added
as a second level of factors that impact risk. Together this makes the conceptual frame-
work of this study, see Figure 4. The fund manager selects from equities that all have
12You can also read