R evolution energy - Greenpeace
←
→
Page content transcription
If your browser does not render page correctly, please read the page content below
energy
       [r]evolution
       A SUSTAINABLE NEW ZEALAND ENERGY OUTLOOK

report 2nd edition 2013 new zealand energy scenario
“will we look into the eyes
      of our children and confess
      that we had the opportunity,
      but lacked the courage?
      that we had the technology,
      but lacked the vision?”

                                      Greenpeace International,             Greenpeace New Zealand                research & co-authors
                                      European Renewable                    Simon Boxer                           Overall modelling: DLR, Institute
                                      Energy Council (EREC)                                                       of Technical Thermodynamics,
                                                                            Greenpeace International              Department of Systems Analysis and
                                      date February 2013                    Sven Teske                            Technology Assessment, Stuttgart,
                                      project manager                       Global Wind Energy Council            Germany: Dr. Thomas Pregger,
                                      & lead author Sven Teske,             (GWEC): Steve Sawyer                  Dr. Sonja Simon, Dr. Tobias Naegler,
 partners                             Greenpeace International                                                    Marlene O’Sullivan

image LA DEHESA, 50 MW PARABOLIC THROUGH SOLAR THERMAL POWER PLANT WITH MOLTEN SALTS STORAGE IN SPAIN. COMPLETED IN FEBRUARY 2011, IT IS LOCATED IN
LA GAROVILLA AND IT IS OWNED BY RENOVABLES SAMCA. WITH AN ANNUAL PRODUCTION OF 160 MILLION KWH, LA DEHESA WILL BE ABLE TO COVER THE ELECTRICITY NEEDS
OF MORE THAN 45,000 HOMES, PREVENTING THE EMISSION OF 160,000 TONNES OF CARBON. THE 220 H PLANT HAS 225,792 MIRRORS ARRANGED IN ROWS AND 672 SOLAR
COLLECTORS WHICH OCCUPY A TOTAL LENGTH OF 100KM. BADAJOZ.
© MARKEL REDONDO/GREENPEACE

Transport: DLR, Institute of Vehicle   Employment: Institute for              editor Alexandra Dawe,                 contacts
Concepts, Stuttgart, Germany:          Sustainable Futures, University of     Rebecca Short, Crispin Aubrey          sven.teske@greenpeace.org
Dr. Stephan Schmid, Johannes           Technology, Sydney: Jay Rutovitz       (basic document).                      simon.boxer@greenpeace.org
Pagenkopf, Benjamin Frieske            and Hala Razian
Efficiency: Utrecht University,        Grid technology: energynautics         design & layout onehemisphere,
The Netherlands: Wina Graus,           GmbH, Langen/Germany; Dr. Thomas       Sweden, www.onehemisphere.se
Katerina Kermeli                       Ackermann, Rena Ruwahata,
Fossil Fuel Resource Assessment:       Nils Martensen
Ludwig-Bölkow Systemtechnik,
Munich, Germany; Dr. Werner Zittel

for further information about the global, regional and national scenarios please visit the Energy [R]evolution website: www.energyblueprint.info/
Published by Greenpeace International and EREC. (GPI reference number JN 439). Printed on 100% recycled chlorine-free paper.

ENERGY [R]EVOLUTION
A SUSTAINABLE NEW ZEALAND ENERGY OUTLOOK

contents

introduction                                               8    4   scenarios for a future energy supply                           40

                                                                    4.1    scenario background                                     42
executive summary                                          10       4.1.1 status and future projections for renewable
                                                                           heating technologies                                    42
                                                                    4.2    population development                                  42
1   climate and energy policy                              13       4.3    economic growth                                         42
                                                                    4.4    oil and gas price projections                           43
    1.1     the UNFCCC and the kyoto protocol              14       4.5    cost of CO2 emissions                                   44
    1.2     international energy policy                    14       4.6    cost projections for efficient fossil fuel generation
    1.3     new zealand government’s energy strategy       15              and carbon capture and storage (CCS)                    44
    1.3.1   policies                                       15       4.7    cost projections for renewable
    1.4     renewable energy targets                       17              energy technologies                                     45
    1.5     policy changes in the energy sector            17       4.7.1 photovoltaics (pv)                                       46
    1.5.1   the most effective way to implement                     4.7.2 concentrating solar power (csp)                          46
            the energy [r]evolution: feed-in laws          18       4.7.3 wind power                                               47
                                                                    4.7.4 biomass                                                  47
                                                                    4.7.5 geothermal                                               48
2   the energy [r]evolution concept                        19       4.7.6 ocean energy                                             48
                                                                    4.7.7 hydro power                                              49
    2.1     key principles                                 20
                                                                    4.7.8 summary of renewable energy cost development             49
    2.2     the “3 step implementation”                    21
                                                                    4.8    cost projections for renewable
    2.3     the new electricity grid                       24
                                                                           heating technologies                                    50
    2.3.1   hybrid systems                                 25
                                                                    4.8.1 solar thermal technologies                               50
    2.3.2   smart grids                                    26
                                                                    4.8.2 deep geothermal applications                             50
    2.3.3   the super grid                                 28
                                                                    4.8.3 heat pumps                                               50
    2.3.4   baseload blocks progress                       28
                                                                    4.8.4 biomass applications                                     50
    2.4     case study: a year after the german
                                                                    4.9    assumptions for fossil fuel phase out                   51
            nuclear phase out                              31
                                                                    4.9.1 oil - production decline assumptions                     51
    2.4.1   target and method                              31
                                                                    4.9.2 coal - production decline assumptions                    51
    2.4.2   carbon dioxide emissions trends                31
                                                                    4.10 review: greenpeace scenario
    2.4.3   shortfall from first round of closures         31
                                                                           projections of the past                                 52
    2.4.4   the renewable energy sector in germany         31
                                                                    4.10.1 the development of the global wind industry             52
    2.4.5   energy and climate targets                     32
                                                                    4.10.2 the development of the global
    2.4.6   details of the german nuclear phase-out plan   32              solar photovoltaic industry                             54
    2.4.7   no ‘blackouts’                                 32       4.11 how does the energy [r]evolution scenario
                                                                           compare to other scenarios                              56

3   implementing the energy [r]evolution                   34

    3.1   renewable energy project planning basics         35
    3.2   renewable energy financing basics                36
    3.2.1 overcoming barriers to finance and investment
          for renewable energy                             38
    3.2.2 how to overcome investment barriers
          for renewable energy                             39

4
image GREENPEACE AND AN INDEPENDENT
                                                                     NASA-FUNDED SCIENTIST COMPLETED
                                                                     MEASUREMENTS OF MELT LAKES ON THE

                                                                                                                                 © GP/NICK COBBING
                                                                     GREENLAND ICE SHEET THAT SHOW ITS
                                                                     VULNERABILITY TO WARMING TEMPERATURES.

5   key results of the New Zealand energy [r]evolution scenario 57   8   transport                                                83

    5.1    energy demand by sector                             58        8.1     technical and behavioural measures to
    5.2    electricity generation                              60                reduce transport energy consumption              85
    5.3    future costs of electricity generation              61        8.1.1   step 1: reduction of transport demand            85
    5.4    future investments in the power sector              61        8.1.2   step 2: changes in transport mode                86
    5.5    heating supply                                      62        8.1.3   step 3: efficiency improvements                  87
    5.6    future investments in the heat sector               63        8.2     light-duty vehicles                              88
    5.7    future employment in the energy sector                        8.2.1   projection of the CO2 emission development       88
    5.8    transport                                           64        8.2.2   projection of the future vehicl segment split    89
    5.9    development of CO2 emissions                        65        8.2.3   projection of the future technology mix          89
    5.10   primary energy consumption                          65        8.2.4   renewable energy in the transport sector         89
                                                                         8.3     conclusion                                       89

6   employment projections                                     67
                                                                     9   glossary & appendix                                      91
    6.1    methodology to calculate jobs                       68
    6.2    overview                                            68        9.1  glossary of commonly used terms and abbreviations 92
    6.3    limitations                                         69        9.2  definition of sectors                             92
    6.4    employment factors                                  69        scenario results data                                  93
    6.5    coal, gas and renewable technology trade            70
    6.6    adjustment for learning rates - decline factors     70
    6.7    future employment in the energy sector              71
    6.8    employment in the renewable heating sector          73
    6.8.1 employment in solar heating                          73
    6.8.2 employment in geothermal and heat pump heating       73
    6.8.3 employment in biomass heat                           73
    6.8.4 employment in hydro                                  74
    6.8.5 employment in biomass                                74
    6.8.6 employment in geothermal power                       75
    6.8.7 employment in wind energy                            75
    6.8.8 employment in solar photovoltaics                    75
    6.8.9 employment in coal                                   76
    6.8.10 employment in gas, oil & diesel                     76

7   the silent revolution – past and current
    market developments                                        78

    7.1    the global market shares in the power plant
           market: renewables gaining ground                 81
    7.2    development of the installed power plant capacity
           in europe                                         82

                                                                                                                                          5
ENERGY [R]EVOLUTION
A SUSTAINABLE NEW ZEALAND ENERGY OUTLOOK

list of figures
2                                                                          6
figure 2.1     centralised generation systems waste more than              figure 6.1   employment in the energy sector
               two thirds of their original energy input              21                under the reference scenario and the
figure 2.2     a decentralised energy future                          22                energy [r]evolution scenarios                         71
figure 2.3     the smart-grid vision for the energy [r]evolution      27   figure 6.2   employment in the energy sector by
figure 2.4     a typical load curve throughout europe, shows                            technology in 2010 and 2030                           72
               electricity use peaking and falling on a daily basis   29   7
figure 2.5     the evolving approach to grids                         29   figure 7.1   global power plant market 1970-2010                   79
figure 2.6     renewable energy sources as a share of                      figure 7.2   global power plant market 1970-2010, excl china       80
               energy supply in germany                               32   figure 7.3   europe (eu 27): annual power plant market
figure 2.7     renewable energy sources in total final energy                           1970-2010                                             80
               consumption in germany 2011/2010                       32   figure 7.4   power plant market shares 1970-2010                   81
figure 2.8     phase out of nuclear energy                            33   figure 7.5   new installed capacity and decommissioned
figure 2.9     electricity imports/exports germany                    33                capacity in mw. total 35,468 mw.                      82

3                                                                          8
figure 3.1     return characteristics of renewable energies           36   figure 8.1   development of final energy use per transport mode
figure 3.2     overview risk factors for renewable energy projects    37                from 2010 to 2050 in the reference scenario           84
figure 3.3     investment stages of renewable energy projects         37   figure 8.2   world (stock-weighted) passenger transport
figure 3.4     key barriers to renewable energy investment            39                energy intensity for 2009 and 2050                    86
                                                                           figure 8.3   world average (stock-weighted) freight
4                                                                                       transport energy intensity in the energy
                                                                                        [r]evolution scenario                                 86
figure 4.1     future development of investment costs for
               renewable energy technologies                          49   figure 8.4   fuel share of electric and diesel rail traction for
                                                                                        passenger and freight transport                       88
figure 4.2     expected development of electricity generation
               costs from fossil fuel and renewable options           49   figure 8.5   sales share of vehicle technologies up to 2050 in
                                                                                        the energy [r]evolution scenario for new zealand      89
figure 4.3     global oil production 1950 to 2011 and
               projection till 2050                                   51
figure 4.4     coal scenario: base decline of 2% per year
               and new projects                                       51
figure 4.5     wind power: short term prognosis vs real market
               development - global cummulative capacity              52
figure 4.6     wind power: long term market projects until 2030       53
figure 4.7     photovoltaic: short term prognosis vs real market
               development - global cummulative capacity              54
figure 4.8     photovoltaic: long term market projects until 2030     55

5
figure 5.1     total final energy demand under the reference
               scenario and the energy energy [r]evolution scenario   58
figure 5.2      development of electricity demand by sector
               in the energy [r]evolution scenario                    59
figure 5.3     development of the transport demand by
               sector in the energy [r]evolution scenario             59
figure 5.4     development of heat demand by sector in
               the energy [r]evolution scenario                       59
figure 5.5     electricity generation structure under
               the reference scenario and the energy
               [r]evolution scenario                                  60
figure 5.6     total electricity supply costs & specific
               electricity generation costs under two scenarios       61
figure 5.7     investment shares - reference scenario
               versus energy [r]evolution scenario                    61
figure 5.8     heat supply structure under the reference
               scenario and the energy [r]evolution scenario          62
figure 5.9     investments for renewable heat generation
               technologies under the reference scenario and the
               energy [r]evolution scenario                           63
figure 5.10    final energy consumption for transport
               under the reference scenario and the energy
               [r]evolution scenario                                  64
figure 5.11    primary energy consumption under
               the reference scenario and the energy
               [r]evolution scenario                                  65
figure 5.12    development of CO2 emissions by sector
               under the energy [r]evolution scenarios                65

6
image NORTH HOYLE WIND FARM,
                                                                    UK’S FIRST WIND FARM IN THE IRISH SEA WHICH

                                                                                                                                        © ANTHONY UPTON 2003
                                                                    WILL SUPPLY 50,000 HOMES WITH POWER.

list of tables
2                                                                   6
table 2.1    power plant value chain                           23   table 6.1      methodology overview                                 68
table 2.2    german government short, medium and                    table 6.2      employment factors used in the 2012 analysis
             long term binding targets                         33                  for new zealand                                      69
                                                                    table 6.3      technology cost decline factors                      70
3                                                                   table 6.4      total employment in the energy sector                71
table 3.1    how does the current renewable energy market           table 6.5      employment in the energy sector by technology,
             work in practice?                                 35                  two technologies                                     72
table 3.2    categorisation of barriers to renewable                table 6.6      solar heating: capacity, heat supplied
             energy investment                                 38                  and direct jobs                                      73
                                                                    table 6.7      geothermal and heat pump heating: capacity,
4                                                                                  heat supplied and direct jobs                        73
table 4.1    population development projections                42   table 6.8      biomass heat: direct jobs in fuel supply             73
table 4.2    gdp development projections                       43   able 6.9       hydro: capacity, generation and direct jobs          74
table 4.3    development projections for fossil fuel and            table 6.10     biomass: capacity, generation and direct jobs        74
             biomass prices in $NZ                             43   table 6.11     geothermal power: capacity, generation and
table 4.4    assumptions on CO2 emissions cost development                         direct jobs                                          75
             for Annex-B and Non-Annex-B countries                  table 6.12     wind energy: capacity, generation and
             of the UNFCCC                                     44                  direct jobs                                          75
table 4.5    development of efficiency and investment costs         table 6.13     solar photovoltaics: capacity, generation and
             for selected new power plant technologies         45                  direct jobs                                          75
table 4.6    photovoltaics (pv) cost assumptions               46   table 6.15     fossil fuels: capacity, generation and direct jobs   76
table 4.7    concentrating solar power (csp) cost assumptions 46
                                                                    8
table 4.8    wind power cost assumptions                       47
table 4.9    biomass cost assumptions                          47   table 8.1      selection of measure and indicators                  85
table 4.10   geothermal cost assumptions                       48
table 4.11   ocean energy cost assumptions                     48
                                                                    9
table 4.12   hydro power cost assumptions                      49
                                                                    table 9.1      conversion factors – fossil fuels                    92
table 4.13   overview over expected investment costs for
             pathways for heating technologies                 50   table 9.2      conversion factors – different energy units          92
table 4.14   overview of key parameter of the illustrative          table 9.3-9.17 new zealand scenario results                         94
             scenarios based on assumptions that are exogenous
             to the models respective endogenous model results 56

5
table 5.1    renewable electricity generation capacity
             under the reference scenario and the energy
             [r]evolution scenario                             60
table 5.2    renewable heating capacities under
             the reference scenario and the energy
             [r]evolution scenario                             62
table 5.3    renewable heat generation capacities
             under the reference scenario and the energy
             [r]evolution scenario                             63
table 5.4    transport energy demand by mode under
             the reference scenario and the energy
             [r]evolution scenario                             64
table 5.5    investment costs for electricity generation and
             fuel cost savings under the energy [r]evolution
             scenario compared to the reference scenario       66

                                                                                                                                                  7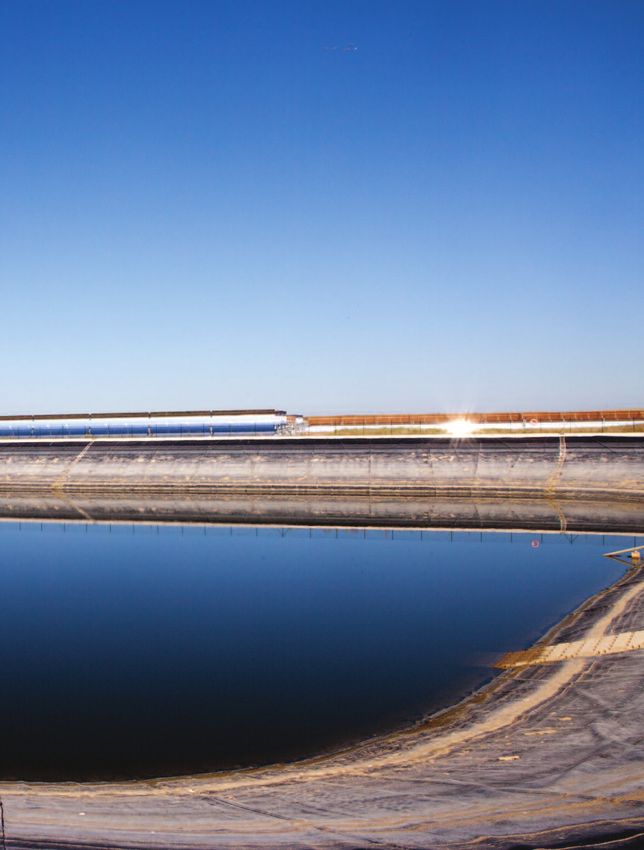
ENERGY [R]EVOLUTION
A SUSTAINABLE NEW ZEALAND ENERGY OUTLOOK

introduction
“NOT LEAST IN TIMES OF TIGHT PUBLIC BUDGETS, CREDIBLE LONG-TERM COMMITMENTS ARE NEEDED. TARGETS HAVE PROVEN TO BE A
KEY ELEMENT FOR TRIGGERING THE VITAL INVESTMENTS WHICH ARE NEEDED FOR A TRANSITION TO A SUSTAINABLE ENERGY SYSTEM.”

                                                                                                                                              © DMITRY NAUMOV/DREAMSTIME
image SUNLIGHT RAYS POUR THROUGH FERN LEAVES IN A NEW ZEALAND FOREST.

This 2nd edition of the New Zealand Energy [R]evolution comes at        The Government has renewed its commitment to the target of
a critical juncture in our energy history. The energy policy choices    90% of our electricity coming from renewable energy by 2025.
being made by the New Zealand Government in the next few years          However, there is no strategy for getting there and it has
will determine whether the country can become less dependent on         overlooked the necessary electricity market policy measures that
economically and environmentally costly fossil fuels.                   will enable this target to be met. This is clearly evident in the
                                                                        Government’s latest forecast that we will only achieve 80%
Despite having an electricity sector that in 2011 supplied over
                                                                        renewable electricity supply in 2030, with both coal and gas still
70% electricity from renewable resources, mainly from hydro, the
                                                                        supplying almost 20% of electricity demand.
overall energy picture is looking bleak. The Government’s Energy
Strategy is clearly focused on achieving a major escalation of          With its support for the massive development of the country’s
petroleum and coal extraction whilst undermining our renewables         lignite coal reserves for liquid fuels and its preferred focus on a
industry by further weakening the Emissions Trading Scheme.             major road building scheme over public transport investment,
And in its strongest signal yet to the rest of the world about          New Zealand is on the verge of being locked into a high carbon
where the Government stands on climate change, New Zealand              energy pathway. This will prove both costly and damaging to
withdrew from the second commitment term of the legally                 consumers and the economy in the decades ahead.
binding Kyoto Protocol.

8
image THE MARANCHON WIND TURBINE FARM IN

                                                                                                                                      © GP/FLAVIO CANNALONGA
                                                                    GUADALAJARA, SPAIN IS THE LARGEST IN EUROPE
                                                                    WITH 104 GENERATORS, WHICH COLLECTIVELY
                                                                    PRODUCE 208 MEGAWATTS OF ELECTRICITY,
                                                                    ENOUGH POWER FOR 590,000 PEOPLE, ANUALLY.

However, New Zealand is endowed with a wealth of renewable          The New Zealand Energy [R]evolution 2013 presents a blueprint
energy resources with world class expertise in renewable energy     for how to achieve a more sustainable energy system now and for
technologies, especially in geothermal energy, that could be the    generations to come. Such a profound change will deliver a
foundation of a major export industry. With the right Government    variety of skilled home-grown green jobs at a time when
support and market framework, New Zealand businesses could          manufacturing jobs are being lost and unemployment is on the
rightly claim a lucrative share of the rapidly expanding global     rise. Investment in renewable energy, which is now becoming
clean energy market.                                                competitive with fossil fuels, can also help cut household bills and
                                                                    improve well-being.
This publication shows that the New Zealand Energy [R]evolution
scenario creates 5,000 more jobs by 2030 than the business as       Under this Energy [R]evolution scenario, New Zealand will
usual reference case, where little is done to support a shift to    become the role-model for the rest of the world in achieving in
renewable energy. Renewable energy and increased energy             low carbon, prosperous economy. It will boost the national
efficiency are the effective means of both reducing emissions and   wealth, reduce costs to consumers and create new industries and
improving security of energy supply.                                jobs that can compete on the world stage. New Zealanders will
                                                                    once again pioneer the energy solutions to the world’s greatest
                                                                    challenge, climate change.

                                                                    Sven Teske                       Simon Boxer
                                                                    CLIMATE & ENERGY UNIT            CLIMATE TEAM LEADER
                                                                    GREENPEACE INTERNATIONAL         GREENPEACE NEW ZEALAND

                                                                    Steve Sawyer
                                                                    SECRETARY GENERAL
                                                                    GLOBAL WIND ENERGY
                                                                    COUNCIL (GWEC)

                                                                    FEBRUARY 2013

                                                                                                                                                  9
ENERGY [R]EVOLUTION
A SUSTAINABLE NEW ZEALAND ENERGY OUTLOOK

executive summary
“THE SCALE OF THE CHALLENGE REQUIRES A COMPLETE TRANSFORMATION OF THE WAY WE PRODUCE, CONSUME AND
DISTRIBUTE ENERGY, WHILE MAINTAINING ECONOMIC GROWTH.”

                                                                                                                                         © BRIAN SCANTLEBURY/DREAMSTIME
image WIND TURBINES ON HILLS OF MANAWATU FARMLAND, NEW ZEALAND.

The expert consensus is that a fundamental shift in the way we       areas, will be a central tool in providing sustainable electricity to
consume and generate energy must begin immediately and be well       the almost two billion people around the world who currently do
underway within the next ten years in order to avert the worst       not have access to electricity.
impacts of climate change.1 The scale of the challenge requires a
complete transformation of the way we produce, consume and
                                                                     the energy [r]evolution – key results
distribute energy, while maintaining economic growth. The five key
principles behind this Energy [R]evolution will be to:               Renewable energy sources accounted for 36.2% New Zealand’s
                                                                     primary energy demand in 2009. The main sources are
• Implement renewable solutions, especially through
                                                                     geothermal, hydro and biomass, which are mostly used in the
  decentralised energy systems and grid expansions
                                                                     power and the heat sector.
• Respect the natural limits of the environment
                                                                     Renewables contributed about 72% for electricity generation
• Phase out dirty, unsustainable energy sources                      and for heat supply around 41%, thereof mostly biomass and
                                                                     geothermal heat but increasingly from heat pumps and - although
• Create greater equity in the use of resources
                                                                     to a much lower extend - solar thermal collectors as well.
• Decouple economic growth from the consumption of fossil fuels      About 74% of the primary energy supply today still comes from
Decentralised energy systems, where power and heat are               fossil fuels.
produced close to the point of final use, reduce grid loads and      The Energy [R]evolution scenario describes development
energy losses in distribution. Global investments in ‘climate        pathways to a sustainable energy supply, achieving the urgently
infrastructure’ such as smart interactive grids and transmission     needed CO2 reduction target and a fossil fuel phase-out. The
grids to transport large quantities of offshore wind and             results of the Energy [R]evolution scenario which will be
concentrated solar power are essential. Building up clusters of      achieved through the following measures:
renewable micro grids, especially for people living in remote

10                                                                   reference
                                                                     1   IPCC – SPECIAL REPORT RENEWABLES, CHAPTER 1, MAY 2011.
image TEST WINDMILL N90 2500, BUILT BY THE
© PAUL LANGROCK/ZENIT/GP
GERMAN COMPANY NORDEX, IN THE HARBOUR OF
ROSTOCK. THIS WINDMILL PRODUCES 2.5 MEGA WATT
AND IS TESTED UNDER OFFSHORE CONDITIONS. TWO
TECHNICIANS WORKING INSIDE THE TURBINE.
• Curbing energy demand: The New Zealand energy demand is • The future electricity bill: Under the Reference scenario, the
projected by combining population development, GDP growth unchecked growth in demand, an increase in fossil fuel prices
and energy intensity. Under the Reference scenario, total and the cost of CO2 emissions result in total electricity supply
primary energy demand in New Zealand increases by 17% costs rising from today’s NZ$ 5.5 billion per year to NZ$ 6.9
from the current 737 PJ/a to 860 PJ/a in 2050. The energy billion in 2050. The Energy [R]evolution scenario not only
demand in 2050 in the Energy [R]evolution scenario increases complies with New Zealand´s CO2 reduction targets but also
only by 0.4% compared to current consumption and it is helps to stabilise energy costs. Increasing energy efficiency and
expected by 2050 to reach 740 PJ/a. shifting energy supply to renewables lead to long term costs for
electricity supply that are still 1% lower than in the Reference
• Controlling power demand: Under the Energy [R]evolution
scenario, although costs for efficiency measures of up to
scenario, electricity demand in the industry as well as in the
NZ$ 5 ct/kWh are taken into account.
residential and service sectors is expected to decrease after 2015.
Because of the growing shares of electric vehicles, heat pumps • Future investment in power generation: It would require about
and hydrogen generation, however, electricity demand increases to NZ$ 62 billion in investment for the Energy [R]evolution
54 TWh/a in 2050, still 2% below the Reference case. scenario to become reality (including investments for
replacement after the economic lifetime of the plants) -
• Reducing heating demand: Efficiency gains in the heat supply
approximately NZ$ 9 billion or NZ$ 0.23 billion annually more
sector are larger than in the electricity sector. Under the Energy
than in the Reference scenario (NZ$ 53 billion). Under the
[R]evolution scenario, final demand for heat supply can even be
Reference scenario, the levels of investment in conventional
reduced significantly. Compared to the Reference scenario,
power plants add up to almost 8% while around 92% would
consumption equivalent to 50 PJ/a is avoided through efficiency
be invested in renewable energy and cogeneration (CHP) until
measures by 2050. As a result of energy-related renovation of
2050. Under the Energy [R]evolution scenario, however, New
the existing stock of residential buildings, as well as the
Zealand would shift almost 100% of its entire energy
introduction of low energy standards and ‘passive houses’ for new
investment towards renewables and cogeneration. The average
buildings, enjoyment of the same comfort and energy services
annual investment in the power sector under the Energy
will be accompanied by a lower future energy demand.
[R]evolution scenario between today and 2050 would be
• Electricity generation: The development of the electricity approximately NZ$ 1.55 billion.
supply market is characterised by a dynamically growing
• Fuel costs savings: Because renewable energy has no fuel costs,
renewable energy market. By 2025, 100% of the electricity
however, the fuel cost savings in the Energy [R]evolution
produced in New Zealand will come from renewable energy
scenario reach a total of NZ$ 35 billion up to 2050, or
sources. ‘New’ renewables – wind, geothermal, PV and ocean
NZ$ 0.88 billion per year. The total fuel cost savings based on
energy – will contribute 52% of electricity generation. The
the assumed energy price path therefore would cover 300% of
Energy [R]evolution scenario projects an immediate market
the total additional investments compared to the Reference
development with high annual growth rates achieving a
scenario. These renewable energy sources would then go on to
renewable electricity share of 94% already by 2020. The
produce electricity without any further fuel costs beyond 2050,
installed capacity of renewables will reach 13 GW in 2030 and
while the costs for coal and gas will continue to be a burden on
17 GW by 2050.
the economy.
• Future costs of electricity generation: The introduction of
• Heating supply: The lack of district heating networks is a
renewable technologies under the Energy [R]evolution scenario
severe structural barrier to the large scale utilisation of
does not increase the costs of electricity generation in New
geothermal and solar thermal energy. In the Energy
Zealand compared to the Reference scenario. Because of the
[R]evolution scenario, renewables provide 67% of New
lower CO2 intensity of electricity generation, electricity
Zealand’s total heat demand in 2030 and 94% in 2050.
generation costs will become economically favourable under the
Energy efficiency measures can decrease the current total
Energy [R]evolution scenario and by 2050 costs will be
demand for heat supply by at least 10%, in spite of growing
NZ$ 1.9 cents/kWh below those in the Reference version.
population and economic activities and improving living
standards. For direct heating, solar collectors, biomass/biogas
as well as geothermal energy are increasingly substituting for
fossil fuel-fired systems. The introduction of strict efficiency
measures e.g. via strict building standards and ambitious
support programs for renewable heating systems are needed to
achieve economies of scale within the next 5 to 10 years.
11ENERGY [R]EVOLUTION
A SUSTAINABLE NEW ZEALAND ENERGY OUTLOOK
• Future investments in the heat sector: The heat sector in the • Primary energy consumption: Under the Energy [R]evolution
Energy [R]evolution scenario would require a major revision of scenario the overall primary energy demand will be reduced by
current investment strategies in heating technologies. Especially 14% in 2050. Most of the remaining demand will be covered
the solar, geothermal and heat pump technologies need by renewable energy sources. The Energy [R]evolution scenario
enormous increase in installations, if these potentials are to be leads to an overall renewable primary energy share of 72% in
tapped for the heat sector. Installed capacity need to be 2030 and 92% in 2050.
increased by the factor of 50 for solar thermal and by the • Development of CO2 emissions: While CO2 emissions in New
factor of 10 for geothermal and heat pumps. Capacity of Zealand will decrease by 16% in the Reference scenario, under
biomass technologies, which are already rather wide spread the Energy [R]evolution scenario they will decrease from
still need to remain a pillar of heat supply. Renewable heating around 30 million tonnes in 2009 to 2 million tonnes in 2050.
technologies are extremely variable, from low tech biomass Annual per capita emissions will drop from 6.8 tonnes to
stoves and unglazed solar collectors to very sophisticated 2.3 tonnes in 2030 and 0.3 tonne in 2050. In the long run
geothermal systems and solar thermal district heating plants. efficiency gains and the increased use of renewable electricity
Thus it can only roughly be calculated that the Energy and biofuels in vehicles will reduce emissions in the transport
[R]evolution scenario in total requires around NZ$ 42 billion sector. The transport sector remains as the largest source of
to be invested in renewable heating technologies until 2050 emissions. By 2050, New Zealand’s CO2 emissions are 8% of
(including investments for replacement after the economic 1990 levels.
lifetime of the plants) - approximately NZ$ 1 billion per year.
Due to a lack of information on costs for conventional heating
systems and fuel prices, total investments and fuel cost savings policy changes
for the heat supply in the scenarios have not been estimated. To make the Energy [R]evolution real and to avoid dangerous
• Future employment in the energy sector: The Energy climate change, Greenpeace and GWEC demand that
[R]evolution scenario results in more energy sector jobs in New the following policies and actions are implemented in the
Zealand at every stage of the projection. There are about 8,400 energy sector:
energy sector jobs in the Energy [R]evolution in 2015, and just 1. Phase out all subsidies for fossil fuels.
over 7,000 in the Reference scenario. By 2020, there are nearly
8,600 jobs In the Energy [R]evolution scenario, about 2,700 2. Internalise the external (social and environmental) costs of
more than in the Reference case. By 2030, strong growth in the energy production through ‘cap and trade’ emissions trading.
[R]evolution scenario boosts employment figures up to about 3. Mandate strict efficiency standards for all energy consuming
11,000 persons, significantly greater than the 6,100 jobs appliances, buildings and vehicles.
estimated for the Reference scenario at that same time.
4. Establish legally binding targets for renewable energy and
• Transport: In the transport sector, it is assumed under the Energy combined heat and power generation.
[R]evolution scenario that an energy demand reduction of about
87 PJ/a can be achieved by 2050, saving 42% compared to the 5. Reform the electricity markets by guaranteeing priority
Reference scenario. Energy demand will therefore decrease access to the grid for renewable power generators.
between 2009 and 2050 by 39% to 118 PJ/a. This reduction 6. Provide defined and stable returns for investors, for example
can be achieved by the introduction of highly efficient vehicles, by by feed-in tariff programmes.
shifting the transport of goods from road to rail and by changes
7. Implement better labelling and disclosure mechanisms to
in mobility-related behaviour patterns. Implementing a mix of
provide more environmental product information.
increased public transport as attractive alternatives to individual
cars, the car stock is growing slower and annual person 8. Increase research and development budgets for renewable
kilometres are lower than in the Reference scenario. A shift energy and energy efficiency.
towards smaller cars triggered by economic incentives together
with a significant shift in propulsion technology towards
electrified power trains and the reduction of vehicle kilometres
travelled lead to significant energy savings. In 2030, electricity
will provide 8% of the transport sector’s total energy demand in
the Energy [R]evolution, while in 2050 the share will be 33%.
Sustainable biofuels are expected to play an important role in
the future road transport sector, achieving a final energy share of
53% in 2050.
121
climate and energy policy
THE UNFCCC AND THE THE NEW ZEALAND GOVERNMENT’S RENEWABLE ENERGY TARGETS POLICY CHANGES IN THE
KYOTO PROTOCOL ENERGY STRATEGY ENERGY SECTOR
INTERNATIONAL ENERGY POLICY
1
“
bridging
the gap”
© NASA/JEFF SCHMALTZ
image HURRICANE BUD FORMING OVER THE EASTERN PACIFIC OCEAN, MAY 2012.
13ENERGY [R]EVOLUTION
A SUSTAINABLE NEW ZEALAND ENERGY OUTLOOK
1
climate & energy policy |
If we do not take urgent and immediate action to protect the This means that the new agreement in 2015, with the Fifth
climate, the threats from climate change could become irreversible. Assessment Report of the IPCC on its heels, should strive for
climate action for 2020 that ensures that the world stay as far
The goal of climate policy should be to keep the global mean
below an average temperature increase of 2°C as possible. Such
temperature rise to less than 2°C above pre-industrial levels. We
an agreement will need to ensure:
have very little time within which we can change our energy
system to meet these targets. This means that global emissions • That industrialised countries reduce their emissions on average
THE UNFCC AND THE KYOTO PROTOCOL & INTERNATIONAL ENERGY POLICY
will have to peak and start to decline by the end of the next by at least 40% by 2020 compared to their 1990 level.
decade at the latest.
• That industrialised countries provide funding of at least $140
The only way forwards is a rapid reduction in the emission of billion a year to developing countries under the newly established
greenhouse gases into the atmosphere. Green Climate Fund to enable them to adapt to climate change,
protect their forests and be part of the energy revolution.
1.1 the UNFCCC and the kyoto protocol • That developing countries reduce their greenhouse gas emissions
by 15 to 30% compared to their projected growth by 2020.
Recognising the global threats of climate change, the signatories
to the 1992 UN Framework Convention on Climate Change
(UNFCCC) agreed the Kyoto Protocol in 1997. The Protocol 1.2 international energy policy
entered into force in early 2005 and its 193 members meet
At present there is a distortion in many energy markets, where
continuously to negotiate further refinement and development of
renewable energy generators have to compete with old nuclear
the agreement. Only one major industrialised nation, the United
and fossil fuel power stations but not on a level playing field. This
States, has not ratified the protocol. In 2011, Canada announced
is because consumers and taxpayers have already paid the
its intention to withdraw from the protocol.
interest and depreciation on the original investments so the
generators are running at a marginal cost. Political action is
box 1.1: what does the kyoto protocol do? needed to overcome market distortions so renewable energy
technologies can compete on their own merits.
The Kyoto Protocol commits 193 countries (signatories) to
reduce their greenhouse gas emissions by 5.2% from their While governments around the world are liberalising their
1990 level. The global target period to achieve cuts was electricity markets, the increasing competitiveness of renewable
2008-2012. Under the protocol, many countries and energy should lead to higher demand. Without political support,
regions have adopted regional and national reduction however, renewable energy remains at a disadvantage,
targets. The European Union commitment is for overall marginalised because there has been decades of massive
reduction of 8%, for example. In order to help reach this financial, political and structural support to conventional
target, the EU also created a target to increase its technologies. Developing renewables will therefore require strong
proportion of renewable energy from 6% to 12% by 2010. political and economic efforts for example, through laws that
guarantee stable tariffs over a period of up to 20 years.
Renewable energy will also contribute to sustainable economic
growth, high quality jobs, technology development, global
In Copenhagen in 2009, the 195 members of the UNFCCC were
competitiveness and industrial and research leadership.
supposed to deliver a new climate change agreement towards
ambitious and fair emission reductions. Unfortunately the
ambition to reach such an agreement failed at this conference.
At the 2012 Conference of the Parties in Durban, there was
agreement to reach a new agreement by 2015. There is also
agreement to adopt a second commitment period at the end of
2012. However, the United Nations Environment Program’s
examination of the climate action pledges for 2020 shows that
there is still a major gap between what the science demands to
curb climate change and what the countries plan to do. The
proposed mitigation pledges put forward by governments are
likely to allow global warming to at least 2.5 to 5 degrees
temperature increase above pre-industrial levels.2
reference
2 UNEP EMISSIONS GAP REPORT.
14image PART-MADE WIND TURBINES FOR AN
OFFSHORE WIND FARM AT MIDDELGRUNDEN,
© LANGROCK/ZENIT/GP
CLOSE TO COPENHAGEN, DENMARK
1
climate & energy policy |
1.3 the new zealand government’s energy strategy 1.3.1 policies
The key aspects of the New Zealand Government’s Energy “The Government wants New Zealand to be a highly attractive
Strategy were published in August 2011 and are broken down global destination for petroleum exploration and production
into four priority areas as follows: investment so we can develop the full potential of our petroleum
resources. Significant discoveries of oil and gas resources will help
Priority: Develop resources
boost New Zealand’s foreign earnings and domestic gas supplies.”
THE NEW ZEALAND GOVERNMENT’S ENERGY STRATEGY
Areas of focus:
In practice;
1. Develop petroleum and mineral fuel resources.
• This is the main priority within the Energy Strategy and is the
2. Develop renewable energy resources. area of policy that the Government has spent the most time
and money on achieving. The Government has pinned its hopes
3. Embrace new energy technologies.
for economic recovery on revenues from oil and gas extraction,
along with coal mining. To that end, it has created an industry-
Priority: Secure and affordable energy friendly policy and operational environment, offering
Areas of focus: inducements and tax breaks designed to lure international oil
companies to New Zealand.
1. Competitive energy markets deliver value for money.
• The New Zealand Petroleum and Minerals department was
2. Oil security and transport. formed on 2 May 2011 from the old Crown Minerals Business
3. Reliable electricity supply. Unit of the Ministry of Economic Development. In the 2011
fiscal year the department has increased its full time equivalent
staff numbers by 35%3, while most other Ministries are
Priority: Efficient use of energy required to cut staff and reduce expenditure.
Areas of focus: • Since 2004, the Government has also been acquiring and making
1. Better consumer information to inform energy choices. available scientific data about New Zealand’s oil reserves to oil
companies for free, including a recent $ 25 million programme4
2. Enhance business competitiveness through energy efficiency. paid for by taxpayers to complete seismic surveys over new
3. An energy efficient transport system. frontier basins and to rework old seismic data.
4. Warm, dry, energy efficient homes. • The Government has extended until the end of 2014 an
exemption from tax on the profits of non-resident operators of
offshore rigs and seismic vessels.5
Priority: Environmental responsibility
• The Government has also prioritised creating a pathway to
Areas of focus:
develop potential offshore gas hydrates, despite major climate
1. Best practice in environmental management for energy change concerns over this potential fuel.
projects.
“The Government retains the target that 90 percent of electricity
2. Reduce energy-related greenhouse gas emissions. generation be from renewable sources by 2025 (in an average
hydrological year) providing this does not affect security of supply.”
In practice;
Fundamentally the New Zealand Government’s strategic
approach to economic and energy policy is based on a neo-liberal • The Government has kept this inherited target, although it has
doctrine. Therefore in principal the Government does not not put in place any specific market policy measures to enable
intervene in the regulation of markets and is continuing with the this target to be met.
privatization of State Owned Enterprises (SOE), especially in the
• In fact the weakening of Emissions Trading Scheme (ETS) and
energy sector, and continues to lower trade barriers across the
thereby reducing the price of carbon in New Zealand has
economy. In practice, however the Government has been more
impacted on further renewable energy development.
selective across the various parts of the energy sector about its
level of prioritization and level of involvement. • The Government’s latest modeling forecast of electricity supply is
projecting less than 80% renewable energy by 2025 with both
Within the four priority areas, key policies identified by the
coal and gas still supplying 20% of electricity demand by 2025.6
Government are outlined that it asserts are delivering changes to
the energy sector. However, the impacts of these policies have references
been detrimental to the development of renewable energy and 3 HTTP://WWW.MED.GOVT.NZ/ABOUT-US/PUBLICATIONS/CORPORATE-PUBLICATIONS/ANNUAL-REPORT-
CURRENT/ANNUAL-REPORT-2012.PDF
energy efficiency. 4 SEE P2 AND P8 HTTP://WWW.NZPAM.GOVT.NZ/CMS/PDF-LIBRARY/ABOUT/ANNUAL%20REPORT%20
WEB%20VERSION.PDF
5 HTTP://WWW.IRD.GOVT.NZ/TECHNICAL-TAX/LEGISLATION/2010/2010-109/2010-109-FIVE-YEAR-
EXTENSION
6 HTTP://WWW.MED.GOVT.NZ/SECTORS-INDUSTRIES/ENERGY/ENERGY-MODELLING/MODELLING/NEW-
ZEALANDS-ENERGY-OUTLOOK.
15ENERGY [R]EVOLUTION
A SUSTAINABLE NEW ZEALAND ENERGY OUTLOOK
1
climate & energy policy |
“The electricity market governance changes and Resource “The Government has injected new funds into upgrading
Management Act reforms have adjusted the regulatory transport infrastructure to create an efficient mix of integrated
framework to facilitate appropriate investment.”7 modes and travel options.”12
In practice; In practice;
• The five State Owned Enterprises (SOE) in energy have had • The Government has a mixed record of simultaneously
their assets shuffled ostensibly to make them more competitive weakening some and strengthening other vehicle emission
THE NEW ZEALAND GOVERNMENT’S ENERGY STRATEGY
but practically to prepare them for privatisation. standards for new and used import vehicles. The Government
halted the introduction of a vehicle fuel economy standard that
• The market operator rules were changed to allow energy
would have significantly lowered the gm/km of CO2 of our very
companies to legally maximise returns from the market whenever
old, dirty fleet.13
there is a grid constraint. This is central step to prepare the
sector for privatization which has resulted in higher prices and • The Government repealed a very modest biofuel sales
examples of ‘price gouging’ by energy companies. obligation14, which has impacted on the emerging New Zealand
biofuels sector. Consumption of biodiesel and bio-ethanol in New
“The New Zealand Emissions Trading Scheme (ETS) provides a
Zealand in 2011 was still 0.3% of diesel and 1.2% of petrol
price incentive for reducing carbon emissions.”8
consumption. Therefore instead of achieving the original target of
In practice; 2.5%, consumption is only at 1.2% biofuels.15
• The Government ‘reformed’ the ETS in a way that forces the • The Government maintains an 8:1 ratio of road to public
price of carbon to the lowest available global price, regardless transport funding16, and together with the roll-back of vehicle
of the quality of the carbon credit, by repealing restrictions on efficiency noted above, means that New Zealand is becoming
the type of units that could be surrendered under our even more dependent on oil.
obligation. Those restrictions were similar to the European
• The Government has simultaneously weakened and delayed the
Union’s restrictions. Now there are no restrictions.
introduction of Clean Air Standards.17
• The Government’s policy is to “Maintain the ETS settings to
“Making improvements in energy efficiency, energy
ensure businesses and households do not face additional costs”9
conservation and renewable energy is an important priority for
This defeats the price signal purpose of having an ETS, and has
the Government. As such, the New Zealand Energy Efficiency
therefore weakened the ETS to the extent that it is now merely
and Conservation Strategy (NZEECS) contributes to the
window dressing.
delivery of the Government’s energy priorities set out in the
• The Government repealed the ‘thermal ban’ clause of the ETS New Zealand Energy Strategy.”18
legislation10, which had originally severely restricted any new
In practice;
thermal electricity generation from being built.
• This statutory document in theory provides the strategy by
“The Resource Management Act 1991 (RMA) provides New
which the aspirations outlined in the Energy Strategy will be
Zealand with a resource management framework that gives due
achieved. It outlines a number of targets across a number of
consideration to the benefits and adverse effects of
sectors, which are identical in most respects to the targets put
developments. The Government’s aim is to ensure this
in place for the 2007 version of the strategy. The key difference
framework is administered effectively while minimising delays
is that there are no programmes or funding outlined to achieve
and costs for all parties.” 11
the targets as there were in 2007.
In practice;
• The Resource Management Act (RMA), which stipulates how
consents for development are given was weakened ‘to facilitate
appropriate investment’. Public consultation has been curbed
and the Minister has been granted powers to ‘call in’ key
projects.
• This means that developments of all kinds, including high carbon references
energy projects, can be fast tracked without due consideration of 7 NEW ZEALAND ENERGY STRATEGY 2011-2021, DEVELOPING OUR ENERGY POTENTIAL, MINISTRY OF
ECONOMIC DEVELOPMENT, AUGUST 2011.
environmental impacts. A number of tests have been replaced 8 IBID.
9 HTTP://WWW.MBIE.GOVT.NZ/WHAT-WE-DO/BUSINESS-GROWTH-AGENDA/PDF-FOLDER/BGA-NATURAL-
with purely economic ones. The Minister of Energy now has RESOURCES-REPORT-DECEMBER-2012.PDF (PAGE 29).
10 HTTP://WWW.BEEHIVE.GOVT.NZ/RELEASE/THERMAL-BAN-REPEAL
authority to directly input into consents on Conservation Land 11 IBID 7.
based on economic criteria. 12 IBID 7.
13 HTTP://WWW.SCOOP.CO.NZ/STORIES/PA0908/S00433.HTM.
14 HTTP://WWW.BEEHIVE.GOVT.NZ/RELEASE/BIOFUEL-OBLIGATION-LAW-REPEALED
15 HTTP://WWW.MED.GOVT.NZ/SECTORS-INDUSTRIES/ENERGY/ENERGY-MODELLING/PUBLICATIONS/ENERGY-
DATA-FILE
16 HTTP://WWW.TRANSPORT.GOVT.NZ/OURWORK/KEYSTRATEGIESANDPLANS/DOCUMENTS/GPS%202012%
20FOR%20PUBLICATION%20-%20OCT%20REVISION_1.1_V2.PDF
17 HTTP://WWW.MFE.GOVT.NZ/LAWS/STANDARDS/AIR-QUALITY/REVIEW/INDEX.HTML
18 IBID 7.
16image PART-MADE WIND TURBINES FOR AN
OFFSHORE WIND FARM AT MIDDELGRUNDEN,
© LANGROCK/ZENIT/GP
CLOSE TO COPENHAGEN, DENMARK
1
climate & energy policy |
• Almost the entire energy efficiency programme of the previous 1.5 policy changes in the energy sector
Government’s energy strategy has been halted or turned into
Greenpeace and the renewable energy industry share a clear
‘information only campaigns’. The only efficiency programme to
agenda for the policy changes which need to be made to
survive intact is the Home Insulation Scheme which was too
encourage a shift to renewable sources. The main demands are:
popular with voters to cut despite the new government’s promise
to do so during the election. The Government has committed 1. Phase out all subsidies for fossil fuels and nuclear energy.
$340 million over four years to the programme with the aim of
RENEWABLE ENERGY TARGETS & POLICY CHANGES IN THE ENERGY SECTOR
2. Internalise the external (social and environmental) costs of
improving at least 188,500 homes.19 However, the Government energy production through ‘cap and trade’ emissions trading.
shelved the high efficiency light bulb and shower head schemes.20
3. Mandate strict efficiency standards for all energy consuming
appliances, buildings and vehicles.
1.4 renewable energy targets
4. Establish legally binding targets for renewable energy and
A growing number of countries have established targets for combined heat and power generation.
renewable energy in order to reduce greenhouse emissions and
increase energy security. Targets are usually expressed as 5. Reform the electricity markets by guaranteeing priority
installed capacity or as a percentage of energy consumption and access to the grid for renewable power generators.
they are important catalysts for increasing the share of 6. Provide defined and stable returns for investors, for example
renewable energy worldwide. by feed-in tariff programmes.
However, in the electricity sector the investment horizon can be 7. Implement better labelling and disclosure mechanisms to
up to 40 years. Renewable energy targets therefore need to have provide more environmental product information.
short, medium and long term steps and must be legally binding in
order to be effective. They should also be supported by incentive 8. Increase research and development budgets for renewable
mechanisms such as feed-in tariffs for renewable electricity energy and energy efficiency.
generation. To get significant increases in the proportion of Conventional energy sources globally receive an estimated
renewable energy, targets must be set in accordance with the $409 billion24 in subsidies in 2010, resulting in heavily distorted
local potential for each technology (wind, solar, biomass etc) and markets. Subsidies artificially reduce the price of power, keep
be complemented by policies that develop the skills and renewable energy out of the market place and prop up non-
manufacturing bases to deliver the agreed quantity. competitive technologies and fuels. Eliminating direct and
Data from the wind and solar power industries show that it is indirect subsidies to fossil fuels and nuclear power would help
possible to maintain a growth rate of 30 to 35% in the move us towards a level playing field across the energy sector.
renewable energy sector. In conjunction with the European Renewable energy would not need special provisions if markets
Photovoltaic Industry Association,21 the European Solar Thermal factored in the cost of climate damage from greenhouse gas
Power Industry Association22 and the Global Wind Energy pollution. Subsidies to polluting technologies are perverse in that
Council,23 the European Renewable Energy Council, Greenpeace they are economically as well as environmentally detrimental.
has documented the development of these clean energy industries Removing subsidies from conventional electricity supply would
in a series of Global Outlook documents from 1990 onwards and not only save taxpayers’ money, it would also dramatically reduce
predicted growth up to 2020 and 2040. the need for renewable energy support.
references
19 IBID 7.
20 HTTP://BEEHIVE.GOVT.NZ/RELEASE/LIGHT-BULB-BAN-ENDED
21 SOLARGENERATION IV’, SEPTEMBER 2009.
22 GLOBAL CONCENTRATED SOLAR POWER OUTLOOK – WHY RENEWABLES ARE HOT!’ MAY, 2009.
23 GLOBAL WIND ENERGY OUTLOOK 2008’, OCTOBER 2010.
24 IEA WORLD ENERGY OUTLOOK 2011’, PARIS NOVEMBER 2011, CHAPTER 14, PAGE 507.
17ENERGY [R]EVOLUTION
A SUSTAINABLE NEW ZEALAND ENERGY OUTLOOK
1
climate & energy policy |
1.5.1 the most effective way to implement the energy
[r]evolution: feed-in laws
To plan and invest in energy infrastructure whether for
conventional or renewable energy requires secure policy
frameworks over decades.
POLICY CHANGES IN THE ENERGY SECTOR
The key requirements for an effective feed-in law are:
To plan and invest in energy infrastructure whether for
conventional or renewable energy requires secure policy
frameworks over decades.
1. Long term security for the investment The investor needs to
know if the energy policy will remain stable over the entire
investment period (until the generator is paid off). Investors
want a “good” return on investment and while there is no
universal definition of a good return, it depends to a large extent
on the inflation rate of the country. Germany, for example, has
an average inflation rate of 2% per year and a minimum return
of investment expected by the financial sector is 6% to 7%.
Achieving 10 to 15% returns is seen as extremely good and
everything above 20% is seen as suspicious.
2. Long-term security for market conditions The investor
needs to know, if the electricity or heat from the power plant
can be sold to the market for a price which guarantees a
“good” return on investment (ROI). If the ROI is high, the
financial sector will invest, it is low compared to other
investments financial institutions will not invest.
3. Transparent Planning Process A transparent planning
process is key for project developers, so they can sell the
planned project to investors or utilities. The entire licensing
process must be clear and transparent.
4. Access to the grid A fair access to the grid is essential for
renewable power plants. If there is no grid connection
available or if the costs to access the grid are too high the
project will not be built. In order to operate a power plant it
is essential for investors to know if the asset can reliably
deliver and sell electricity to the grid. If a specific power
plant (e.g. a wind farm) does not have priority access to the
grid , the operator might have to switch the plant off when
there is an over supply from other power plants or due to a
bottleneck situation in the grid. This arrangement can add
high risk to the project financing and it may not be financed
or it will attract a “risk-premium” which will lower the ROI.
18the energy [r]evolution concept
2
KEY PRINCIPLES THE “3 STEP IMPLEMENTATION” THE NEW ELECTRICITY GRID CASE STUDY GERMANY
2
“ smart use,
generation
and distribution
are at the core
of the concept”
© NASA / JESSE ALLEN
image MOUNT RUAPEHU ON THE NORTH ISLAND OF NEW ZEALAND AND ITS SUMMIT LAKE.
19ENERGY [R]EVOLUTION
A SUSTAINABLE NEW ZEALAND ENERGY OUTLOOK
2
The expert consensus is that a fundamental shift in the way we The effects of climate change on the poorest communities
the energy [r]evolution concept |
consume and generate energy must begin immediately and be well are exacerbated by massive global energy inequality. If we
underway within the next ten years in order to avert the worst are to address climate change, one of the principles must be
impacts of climate change.25 The scale of the challenge requires a equity and fairness, so that the benefits of energy services –
complete transformation of the way we produce, consume and such as light, heat, power and transport – are available for
distribute energy, while maintaining economic growth. Nothing all: north and south, rich and poor. Only in this way can we
short of such a revolution will enable us to limit global warming create true energy security, as well as the conditions for
to a rise in temperature of lower than 2°C, above which the genuine human wellbeing.
impacts become devastating. This chapter explains the basic
The global Energy [R]evolution scenario has a target to
principles and strategic approach of the Energy [R]evolution
achieve energy equity as soon as technically possible. By
concept, which have formed the basis for the scenario modelling
2050 the average per capita emission should be between 0.5
since the very first Energy [R]evolution scenario published in
and 1 tonne of CO2.
KEY PRINCIPLES
2005. However, this concept has been constantly improved as
technologies develop and new technical and economical 3. Implement clean, renewable solutions and decentralise energy
possibilities emerge. systems There is no energy shortage. All we need to do is use
existing technologies to harness energy effectively and
Current electricity generation relies mainly on burning fossil fuels
efficiently. Renewable energy and energy efficiency measures
in very large power stations which generate carbon dioxide and
are ready, viable and increasingly competitive. Wind, solar
also waste much of their primary input energy. More energy is
and other renewable energy technologies have experienced
lost as the power is moved around the electricity network and is
double digit market growth for the past decade.26
converted from high transmission voltage down to a supply
suitable for domestic or commercial consumers. The system is Just as climate change is real, so is the renewable energy sector.
vulnerable to disruption: localised technical, weather-related or Sustainable, decentralised energy systems produce fewer carbon
even deliberately caused faults can quickly cascade, resulting in emissions, are cheaper and are less dependent on imported fuel.
widespread blackouts. Whichever technology generates the They create more jobs and empower local communities.
electricity within this old fashioned configuration, it will inevitably Decentralised systems are more secure and more efficient. This
be subject to some, or all, of these problems. At the core of the is what the Energy [R]evolution must aim to create.
Energy [R]evolution therefore there are changes both to the way
that energy is produced and distributed. “THE STONE AGE DID NOT END FOR LACK OF STONE, AND THE OIL
AGE WILL END LONG BEFORE THE WORLD RUNS OUT OF OIL.”
2.1 key principles Sheikh Zaki Yamani, former Saudi Arabian oil minister
The Energy [R]evolution can be achieved by adhering
to five key principles: To stop the earth’s climate spinning out of control, most of
1. Respect natural limits – phase out fossil fuels by the end of this the world’s fossil fuel reserves – coal, oil and gas – must
century We must learn to respect natural limits. There is only so remain in the ground. Our goal is for humans to live within
much carbon that the atmosphere can absorb. Each year we emit the natural limits of our small planet.
almost 30 billion tonnes of carbon equivalent; we are literally 4. Decouple growth from fossil fuel use Starting in the developed
filling up the sky. Geological resources of coal could provide countries, economic growth must be fully decoupled from
several hundred years of fuel, but we cannot burn them and keep fossil fuel usage. It is a fallacy to suggest that economic
within safe limits. Oil and coal development must be ended. growth must be predicated on their increased combustion.
The global Energy [R]evolution scenario has a target to We need to use the energy we produce much more efficiently,
reduce energy related CO2 emissions to a maximum of and we need to make the transition to renewable energy and
3.5 Gigatonnes (Gt) by 2050 and phase out over 80% of away from fossil fuels quickly in order to enable clean and
fossil fuels by 2050. sustainable growth.
2. Equity and fair access to energy As long as there are natural 5. Phase out dirty, unsustainable energy We need to phase out
limits there needs to be a fair distribution of benefits and costs coal and nuclear power. We cannot continue to build coal
within societies, between nations and between present and future plants at a time when emissions pose a real and present
generations. At one extreme, a third of the world’s population danger to both ecosystems and people. And we cannot continue
has no access to electricity, whilst the most industrialised to fuel the myriad nuclear threats by pretending nuclear power
countries consume much more than their fair share. can in any way help to combat climate change. There is no role
for nuclear power in the Energy [R]evolution.
references
25 IPCC – SPECIAL REPORT RENEWABLES, CHAPTER 1, MAY 2011.
26 REN 21, RENEWABLE ENERGY STATUS REPORT 2012, JUNE 2012.
20You can also read