REMAP 2030 RENEWABLE ENERGY PROSPECTS FOR THE RUSSIAN FEDERATION - WORKING PAPER - Irena
←
→
Page content transcription
If your browser does not render page correctly, please read the page content below
REMAP 2030
RENEWABLE ENERGY
PROSPECTS FOR
THE RUSSIAN FEDERATION

                         APRIL 2017
                   WORKING PAPER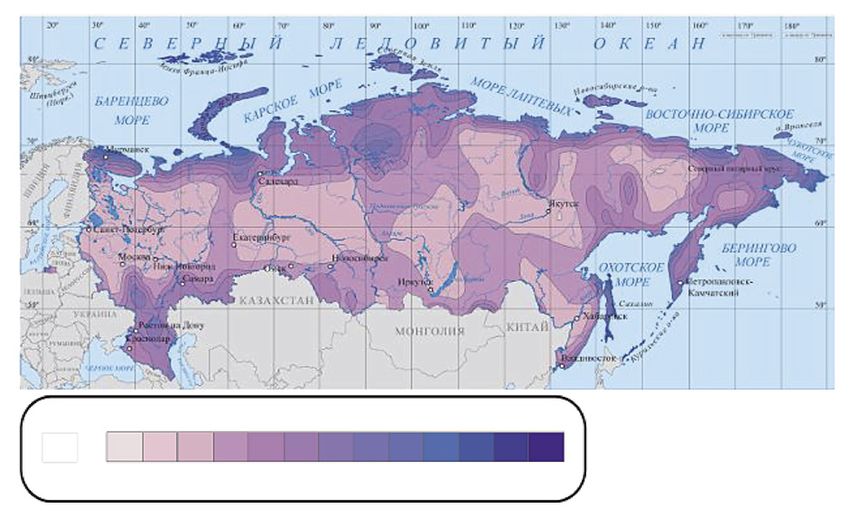
Copyright © IRENA 2017
Unless otherwise stated, material in this publication may be freely used, shared, copied, reproduced, printed and/or stored, provided that
appropriate acknowledgement is given of IRENA as the source and copyright holder. Material in this publication that is attributed to third parties
may be subject to separate terms of use and restrictions, and appropriate permissions from these third parties may need to be secured before
any use of such material.

ISBN 978-92-9260-021-1 (Print)
ISBN 978-92-9260-022-8 (PDF)

About IRENA
The International Renewable Energy Agency (IRENA) is an intergovernmental organisation that supports countries
in their transition to a sustainable energy future and serves as the principal platform for international co-operation, a
centre of excellence, and a repository of policy, technology, resource and financial knowledge on renewable energy.
IRENA promotes the widespread adoption and sustainable use of all forms of renewable energy, including bioenergy,
geothermal, hydropower, ocean, solar and wind energy, in the pursuit of sustainable development, energy access,
energy security and low-carbon economic growth and prosperity.
This report and other supporting material are available for download through www.irena.org/remap

Acknowledgements
This publication has benefited from valuable comments and guidance provided by the Ministry of Energy of the
Russian Federation (Alexey Texler, Natalia Nozdrina, Artem Nedaikhlib and Yulia Gorlova). It was reviewed at three
meetings that took place in Moscow, on 26 October 2015, 27 April 2016 and 12 October 2017, and benefited from
the input of the REmap Russia working group. Additional review was provided by Igor Bashmakov and Alexei Lunin
(Centre for Energy Effi ciency), Anatole Boute (The Chinese University of Hong Kong), Georgy Ermolenko (Higher
School of Economics), Stefan Gsänger and Roman Denisov (World Wind Energy Association), Ilya Kramarenko and
Grigory Yulkin (International Sustainable Energy Development Centre under the auspices of UNESCO), Oleg Popel
(Joint Institute for High Temperatures of the Russian Academy of Sciences), Patrick Willems (Renewable Energy
Development Association), Alexey Zhikharev (Vygon Consulting, Renewable Energy Development Association) and
Ellen von Zitzewitz (Embassy of the Federal Republic of Germany in Moscow). Draft results were presented during
the International Renewable Energy Congress – XXI: Energy & Economic Effi ciency, 27-28 October, 2015; the 4th
International Forum on Energy Efficiency and Energy Saving, 19-21 November, 2015; the International Exhibition-
Forum “EcoTech”, 26-29 April, 2016; Renewable Energy Development in the Russian Far East, 9-11 June, 2016; and
the International Renewable Energy Congress – XXI: Energy & Economic Efficiency, 13-14 October, 2016. IRENA
colleagues Rabia Ferroukhi, Sakari Oksanen, Alvaro Lopez-Pena, Roland Roesch, Marcin Scigan and Salvatore Vinci
have also provided valuable feedback. Finally, a special thanks is due to Vladimir Berdin, who worked on the report
as a consultant and provided invaluable input and support throughout the project.
Authors: Dolf Gielen and Deger Saygin (IRENA).

Report citation: IRENA (2017), REmap 2030 Renewable Energy Prospects for Russian Federation, Working paper,
IRENA, Abu Dhabi. www.irena.org/remap

For further information or to provide feedback, please contact the REmap team at remap@irena.org

Disclaimer
All information and data used in the preparation of this working paper was provided by the Ministry of Energy of the Russian Federation and should
not be taken as reflecting the views of IRENA or its Members� During the analysis, reasonable precautions have been taken by IRENA to verify the
technical reliability of the renewable energy material� However, the inclusion of such material, and the use and presentation of all information, statistics
and data as well as all designations employed herein do not imply the expression of any opinion or position on the part of, or endorsement by, IRENA or
its Members concerning the legal status of any region, country, territory, city or area, or of its authorities, or concerning the delimitation of frontiers or
boundaries� Neither IRENA nor any of its officials, agents, data or other third-party content providers provides a warranty of any kind, either expressed
or implied, and they accept no responsibility or liability for any consequence of use of the publication or material herein� The mention of specific
projects, companies, commercial enterprises or products does not imply that they are endorsed or recommended by IRENA in preference to any others
that are not mentioned�
CONTENTS
FIGURES�����������������������������������������������������������������������������������������������������������������������������������������������������������������������������������������������II
TABLES����������������������������������������������������������������������������������������������������������������������������������������������������������������������������������������������� III
ABBREVIATIONS����������������������������������������������������������������������������������������������������������������������������������������������������������������������������IV
KEY FINDINGS������������������������������������������������������������������������������������������������������������������������������������������������������������������������������������1
КЛЮЧЕВЫЕ ВЫВОДЫ��������������������������������������������������������������������������������������������������������������������������������������������������������������3

1.	 INTRODUCTION TO IRENA’S REMAP WORK AND BRIEF METHODOLOGY��������������������������������������������������� 6
     1.1       IRENA’s REmap programme�������������������������������������������������������������������������������������������������������������������������������������� 6
     1.2       The REmap approach���������������������������������������������������������������������������������������������������������������������������������������������������� 6
     1.3       Metrics for assessing REmap Options���������������������������������������������������������������������������������������������������������������������7
     1.4       Main sources of information and assumptions for REmap Russia�������������������������������������������������������������� 9

2	CURRENT RENEWABLE ENERGY SITUATION IN RUSSIA�������������������������������������������������������������������������������������� 11
     2.1       Current status of renewables������������������������������������������������������������������������������������������������������������������������������������� 11
     2.2       Drivers��������������������������������������������������������������������������������������������������������������������������������������������������������������������������������20
     2.3       Brief overview of the current energy policy framework������������������������������������������������������������������������������� 25
     2.4       Renewables potential by resource and by region�������������������������������������������������������������������������������������������� 32

3	BRIEF OVERVIEW OF ENERGY SECTORS AND ENERGY MARKETS���������������������������������������������������������������36
     3.1       Power sector structure�����������������������������������������������������������������������������������������������������������������������������������������������36
     3.2       Energy consumption by sector and technology���������������������������������������������������������������������������������������������� 37
     3.3       Conventional energy reserves, production and trade������������������������������������������������������������������������������������45
     3.4       Energy prices and subsidies�������������������������������������������������������������������������������������������������������������������������������������48

4.	 WHERE WOULD THE REFERENCE CASE TAKE RENEWABLES BY 2030?���������������������������������������������������50

5.	 POTENTIAL OF RENEWABLE ENERGY TECHNOLOGY OPTIONS
    BEYOND THE REFERENCE CASE IN 2030������������������������������������������������������������������������������������������������������������������� 51
     5.1       Selection of REmap Options�������������������������������������������������������������������������������������������������������������������������������������� 51
     5.2       Renewable energy use: prospects to 2030��������������������������������������������������������������������������������������������������������54
     5.3       Renewable energy cost and benefits��������������������������������������������������������������������������������������������������������������������58
     5.4       Barriers to renewable energy uptake and suggested solutions�����������������������������������������������������������������62
REFERENCES����������������������������������������������������������������������������������������������������������������������������������������������������������������������������������69
ANNEX A: Energy price assumptions����������������������������������������������������������������������������������������������������������������������������������� 75
ANNEX B: Technology cost and performance of analysed technologies�������������������������������������������������������������� 76
ANNEX C: Resource potential������������������������������������������������������������������������������������������������������������������������������������������������� 79
ANNEX D: Key players in the Russian wind and solar PV power sectors��������������������������������������������������������������� 82
ANNEX E: REmap Summary Table�����������������������������������������������������������������������������������������������������������������������������������������83

                                                                                                                                                                              Wo rkin g Pa p er              i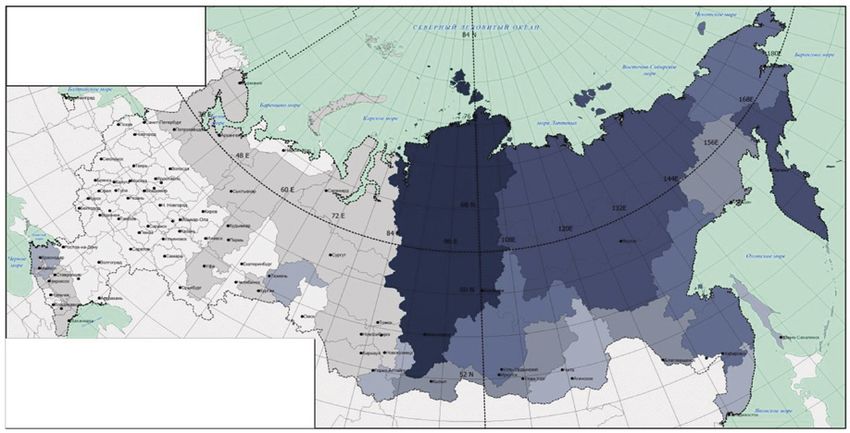
Figures
Figure 1: Wind energy projects in Russia........................................................................................................................ 12
Figure 2: Total installed renewable power capacity and generation by technology, 2015.......................... 13
Figure 3: Development of hydropower capacity in Russia, 2000-2015.............................................................. 15
Figure 4: Breakdown of bioenergy and waste use in the heating and
power generation sectors, 2014.......................................................................................................................16
Figure 5: Development of approved maximum overnight capital cost levels
for the wholesale and retail markets, 2014-2024.......................................................................................19
Figure 6: Expected capital expenditure of approved renewable energy projects in the Russian
wholesale electricity market based on data collected from project applicants,
2014-2019...................................................................................................................................................................19
Figure 7: Structure of waste as a biomass source for bioenergy for federal districts of Russia,
2012.............................................................................................................................................................................34
Figure 8: Breakdown of Russia’s total final energy consumption by sector and technology, 2014........38
Figure 9: Breakdown of Russia’s total final energy consumption by sector, 1995-2014...............................39
Figure 10: Breakdown of electricity generation by resource, 1995-2014.............................................................39
Figure 11: Breakdown of investments in Russia’s power system, 2010-2014......................................................41
Figure 12: Breakdown of energy use in the residential sector, 2008.....................................................................42
Figure 13: Average electricity prices by consumer groups in Russia, 2004 and 2010-2014........................48
Figure 14: Installed renewable energy capacity in Russia according to the Reference Case, 2030.........54
Figure 15: Renewable energy use in TFEC, 2010-2030 ............................................................................................. 55
Figure 16: Breakdown of primary bioenergy demand in Russia, 2030................................................................. 57
Figure 17: Comparison of bioenergy demand and supply, 2030............................................................................ 57
Figure 18: Renewable energy cost-supply curve by renewable energy resource in 2030
from the business perspective.........................................................................................................................59
Figure 19: Renewable energy cost-supply curve by renewable energy resource in 2030
from the government perspective.................................................................................................................59
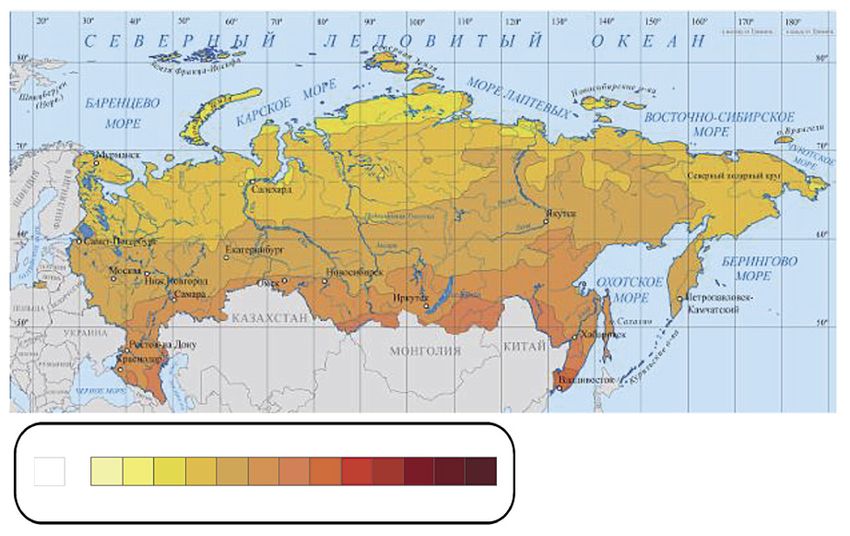
Figure 20: Total average daily solar radiation on the inclined surface of the southern orientation
with an inclination angle equal to the latitude of the area (year)...................................................... 79
Figure 21: The average wind speed at a height of 50 m............................................................................................80
Figure 22: Daily solar insolates rates in Russia................................................................................................................80
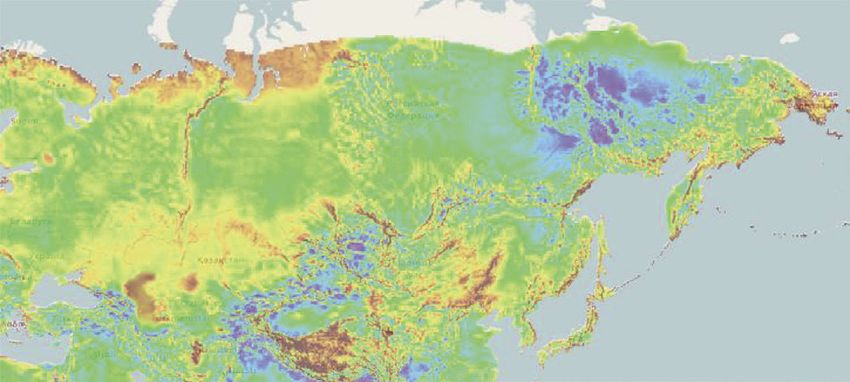
Figure 23: Global wind dataset 5km onshore wind at 80 m height........................................................................81
Figure 24: Regional technical potential of hydropower in small rivers...................................................................81
Figure 25: Solar power sector players of Russia (as of October 2016).................................................................. 82
Figure 26: Wind power sector players of Russia (as of October 2016)................................................................. 82
ii R Em a p 2030: Re newab l e e ne rgy pros pe c t s fo r t h e Russia n Fe d e ra t io n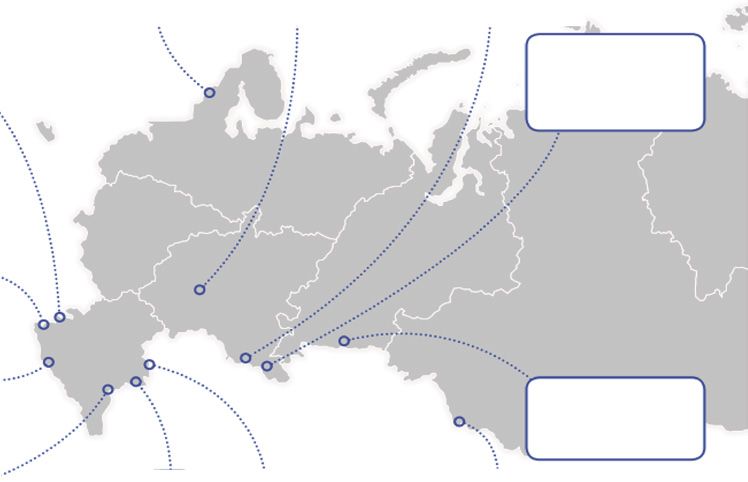
Tables
Table 1: Comparison of the estimated LCOE generation in Russia for renewable
         and non-renewable technologies, based on data from Russia, 2014�����������������������������������������������������18
Table 2: Population in zones with decentralised energy supply in Russia������������������������������������������������������������ 22
Table 3: Location of diesel generators in Russia by number of plants and generation����������������������������������� 23
Table 4: Overview of laws and other regulations related to renewables in Russia,
         in chronological order����������������������������������������������������������������������������������������������������������������������������������������������� 28
Table 5: Results of renewable energy auctions in 2013-2016�������������������������������������������������������������������������������������30
Table 6: Biomass feedstock supply potential in Russia in 2030������������������������������������������������������������������������������� 35
Table 7: Total final energy consumption in Russia according to the Reference Case, 2010-2030��������������50
Table 8: Renewable energy use in the base year, Reference Case and REmap, 2010-2030������������������������� 53
Table 9: Renewable energy share and total renewable energy use by sector, 2010-2030���������������������������56
Table 10: Average substitution costs of REmap Options by sector, 2030��������������������������������������������������������������58
Table 11: Substitution cost of REmap Options by technology in 2030 based
          on the perspectives of government and business and potential by technology����������������������������� 60
Table 12: Financial indicators for renewable energy use in Russia
          from the government perspective������������������������������������������������������������������������������������������������������������������������61
Table 13: Annual average investments needs in 2010-2030����������������������������������������������������������������������������������������62

                                                                                                                                                         Wo rkin g Pa p er           iii
Abbreviations
°C degrees Celsius LCOE levelised cost of energy
ATS Administrator of the Trading System m metres
bcm billion cubic meters m2 square metres
CCGT combined cycle gas turbine m3 cubic metres
CENEF Center for Energy Efficiency MMBtu million British thermal unit
CHP combined heat and power Mt megatonnes
CNG compressed natural gas Mtoe million tonnes of oil equivalent
CO2 carbon dioxide
MW megawatt
COP21 21st session of the Conference of the
MWh megawatt-hour
Parties to the UNFCCC
n.d. no date
eff. efficiency
OECD Organisation for Economic Co-operation
EJ exajoule
and Development
EU European Union
ORC organic rankine cycle
EUR euros
PJ petajoule
excl. excluding
PV photovoltaic
FAO Food and Agriculture Organization of
the United Nations R&D research and development
FiT feed-in tariff RE renewable energy
FSK federal grid company REmap Renewable energy roadmap analysis by
IRENA
Gcal gigacalories
Rosatom Rosatom State Atomic Energy
GDP gross domestic product
Corporation
GFEC gross final energy consumption
RUB Rubles
GHG greenhouse gas
SE4All Sustainable Energy for All
GJ gigajoule
TFEC total final energy consumption
Gt gegatonnes
TJ terajoule
GW gigawatt
toe tonnes of oil equivalent
GWh gigawatt-hour
TWh terawatt-hour
IEA International Energy Agency
UN United Nations
incl. including
INDC Intended Nationally Determined UNFCCC United Nations Framework Convention
Contribution on Climate Change
IPS Integrated Power System UPS Unified Power System
IRENA International Renewable Energy Agency USD United States dollar
km2 square kilometres USSR Union of Soviet Socialist Republics
kV kilovolts VRE variable renewable energy
kW kilowatt WWEA World Wind Energy Association
kWh kilowatt-hour yr year
iv R Em a p 2030: Re newab l e e ne rgy pros pe c t s fo r t h e Russia n Fe d e ra t io nKEY FINDINGS
● In 2010, renewable energy use in the Russian Federation (hereinafter also referred to as “Russia”)
was dominated by hydropower in the power generation sector, while bioenergy dominated heating
in industry and buildings (including district heat generation). In 2010, hydropower accounted for 70%
of the total final renewable energy use of 0.6 exajoules (EJ). Bioenergy accounted for most of the
remaining 30%. In the same year, renewable energy’s share in Russia’s total final energy consumption
(TFEC) was 3.6%.
● By the end of 2015, total installed renewable power generation capacity reached 53.5 gigawatts (GW),
representing about 20% of Russia’s total installed power generation capacity (253 GW). Hydropower
represents nearly all of this capacity, with 51.5 GW, followed by bioenergy, with 1.35 GW. Installed
capacity for solar photovoltaic (PV) and onshore wind amounted to 460 MW and 111 MW, respectively.
● Based on consultation with the Russian government and relevant stakeholders, this report identifies
four main drivers which Russia could consider to accelerate the uptake of renewables in its energy mix:
economic activity and job creation; science and technology development; energy supply to isolated
areas; and improving the quality of the environment.
● In the draft Energy Strategy of Russia for the period up to 2035 (“Energy Strategy to 2035”), Russia
has prepared a detailed projection of its energy use by sector and fuel. Based on the calculations
which take into account the latest draft of this strategy and other sources, the Reference Case takes
Russia’s renewable energy share in its TFEC to 4.9% by 2030. This includes Russia’s plan to expand its
total solar PV, onshore wind and geothermal capacity to 5.9 GW by the end of 2024.
● In the Reference Case, total final renewable energy use nearly doubles from 0.6 EJ in 2010 to 1.1 EJ
in 2030. This consumption would be equivalent to 5% of the country’s total energy demand in 2030.
Total final renewable energy use includes the consumption of power and district heat from renewable
energy sources, renewable transport fuels and renewable fuels for cooking as well as water, space
and process heating. The Reference Case renewable energy use continues to be dominated by
hydropower, which represents more than half of all final renewable energy use. Given the country’s
large biomass resource availability, biofuels gain a larger market share for heating and transport,
accounting for nearly half of all renewable energy use by 2030. Other renewable energy resources (i.e.
solar PV, wind, geothermal) contribute 4%.
● Under REmap – the case that considers the accelerated deployment of renewable energy in the
Russian energy mix – the share of total renewable energy increases to 11.3% of TFEC by 2030. REmap
assumes a mix of renewable energy technologies in both power and end-use sectors. In REmap, the
renewable energy share is estimated to be highest in the power generation sector, at about 30% in
2030. This is split into 20% hydropower and 10% wind, solar PV and geothermal renewable power. In
the heating sector, the share of renewable energy would be approximately 15%. Transport would see
the largest increase with renewable energy’s share reaching 8% by 2030, compared to 1% in 2010.
● Under REmap, onshore wind capacity attains 23 GW, solar PV rises to 5 GW and bioenergy reaches
26 GW by 2030. Total installed hydropower capacity reaches 94 GW by 2030. Total renewable
power generation grows nearly threefold between 2010 and 2030, from 169 terawatt-hours (TWh) to
487 TWh per year in the same period. This includes about 100 TWh of renewable power available for
export to Asian countries from 30 GW of installed hydropower and onshore wind capacity.
Wo rkin g Pa p er 1● Under REmap, total primary bioenergy demand amounts to 2.4 EJ per year by 2030. This compares
with the country’s total supply potential, which starts at more than 2 EJ (similar to the level of all
demand in 2030) and reaches 14 EJ, according to IRENA. This large range depends on the extent to
which forest-based biomass feedstock is available. The large availability of biomass feedstock relative
to demand is a favourable outcome, as it indicates the availability of additional resources that can be
used for exports. Ensuring the supply of energy crops and biogas feedstocks, however, will be critical,
as by 2030, demand for them under REmap reaches the limits of their supply.
● Under Remap, the average annual investment required to fulfil the renewable energy mix is estimated
at USD 15 billion per year between 2010 and 2030. Investments for renewable power generation
capacity account for nearly all of this, at USD 13 billion per year (excluding transmission and
distribution infrastructure). The remaining USD 2 billion per year is for renewable energy capacity in
end-use sectors.
● Implementing all REmap Options identified in this working paper would require an average
substitution cost by 2030 of USD 8.7/gigajoule (GJ) of final renewable energy. This is the additional
cost of all renewables to the Russian energy system that are identified under REmap. This cost is from
a business perspective that assumes an 11% discount rate, a crude oil price of USD 80 per barrel and a
wholesale natural gas price of USD 3.3 per million British thermal units (MMBtu). Gas is the main fuel
assumed to be replaced in the power and heat generation sectors. While solar PV and onshore wind
are economically viable in isolated regions, in 2030, they remain more expensive in the wholesale
market. This is due to the low natural gas price assumption. Decentralised heating in buildings and
for industrial processes is close to cost-competitiveness in 2030, provided that low-cost biomass
feedstocks are used for generation.
● When externalities related to human health and climate change are accounted for, renewables
identified under REmap can save up to USD 8 billion per year by 2030.
● A number of areas require further attention to realise the potential estimated in this working paper.
These include: the continuation of long-term energy planning; the integration of renewable energy
into existing energy policies and their implementation; minimising investment and market barriers
for solar PV and wind to accelerate uptake at their early stages of deployment; and the creation of a
reliable and affordable market for bioenergy.
2 R Em a p 2030: Re newab l e e ne rgy pros pe c t s fo r t h e Russia n Fe d e ra t io n●
КЛЮЧЕВЫЕ ВЫВОДЫ
• В России в 2010 году наиболее востребованным видом возобновляемого источника
теплоэнергии, используемого в секторах промышленности и жилищно-коммунального
хозяйства (включая центральное отопление), была биоэнергия, а в производстве
электроэнергии доминировала гидроэнергетика. В 2010 году на гидроэнергетику
и биоэнергетику приходилось соответственно 70% и 30% общего конечного
энергопотребления (0,6 эксаджоулей, ЭДж) возобновляемой энергии. В том же году
доля возобновляемой энергетики в общем объеме конечного энергопотребления России
составила 3,6%.
• К концу 2015 года общая установленная электрическая мощность объектов,
функционирующих на основе использования возобновляемых источников энергии (ВИЭ),
достигла 53,5 Гигаватт (ГВт), что составило порядка 20% от общей установленной
электрической мощности в России (253 ГВт). На гидроэнергетику пришлась практически
вся установленная мощность – 51.5 ГВт, далее в объеме 1,35 ГВт следовала биоэнергетика.
Установленные мощности солнечных и ветряных электростанций составили 460 МВт и
111 МВт соответственно.
• В отчете, основанном на результатах консультации с Правительством России и
соответствующими заинтересованными сторонами, выделяются четыре главные движущие
силы, которые, по мнению России, ускорят внедрение ВИЭ в структуру российской
энергетики: экономическая деятельность и создание новых рабочих мест, развитие науки
и технологий, поставка энергии в изолированные энергорайоны, повышение качества
окружающей среды.
• В Энергетической стратегии России на период до 2035 был разработан детальный план
энергопотребления: как в отраслевом разрезе, так и согласно основным видам топлива.
Исходя из расчетов, основанных на проекте Стратегии и данных других источников, при
сценарии «обычного хода деятельности» (Reference case) к 2030 году на долю ВИЭ будет
приходиться 4.9% конечного энергопотребления (TFEC). Это включает планы России по
увеличению солнечных, ветровых и геотермальных генерирующих мощностей до 5,9 ГВт к
концу 2024 года.
• При сценарии «обычного хода деятельности» конечное потребление энергии, произведенной
объектами ВИЭ, увеличится почти в два раза с 0,6 ЭДж в 2010 году до 1,1 ЭДж в 2030,
что в свою очередь составит порядка 5% от спроса на все виды энергии в 2030 году.
Конечное потребление возобновляемой энергии включает потребление электрической и
тепловой возобновляемой энергии, потребление биотоплива для транспортных средств,
приготовления пищи, а также для отопления и технологического нагрева. При сценарии
«обычного хода деятельности» гидроэнергетика продолжит оставаться главным ВИЭ,
покрывающим больше половины объема конечного потребления возобновляемой энергии.
С учетом доступности значительных резервов биомассы в России, рынок биоэнергетики
значительно возрастет за счет увеличения использования биотоплива для производства
тепловой энергии и использования в транспортном секторе. Таким образом, в 2030
биотопливо придется на половину конечного использования возобновляемой энергии для
производства тепловой энергии и в транспортном секторе. Использование остальных
видов ВИЭ (солнечных, ветряных и геотермальных) увеличится на 4%.
Wo rkin g Pa p er 3• Согласно REmap сценарию, в котором рассматривается ускоренное увеличение доли
возобновляемой энергетики в энергетическом секторе России, к 2030 году её объем в
конечном потреблении достигнет 11.3%. REmap предполагает использование комплекса
различных технологий возобновляемой энергетики в секторах производства и конечного
потребления энергии. В соответствии с REmap, самая большая доля возобновляемой
энергии придется на сектор производства электроэнергии, составив в 2030, около 30%, где
20% – гидроэлектроэнергия, а 10% – такие виды электроэнергии, как ветряная, солнечная
и геотермальная. Доля возобновляемой энергии в производстве тепловой энергии составит
около 15%. В транспортном секторе будет наблюдаться самый большой темп роста
использования возобновляемой энергии: к 2030 году он достигнет отметку 8% по сравнению
с 1% в 2010.
• Согласно сценарию REmap, суммарная установленная мощность ветряных
электростанций достигнет 23 ГВт, мощность солнечных электростанций возрастет до
5 ГВт, а биоэнергетических установок до 26 ГВт. К 2030 общая установленная мощность
гидроэлектростанций возрастет до 94 ГВт. В период между 2010-2030 общее производство
электроэнергии увеличится практически в три раза с 169 ТВт·ч до 487 ТВт·ч в период
между 2010-2030, что высвободит порядка 100 ТВт·ч электроэнергии, выработанной
гидроэлектростанциями и ветроустановками суммарной мощностью 30 ГВт, доступной для
экспорта в страны Азии.
• Согласно REmap, в 2030 году спрос на первичные биоэнергетические ресурсы составит
2.4 ЭДж, что, исходя из оценки IRENA, соизмеримо с потенциалом страны 2-14 ЭДж.
Это самый благоприятный исход с точки зрения доступности ресурсов, что указывает на
возможность осуществления их экспорта. Однако, чрезвычайно важно обеспечить поставки
энергетических культур и исходного сырья для производства биогаза, поскольку в 2030 году
спрос будет примерно равен предложению.
• Суммарный объем необходимых инвестиций для достижения сценария REmap оценен в
300 миллиардов долларов США за период 2010-2030, что соответствует среднегодовой
потребности в инвестициях в размере 15 миллиардов долларов США за тот же период.
На ввод новых генерирующих мощностей, функционирующих на основе ВИЭ, потребуется
практически весь объем ежегодных инвестиций в размере 13 миллиардов долларов США (за
исключением инвестиций на передачу и распределение энергии). Оставшиеся 2 миллиарда
долларов США будут направлены на сектора конечного потребления.
• В 2030 году внедрение всех рассмотренных REmap Опций в среднем потребует затрат на
замещение в размере 8,7 долл/ГДж возобновляемой энергии. Согласно REmap, данный
показатель представляет собой дополнительные расходы на все виды ВИЭ российской
энергосистемы. Данная стоимость исходит из условий 11% учетной ставки, цены на нефть
на уровне 80 долл/барр и оптовой цены на газ на уровне 3.3 дол за миллион британских
термических единиц (BTU). Предполагается, что природный газ будет главным топливом,
замещенным в тепло- и электроэнергетике. Хотя солнечные и ветряные электростанции
являются экономически жизнеспособными в энергетически изолированных областях,
в 2030 цена выработанной этими электростанциями энергии будет оставаться выше
оптовой. К 2030 децентрализованное отопление в домах и в промышленности станет
более конкурентоспособным, если для выработки тепловой энергии используются
недорогостоящие биоэнергоресурсы.
4 R Em a p 2030: Re newab l e e ne rgy pros pe c t s fo r t h e Russia n Fe d e ra t io n• Если принимать во внимание такие внешние факторы, как здравоохранение и изменение
климата, то становится ясно, что благодаря отраженному в REmap потенциалу ВИЭ к 2030
году, можно ежегодно экономить до 8 миллиардов долларов США.
• Необходимо уделять больше внимания целому ряду других сфер в целях реализации
всего оцененного в данном документе потенциала ВИЭ, включая продолжение работы над
долгосрочным энергетическим планированием, интеграцию возобновляемой энергетики
в существующую энергетическую политику и её осуществление, оптимизацию инвестиций
и устранение рыночных барьеров для солнечных и ветряных установок для ускорения их
адаптации на ранних стадиях развития проектов, и создание надежного и доступного рынка
биоэнергоресурсов.
Wo rkin g Pa p er 51. INTRODUCTION TO IRENA’S REMAP
WORK AND BRIEF METHODOLOGY
1.1 IRENA’s REmap programme second issue of the report expanded its coverage to
40 countries, accounting for 80% of world energy use.
REmap aims at paving the way to the promotion of
accelerated renewable energy development through The REmap analysis of the national plans of these
a series of activities that include the issue of global, 40 countries suggests that the global share of
regional and country level studies. REmap analyses renewables would only reach 21% under current
and activities also serve to develop other IRENA- conditions and policy approaches, unless extra attention
related publications that focus on specific renewable is paid to the matter. This indicates a 15 percentage-
technologies, or energy sectors. point gap to a doubling of the global RE share by 2030
(IRENA, 2016a).
The REmap programme is undertaken in close
collaboration with governmental bodies and other The energy sector of Russia has been undergoing
institutions responsible for energy planning and several reforms in recent years. This has helped Russia
renewable energy development. The analyses are to liberalise its electricity and natural gas markets and
carried out through broad consultations with energy adjust prices closer to international levels. The country,
experts and stakeholders from numerous countries however, still lags behind other emerging economies
around the world. in terms of the efficient uses of its energy, owing to
an out-dated transmission and distribution network
At its inception, REmap emerged as IRENA’s proposal for heat and electricity, as well as aging industrial
for a pathway to achieve the United Nations (UN) and power plant stock. While the focus of the sector
Sustainable Energy for All (SEforAll) initiative, in its is increasingly on improving the energy efficiency of
objective to double the global share of renewable the economy, currently a traditional fossil fuel user,
energy by 2030, compared to 2010 levels (UN and Russia is also now opening its markets to renewables.
The World Bank, 2016). Today, attaining widespread To raise its renewable energy use, Russia has the
development of renewables has also become crucial potential to employ its vast resources of various types
to meet the objective of the Paris Agreement adopted of renewables, including bioenergy, geothermal, hydro,
at the 21st session of the Conference of the Parties to solar and wind for electricity and heat generation, as
the United Nations Framework Convention on Climate well as transport.
Change (COP21), and the long-term global temperature
goal of maintaining the Earth’s temperature increase In 2015, IRENA and the Russian government agreed to
below 2 degrees Celsius (°C) above pre-industrial levels prepare this working paper (referred to as the “report”
and pursuing efforts to limit the temperature increase throughout the text) to explore the potential difference
to 1.5°C. renewable energy could make to diversify the country’s
energy mix. The present report aims at presenting the
In order to achieve the doubling of renewable energy’s detailed REmap Russia analysis and elaborates on the
share at the global level, REmap follows a bottom-up renewable technology options that the country could
approach. Country-level assessments are carried out to deploy further, in order to achieve a higher renewable
determine the potential contributions that each could share by 2030.
make to the overall renewable share. The first global
REmap report published in 2014 included a detailed
analysis of 26 countries, encompassing the major 1.2 The REmap approach
energy consumers, representing around 75% of global
energy demand. The Russian Federation (throughout This section explains the REmap methodology and
this text referred to as “Russia”) was one of them. The summarises details about the background data used for
6 R Em a p 2030: Re newab l e e ne rgy pros pe c t s fo r t h e Russia n Fe d e ra t io nthe Russia analysis. The Annexes provide the relevant Throughout this report the renewable energy share
data and results in greater detail. is estimated in relation to TFEC.1 Modern renewable
energy excludes traditional uses of bioenergy2; the
REmap is an analytical approach. It assesses the gap share of modern renewable energy in TFEC is equal to
between the situation if all countries worldwide would total modern renewable energy consumption in end-use
follow their present national plans, the potential additional sectors (including consumption of renewable electricity
renewable technology options in 2030 and a doubling of and district heat and direct uses of renewables),
the global renewable energy share by 2030. By March divided by the TFEC. The share of renewables in power
2016, in IRENA’s REmap programme, the renewables generation is also calculated. The renewable energy
potential of 40 countries had been assessed: Argentina, share can also be expressed for the direct uses of
Australia, Belgium, Brazil, Canada, China, Colombia, renewables only. The renewable energy use by end-use
Cyprus, Denmark, Dominican Republic, Ecuador, Egypt, sector comprises the following:
Ethiopia, France, Germany, India, Indonesia, Iran, Italy,
Japan, Kazakhstan, Kenya, Kuwait, Malaysia, Mexico, ●● Buildings include the residential, commercial
Morocco, Nigeria, Poland, Republic of Korea, the Russian and public sectors. Renewable energy is used in
Federation, Saudi Arabia, South Africa, Sweden, Tonga, direct applications for heating, cooling or cooking
Turkey, Ukraine, the United Arab Emirates, the United purposes, or as renewable electricity.
Kingdom, the United States and Uruguay.
●● Industry includes the manufacturing and mining
The analysis starts with national data covering all sectors, where renewable energy is consumed
energy end-users (buildings, industry, transport and in direct use applications that comprise mainly
agriculture) and the electricity and district heating process heat, and as electricity from renewable
sectors. Current national plans using 2010 as the base sources.
year of this analysis are the starting point. To the extent
data availability allows, information for more recent ●● Transport sector, which can make direct use of
years (e.g. 2015) was provided where relevant. In each renewables through the consumption of liquid
report, a Reference Case features policies in place and gaseous biofuels, or through the use of
or under consideration, including energy efficiency electricity generated by means of renewable
improvements. The Reference Case includes total final energy technologies.
energy consumption (TFEC) for each end-use sector
and the total generation of power and district heating
sectors, as well as breakdowns by energy carrier for 1.3 Metrics for assessing REmap
2010-2030. Options
Once the Reference Case is prepared, additional In order to assess the costs of REmap Options,
renewable technology options are identified and substitution costs are calculated. This report also
labelled in the report as REmap Options. The use of discusses the costs and savings from renewable
options as opposed to an approach based on scenarios
is deliberate. REmap 2030 is an exploratory study 1 Total final energy consumption (TFEC) is the energy delivered
and not a target-setting exercise. Each REmap Option to consumers, whether as electricity, heat or fuels that can be
used directly as a source of energy. This consumption is usually
substitutes a non-renewable energy technology used sub-divided into that used in: transport; industry; residential,
to deliver the same amount of energy (e.g. power, commercial and public buildings; and agriculture; it excludes
non-energy uses of fuels.
cooking heat etc.). The implementation of REmap
2 The UN Food and Agriculture Organization of the United Nations
Options results in a new energy mix with a higher defines traditional use of biomass as “woodfuels, agricultural by-
share of renewables, which is called the REmap case. products, and dung burned for cooking and heating purposes”. In
developing countries, traditional biomass is still widely harvested
Non-renewable technologies include fossil fuels, nuclear
and used in an unsustainable, inefficient and unsafe way. It is
and traditional uses of bioenergy. As a supplement mostly traded informally and non-commercially. So-called modern
to the annexes in this report, a detailed list of these biomass, by contrast, is produced in a sustainable manner from
solid wastes and residues from agriculture and forestry, and is
technologies and related background data are provided utilised with more efficient methods (IEA and the World Bank,
online. 2015).
Wo rkin g Pa p er 7Cost of Equivalent
Technology/ annual Operating Fuel
REmap
Options
USD/year
= capital
expenditure
USD/year
+ expenditure
USD/year
in 2030
+ cost
USD/year
in 2030
in 2030 in 2030
energy deployment and the consideration of related System costs
Cost of
Cost of REmap
–
externalities from climate change and air pollution. Options
substituted
conventional
Four main indicators have been developed, namely Based on the
Substitution substitution cost,
USD/year inference can be made
technology
=
cost in 2030
substitution costs, system costs, total investment as to the effect on system costs. This indicatorin is
USD/year the
2030
USD/GJ
needs and needs for renewable energy investment sum of the differences between the total capital and
in 2030
support. operating expendituresEnergy
of allsubstituted
energy technologies based
by REmap Options
on their deployment in REmapGJ/yearand the Reference Case,
in 2030
in 2030.
Substitution cost
Each renewable and non-renewable technology has REmap
Substitution
System Options
= x
its own individual cost relative to the non-renewable costs
cost: government
perspective All
energy it substitutes. This is explained in detail in USD/year
All technologies
technologies
in 2030 GJ/year
the methodology of REmap (IRENA, 2014a) and is USD/GJ in 2030
in 2030
represented in the following equation:
Cost of Equivalent Investment
Cost of
needs Renewable
Equivalent Average
Technology/ annual Operating Fuel
= + + x +
REmap capital expenditure cost Technology/ capacity
annual Operating capitalFuel
= +
Options expenditure Investment
REmap needscapital
for renewable
installed energy
expenditure capacity
expenditure
cost
USD/year USD/year Average
Options expenditure
can also be assessed. TheGW total investment
USD/year needs
USD/year of
=
USD/year USD/year in 2030 in 2030 investment Total USD/GW
in 2030 in 2030 USD/year
needs USD/year in 2030 in 2030
2016–2030 2016–2030
technologies
in 2030 in REmap
in 2030 are higher than in the Reference
USD/year
Case due to the increased share of renewables which,
2016–2030
For each REmap Option, Cost of the analysis considers
REmap
Cost
theof costs on average, have higher investment 15 needs than the
of non-
–
substituted Cost
Cost of REmap
–
Options Number of years 2016–2030
substituted
of Cost
substituting
of a Equivalent
non-renewable energy technology conventional to renewable energy technology Options equivalent.conventional
The capital
Substitution USD/year Operating technology
==
Technology/ annual Fuel
+ +
deliver USD/year States dollartechnology
costthe same amount of heat,
capitalin 2030 electricity or energy investment
Substitution cost (in United (USD) per
=
REmap expenditureUSD/year incost
2030 in 2030
Options expenditure cost USD/year in 2030
service. The cost of each REmap USD/year
Option is USD/year
represented kilowatt,
USD/GJ USD/kW of installed capacity) in each year is
USD/GJ Substitution 4
USD/year
in 2030 USD/year in 2030 in 2030 cost: REmap
x
byinits substitutionincost
2030 20303: multiplied
in 2030 by the deployment in that year to arrive at
Investment government Options
=
Energy substituted by REmap Options support perspective
GJ/year in 2030 totalforannual
RE investment costs.
Energy The capital
substituted by REmap investment
Options
Technologies
TechnologiesGJ/year in 2030with positive
Cost of costs of each year are
USD/year withthen summed over
positive the period
substitution cost
Cost of REmap
–
substituted in 2030
Options
conventional
2010-2030. Net incremental investment needs
substitution cost are
GJ/year in the
2030
Substitution USD/year technology sum of the differences USD/GJ between
in 2030 the total investment
=
cost in 2030 REmap
Substitution USD/year in 2030
System Options costs for all technologies, renewable and non-renewableREmap
= x
USD/GJ cost: government Substitution
System Options
= x
costs All cost: government
in 2030
USD/year
perspective
technologies
energy,
costs in power generation and stationary applications
perspective All
All technologies USD/year technologies
in 2030 Energy substituted by REmap Options
USD/GJ in 2030
GJ/year in in
REmap
2030
and the Reference Case
All technologies in the period
GJ/year
2010-
GJ/year in 2030 in 2030 USD/GJ in 2030
2030 for each year. This total was then turned into an
in 2030
annual average for the period.
This indicator provides a comparable metric
Renewable Average
for all
Renewable Average
xx
renewable energy technologies REmap
Substitution identified in each sector.
capacity capital
x
System installed Options
expenditure capacity capital
==
Average cost: government
Substitution
costs
investment
costs are the key indicators for assessing
perspective All Average
installed expenditure
Total GW USD/GW
=
USD/year technologies investment
theineconomic
needs
2030
viability of REmap Options. They
2016–2030
All technologies depend
2016–2030
GJ/year needs
Total GW USD/GW
USD/GJ in 2030 2016–2030 2016–2030
onUSD/year
the type of conventional technology substituted, in 2030
USD/year
2016–2030
energy prices and the characteristics of the REmap 2016–2030
15 15
Option. The cost can be positive Number(additional) or negative
of years 2016–2030
Number of years 2016–2030
Renewable Average
(savings) due to the fact that many renewable energy
x
capacity capital
technologies
Average are, or Substitution
by 2030 could be, cost-effective
installed expenditure
Renewable investment support
=
investment Substitution
compared to conventionalTotal technologies.
cost:
GW REmap
USD/GW
x
needs
Investment government
2016–2030 Options
2016–2030 cost: REmap
x
Investment
=
support perspective Renewable investment support needs Options
government can also
=
USD/year
for RE Technologies support perspective
2016–2030 Technologies with positive be approximated based on the REmap tool. Total
for RE Technologies
USD/year
in 2030
3 Substitution cost is the
with positive
difference
substitution
15
between
cost
substitution cost
the annualised cost USD/year
Technologies
with positive
with positive
substitution cost
Number of years 2016–2030
GJ/year in 2030 in 2030 substitution cost
of the REmap OptionUSD/GJ
and theinannualised
2030 cost of the substituted GJ/year in 2030
4 For the purpose of this analysis, a currency exchange rate of
non-renewable technology, used to produce the same amount Rubles (RUB) 48 perUSD/GJ
1 USDinthat
2030refers to the year 2014 was
of energy. This is divided by the total renewable energy use assumed.
Substitution
substituted by the REmap cost:
Option. REmap
x
Investment government Options
=
support perspective
for RE Technologies
Technologies with positive
8 USD/year
R Em with positive
a p 2030: Re newab substitution
l e e ne rgy pros pe c t s fo r cost
t h e Russia n Fe d e ra t io n
in 2030 substitution cost
GJ/year in 2030
USD/GJ in 2030USD/GJ
in 2030
=
Energy substituted by REmap Options
GJ/year in 2030
requirements for renewable
Substitution
investment support REmapin all of all additional costs related to complementary
System Options
= x
sectors
costs are estimated as the difference in the delivered
cost: government infrastructure is excluded from this report (e.g.
perspective All
energy
USD/yearservice cost (e.g. in USD/kWh or
All technologies
USD/GJ,
technologies grid reinforcements, fuel stations, etc.). IRENA
in 2030 GJ/year
based on a government USD/GJ perspective)
in 2030 for the renewable
in 2030 analysis suggests that these costs would be of
option against the dominant incumbent in 2030. This secondary importance for countries that are just
difference is multiplied by the deployment for that starting with an energy system transformation.
option in that year toRenewable
arrive at an investment support
Average
x
capacity capital
total for that technology. The differences for
installed all REmap
expenditure
Average Externality analysis
Options are summed to provide an annual USD/GW
investment
=
investment Total GW
needs 2016–2030 2016–2030
support requirement for renewables. Notably, where the The externality reductions that would be obtained
USD/year
renewable
2016–2030 option has a lower delivered energy service with the implementation of REmap Options that are
cost than the incumbent option, which 15 begins to occur considered include: health effects arising from outdoor
Number of years 2016–2030
increasingly by 2030, it is not subtracted from the total. exposure; health effects arising from indoor exposure
in the case of traditional use of bioenergy; and effects
Substitution on agricultural yields. Additionally, the external costs
cost: REmap
x
Investment government Options associated with the social and economic impact of
=
support perspective
for RE Technologies carbon dioxide (CO2) are estimated (IRENA, 2016b).
Technologies with positive
USD/year with positive substitution cost
in 2030 substitution cost
GJ/year in 2030 Further documentation and a detailed description
USD/GJ in 2030 of the REmap methodology can be found at
www.irena.org/remap Further details on metrics for
assessing Options can be consulted in Appendix of the
Government and business perspectives global report 2016 edition (IRENA, 2016a).
Based on the substitution cost and the potential of each
REmap Option, country cost-supply curves have been
developed for the year 2030 from two perspectives: 1.4 Main sources of information
government and business: and assumptions for REmap
●● Government perspective: Cost estimates
Russia
exclude energy taxes and subsidies, and in the In order to introduce the background data and literature
latest global REmap report (IRENA, 2016a), a that has been used to prepare REmap Russia, the main
standard discount rate of 10% for non-OECD sources and assumptions are summarised below for
member countries, or 7.5% for OECD member each case:
countries, was used. This approach allows for a
comparison across countries and for a country ●● Base year 2010: The energy balances for the
cost-benefit analysis; it shows the cost of the analysis base year, 2010, originate from data
transition as governments would calculate it. provided by the International Energy Agency
(IEA, 2015a). Where relevant, the data has been
●● Business perspective: This considers national updated with the national energy statistics
prices (including, for example, energy taxes, provided by the Russian government. As
subsidies and the cost of capital) in order to mentioned earlier, for the REmap analysis, all
generate a localised cost curve. This approach end-use demand is broken into sectors: industry,
shows the cost of the transition as businesses or transport and buildings.
investors would calculate it. In the case of Russia,
a discount rate of 11% is assumed. ●● Reference Case: For Russia, this was based on
the Energy Strategy of Russia for the period
●● By estimating the costs from the two perspectives, to 2030 (hereinafter referred to as “Energy
the analysis shows the effects of accounting Strategy to 2030”) and data provided by the
for energy taxes and subsidies, while all other Ministry of Energy of the Russian Federation in
parameters are kept the same. The assessment its latest results of the “Energy Strategy to 2035”
Wo rkin g Pa p er 9(Minenergo, 2017) (personal communication with ●● 1 PJ =
0.0238 million tonnes of oil equivalent
the Ministry of Energy of the Russian Federation) (Mtoe)
accompanied by IRENA’s calculations based on
the aforementioned data. ●● 1 PJ = 277.78 gigawatt-hour (GWh)
●● REmap: This is based on IRENA’s analysis (details ●● 1 EJ =
23.88 million tonnes of oil equivalent
of sources and assumptions can be found in (Mtoe)
Chapter 3 and in Annex 3). The renewable energy
technology potential between REmap and the ●● 1 EJ = 277.78 terawatt-hour (TWh)
Reference Case is called the “REmap Options”.
This report is structured as follows: Chapter 2 introduces
Finally, energy supply and demand numbers in this the current renewable energy situation in Russia.
report are generally provided in gigajoule (GJ), petajoule Chapter 3 provides a brief overview of Russia’s energy
(PJ) or exajoule (EJ), the standard for REmap. In Russia, markets; Chapter 4 describes the renewable energy
commonly used units are tonnes of oil equivalent (toe) developments according to the Reference Case; Chapter
and tonnes of coal equivalent (tce). Below are the 5 presents the additional potential of renewable energy
relevant conversion factors: by 2030 and discusses how this potential could be
realised by identifying the possible opportunities and
●● 1 GJ = 0.0238 tonnes of oil equivalent (toe) proposing solutions to policy-makers and other relevant
stakeholders.
●● 1 GJ = 0.0341 tonnes of coal equivalent (tce)
●● 1 GJ = 277.78 kilowatt-hour (kWh)
10 R Em a p 2030: Re newab l e e ne rgy pros pe c t s fo r t h e Russia n Fe d e ra t io n2 CURRENT RENEWABLE ENERGY
SITUATION IN RUSSIA
The main purpose of this chapter is to provide an For instance, one of the largest solar power plants in
overview of the current state of renewable energy the country, in Kaspiysk, Dagestan, came into operation
use in Russia. It will look at the drivers for renewable in 2013, with a total capacity of 1 MW (Kavkaz, 2013). In
energy deployment and those policies relevant to an the same year, another five smaller plants, with a total
acceleration of uptake in the country. The chapter also capacity of 166 kW were put in operation. Both solar PV
provides a brief overview of Russia’s resource potential. and onshore wind are developing further in Russia.
In 2015, about 57 MW of new renewable energy
2.1 Current status of renewables capacity was introduced (excluding large hydropower
and bioenergy). In 2016, new capacity introduced to
Power sector the system reached about 70 MW. During 2017, the
Ministry of Energy of the Russian Federation expects
Bioenergy and large hydropower are the main sources the commissioning of renewable energy capacity of
of renewables in Russia’s energy system. In 2015, total more than 100 MW (Energy-Fresh, 2017).
installed renewable power capacity reached 53.5 GW.
This represents about 20% of the country’s total Installed geothermal capacity, mainly located in the
installed power generation capacity (approximately eastern part of Russia, has reached 86 MW end of 2015.
253 GW). Small and medium hydropower represents One of the most important trends in the development
about 280 MW of this total.5 This total also includes of the country’s geothermal energy is the building
about 1.2 GW of pumped hydro (IRENA, 2016c). There of binary geothermal power plants. There are three
are more than 100 hydropower plants each with a large-scale geothermal power plants in operation in
capacity higher than 100 MW. Hydropower is followed Kamchatka: two of them of 12 MW and one of 50 MW
by bioenergy, with 1.35 GW of total installed capacity total installed capacity. These are located in the Verkhne
from 39 plants (including 2.9 MW of installed biogas Mutnovsky and Mutnovsky fields, respectively, while
capacity from two plants). The average bioenergy another plant, with a total installed capacity of 11 MW, is
power plant has a total capacity of 35 MW. Most facilities located in the Pauzhetsky field. In addition, on the Kuril
are combined with other fuels (personal communication Islands (Kunashir and Iturup) two small-scale plants are
with the Ministry of Energy of the Russian Federation, in operation with capacities of 3.6 MW each (Svalova
2017). and Povarov, 2015).
Excluding hydropower and bioenergy, the remaining All the plants in operation today employ single flash
renewable power generation capacity is spread among technology (Bertani, 2015). The construction of a new
solar PV, wind and geothermal. This amounts to a total plant on the Kamchatka Peninsula with an organic
of 660 MW. By the end of 2015, total power generation rankine cycle (ORC) is being completed by RusHydro.
capacity for solar PV and wind amounted to 460 MW ORC technology allows an increase in the total installed
and 111 MW, respectively. capacity of the existing plant without drilling new wells,
since the geothermal fluid is used more efficiently
Russia has been installing solar PV capacity since 2010, (Nikolskiy et al., 2015).
and since 2013, capacity installations have accelerated.
Total installed large tidal power plant capacity in Russia
is around 400 kW. The country’s single plant was built
5 If small hydropower were to be defined according to the IRENA
convention of capacity less than 10 MW, total installed capacity in 1967 and is located at Kislaya Guba. This has a mean
would amount to 175 MW. tide range of 2.3 meters (Gorlov, 2009).
Wo rkin g Pa p er 11You can also read