RENEWABLE ENERGY OPPORTUNITIES - FOR ISLAND TOURISM - IRENA
←
→
Page content transcription
If your browser does not render page correctly, please read the page content below
IRENA
                International Renewable Energy Agency

RENEWABLE ENERGY
OPPORTUNITIES
FOR ISLAND TOURISM

                                AUGUST 2014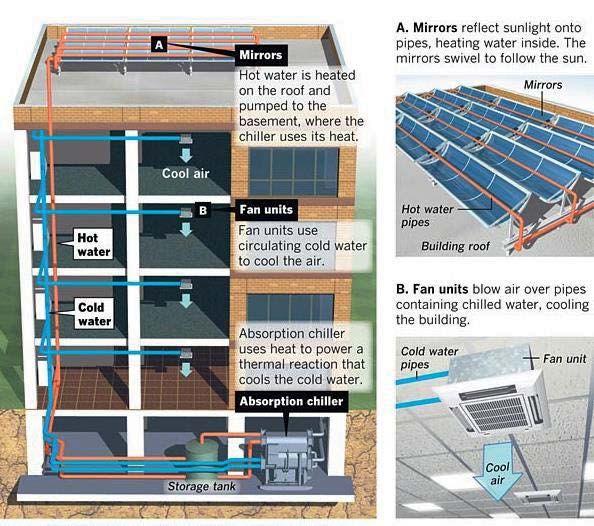
Copyright © IRENA 2014
Unless otherwise indicated, material in this publication may be used freely, shared or reprinted, so long as IRENA is
acknowledged as the source.

About IRENA
The International Renewable Energy Agency (IRENA) is an intergovernmental organisation that supports countries in
their transition to a sustainable energy future, and serves as the principal platform for international co-operation, a centre
of excellence, and a repository of policy, technology, resource and financial knowledge on renewable energy. IRENA
promotes the widespread adoption and sustainable use of all forms of renewable energy, including bioenergy geothermal,
hydropower, ocean, solar and wind energy, in the pursuit of sustainable development, energy access, energy security and
low-carbon economic growth and prosperity. www.irena.org

Acknowledgements
This report was produced in collaboration with Andrea Bassi, Knowledge Srl, contracted as a consultant by IRENA.

The report has benefitted from inputs from the participants in the IRENA event on renewable energy for island tourism,
which took place in Cyprus on 29 and 30 May 2014, hosted in co-operation with the Government of the Republic of Cyprus.

Peer reviewers provided invaluable feedback to enhance and enrich this report. In particular, many thanks go to Mario
Gamberale (AzzeroCO2 and Exalto), United Nations World Tourism Organisation (UNWTO), Adriana Maria Valencia
Jaramillo (Inter-American Development Bank - IDB), Cipriano Marin (Renewable Energy Futures for UNESCO Sites -
RENFORUS/UNESCO), Les Nelson (International Association of Plumbing and Mechanical Officials - IAPMO), Giuseppe
Sauli (Nidec ASI S.p.A.), Brett Shapiro (editorial consultant) and Riccardo Toxiri (Gestore dei Servizi Energetici S.p.A). The
report also benefitted from internal review with inputs from Jeffrey Skeer and overall guidance from Dolf Gielen.

Authors:
Emanuele Taibi and Peter Journeay-Kaler (IRENA)
Andrea Bassi (KnowlEdge srl)

For further information or to provide feedback, please contact:
Emanuele Taibi, IRENA Innovation and Technology Centre
E-mail: ETaibi@irena.org or secretariat@irena.org

Disclaimer
While this publication promotes the adoption and use of renewable energy, the International Renewable Energy Agency
does not endorse any particular project, product or service provider.

The designations employed and the presentation of materials herein do not imply the expression of any opinion
whatsoever on the part of the International Renewable Energy Agency concerning the legal status of any country,
territory, city or area or of its authorities, or concerning the delimitation of its frontiers or boundaries.
Renewable Energy Opportunities
      for Island Tourism

     International Renewable Energy Agency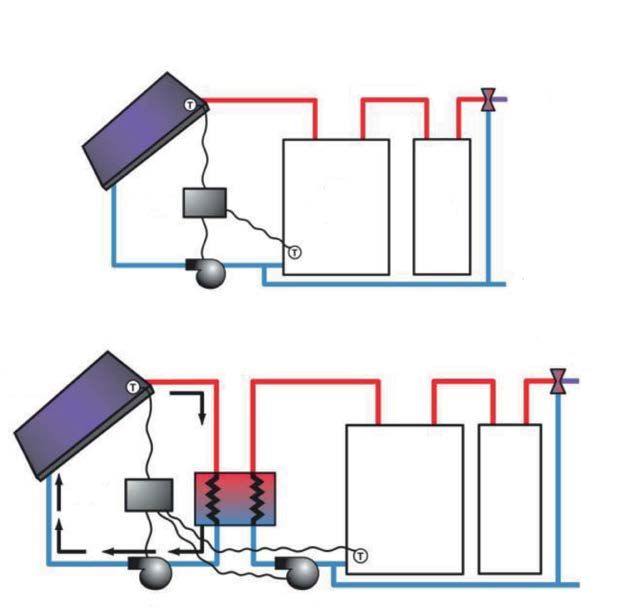
iv R e newa ble Energy O ppor t u ni t i e s for Is l and To urism
CONTENTS

LIST OF FIGURES                                                                                                                                                                              V

LIST OF TABLES������������������������������������������������������������������������������������������������������������������������������������������������������������������������������VI
LIST OF BOXES��������������������������������������������������������������������������������������������������������������������������������������������������������������������������������VI

EXECUTIVE SUMMARY�������������������������������������������������������������������������������������������������������������������������������������������������������������������1

1 INTRODUCTION��������������������������������������������������������������������������������������������������������������������������������������������������������������������������3
     1.1	Energy trends in the tourism sector and in Small Island Developing States������������������������������������������ 4
     1.2	An opportunity for the tourism sector to increase profitability and reduce socio-economic
          vulnerability����������������������������������������������������������������������������������������������������������������������������������������������������������������������� 9

2	TECHNOLOGY ASSESSMENT: INVESTMENTS, AVOIDED COSTS AND ADDED BENEFITS����������������������� 11
     2.1 Solar water heating systems��������������������������������������������������������������������������������������������������������������������������������������14
     2.2 Solar Air Conditioning systems�������������������������������������������������������������������������������������������������������������������������������� 17
     2.3	Sea Water Air Conditioning systems���������������������������������������������������������������������������������������������������������������������20
     2.4 Solar Photovoltaic systems��������������������������������������������������������������������������������������������������������������������������������������� 23

3	BARRIERS, ENABLING CONDITIONS AND BEST PRACTICES������������������������������������������������������������������������������ 31
     3.1	Barriers to technology deployment����������������������������������������������������������������������������������������������������������������������� 32
     3.2 Enabling policies������������������������������������������������������������������������������������������������������������������������������������������������������������ 33
     3.3 Review of best practices��������������������������������������������������������������������������������������������������������������������������������������������38

4	MODELING THE OUTCOMES OF RET ADOPTION IN ISLAND TOURISM���������������������������������������������������������43
     4.1 Model specifications�����������������������������������������������������������������������������������������������������������������������������������������������������43
     4.2 Main results����������������������������������������������������������������������������������������������������������������������������������������������������������������������45

5 RELEVANT CASE STUDIES������������������������������������������������������������������������������������������������������������������������������������������������� 47
     5.1 Turtle Beach Resort, Barbados�������������������������������������������������������������������������������������������������������������������������������� 47
     5.2	Intercontinental Bora Bora Resort & Thalasso Spa �����������������������������������������������������������������������������������������48
     5.3 Turtle Island Resort, Fiji�����������������������������������������������������������������������������������������������������������������������������������������������49
     5.4 Rethymno Village Hotel, Crete���������������������������������������������������������������������������������������������������������������������������������50

6 CONCLUSIONS�������������������������������������������������������������������������������������������������������������������������������������������������������������������������� 51

                                                                                                 Re n ewa b l e E n e rg y O p p o r t un it ie s fo r I sl a n d Tou rism                          v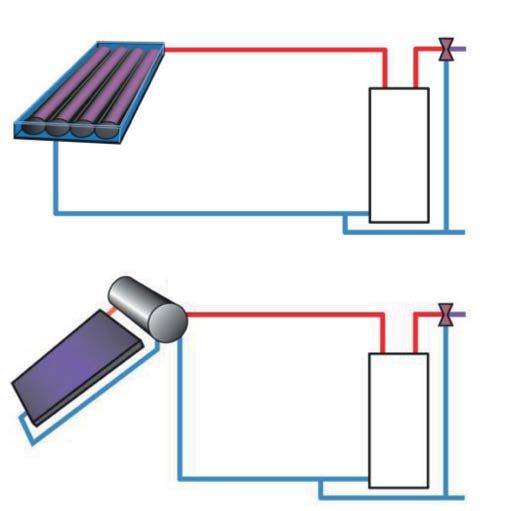
ANNEX I: TECHNOLOGY DETAILS����������������������������������������������������������������������������������������������������������������������������������������� 53
          Solar water heating (SWH) systems�������������������������������������������������������������������������������������������������������������������������������� 53
          Solar air conditioning (SAC) systems������������������������������������������������������������������������������������������������������������������������������ 55
          Sea water air conditioning (SWAC) systems���������������������������������������������������������������������������������������������������������������� 55
          Solar photovoltaic (PV) systems���������������������������������������������������������������������������������������������������������������������������������������56

     ANNEX II: REVIEW OF RENEWABLE ENERGY POLICIES IN SIDS����������������������������������������������������������������������������59

     REFERENCES�����������������������������������������������������������������������������������������������������������������������������������������������������������������������������������61

vi   R e newa ble Energy O ppor t u ni t i e s for Is l and To urism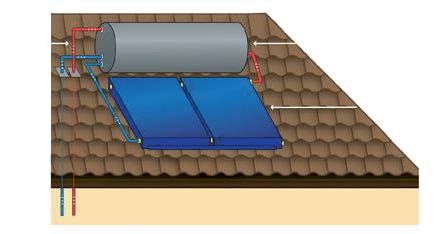
List of Figures
Figure 1. Inbound tourism by mode of transport. Global average (left), SIDS (right) ..........................................5
Figure 2. Breakdown of energy use for an average hotel. ...............................................................................................5
Figure 3. Breakdown of electricity consumption in the hotel sector of Barbados, by hotel size..................... 6
Figure 4. International tourism receipts in SIDS (% of total export and GDP)..........................................................7
Figure 5. Tourist arrivals in SIDS, total and as share of world tourist arrivals. .........................................................7
Figure 6. Average renewable energy consumption in SIDS, including hydro (% of TFEC). ...............................8
Figure 7. Typical Levelized Cost of Electricity ranges with weighted average for 2013.
Graphs assume a 10% cost of capital. ..............................................................................................................................10
Figure 8. Range of LCOE estimations for PV, SWH, SAC and SWAC,
under different CAPEX assumptions, compared to the business-as-usual solutions................................... 13
Figure 9. Range of LCOE estimations for PV, SWH, SAC and SWAC, under different Weighted
Average Cost of Capital (WACC) assumptions, compared to the business-as-usual solutions................ 13
Figure 10. Schematic representation of a solar water heater. Source: Australian Government.......................14
Figure 11. Range of LCOE estimations for SWH, under different Weighted Average Cost
of Capital (WACC) assumptions, and compared to the cost of electric water heaters
based on island electricity prices........................................................................................................................................ 15
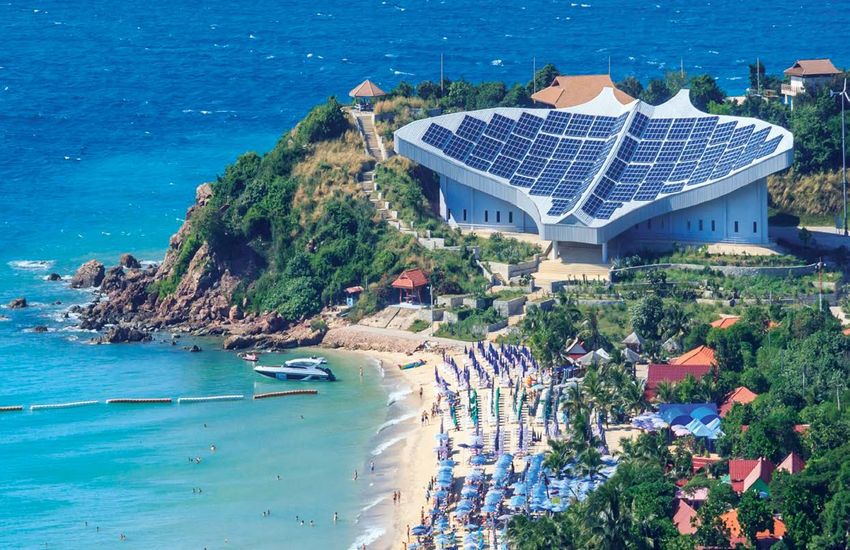
Figure 12. Schematic representation of a SAC system with parabolic trough........................................................18
Figure 13. Range of LCOE estimations for SAC, under different Weighted Average Cost of Capital
(WACC) assumptions, and compared to the cost of electric chillers, based on island electricity
prices and COP of 2.8.............................................................................................................................................................20
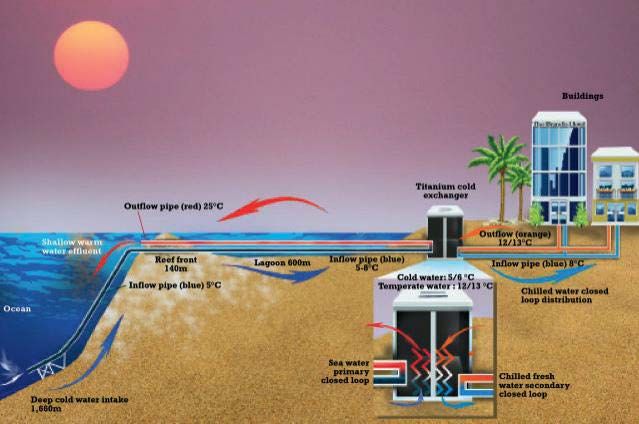
Figure 14. Schematic representation of the sea water air conditioning (SWAC) system installed at
The Brando resort, French Polynesia. .............................................................................................................................. 21
Figure 15. Range of LCOE estimations for SWAC, under different Weighted Average
Cost of Capital (WACC) assumptions, and compared to the cost of electric chillers,
based on island electricity prices and COP of 2.8....................................................................................................... 22
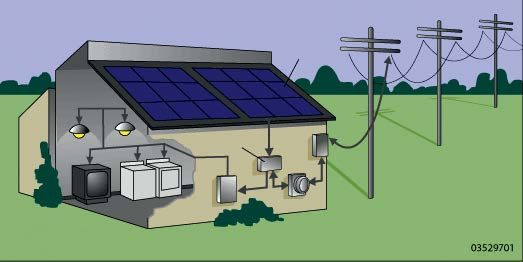
Figure 16. Main components of grid-connected solar PV systems.............................................................................24
Figure 17. Main components of an off-grid solar PV systems.......................................................................................24
Figure 18. Range of LCOE estimations for solar PV, under different Weighted Average
Cost of Capital (WACC) assumptions, and compared to the electricity price range i
n islands (diesel generators)................................................................................................................................................26
Figure 19: Causal Loop Diagram (CLD) representing the main feedback loops and indicators
included in the model.............................................................................................................................................................44
Figure20: Avoided energy bill minus investment annual (million USD/year)
and cumulative (million USD)..............................................................................................................................................45
Figure A1. Schematic active SWH, showing pumps and controllers to transfer heat from
collector to storage: (a) direct system (no heat exchangers); (b) indirect system with two
heat exchangers. .....................................................................................................................................................................54
Figure A2. Schematic passive system, with no pumps/controllers to circulate heat.
Top: integral collector storage system. Bottom: thermosiphon system.............................................................54
Re n ewa b l e E n e rg y O p p o r t un it ie s fo r I sl a n d Tou rism vii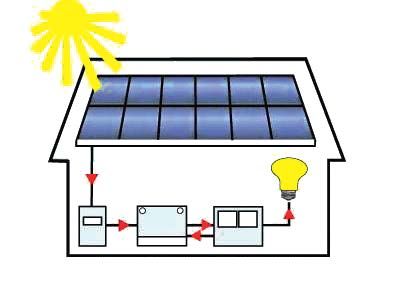
List of Tables
Table 1. Summary table of key assumptions used for LCOE calculation of SWH systems��������������������������������16
Table 2. Summary table of key assumptions used for LCOE calculation of SAC systems,
and results�����������������������������������������������������������������������������������������������������������������������������������������������������������������������������������19
Table 3. Summary table of key assumptions used for LCOE calculation of SWAC systems,
and results���������������������������������������������������������������������������������������������������������������������������������������������������������������������������������� 23
Table 4. Summary table of key assumptions used for LCOE calculation of
solar PV rooftop systems, and results�����������������������������������������������������������������������������������������������������������������������������26
Table 5. Indicators and costs of renewable energy investments
in small island tourism facilities, by technology type����������������������������������������������������������������������������������������������� 27
Table 6. Avoided costs resulting from renewable energy investments in tourism facilities,
by actor type. ���������������������������������������������������������������������������������������������������������������������������������������������������������������������������29
Table 7. Indicators of added benefits resulting from renewable energy investments
in tourism facilities, by actor type. ����������������������������������������������������������������������������������������������������������������������������������30
Table 8. Renewable energy deployment in island tourism: main barriers, intervention
options and relevant case studies by island context, hotel ownership and technology option��������������42
List of Boxes
Text Box 1 – Required investment and the Levelized Cost of Electricity of
renewable energy technologies.......................................................................................................................................... 12
Text Box 2 – The solar water heater industry in Barbados............................................................................................. 15
Text Box 3 – Ice: a cost-effective thermal energy storage solution............................................................................ 17
Text Box 4 – Solar air conditioning in Aegean islands hotels........................................................................................ 17
Text Box 5 – Installation and operation of SWAC systems in island hotels............................................................. 22
Text Box 6 – Solar PV installations in island hotels........................................................................................................... 25
Text Box 7 – Avoided costs and added benefits from RET uptake and use........................................................... 28
Text Box 8 – International cooperation on renewable energy in SIDS...................................................................... 33
v iii R e newa ble Energy O ppor t u ni t i e s for Is l and To urismEXECUTIVE SUMMARY
Tourism represents an important economic driver for generated electricity, either purchased from the
island economies, and is at the same time highly de- local power grid, or self-produced with private
pendent on a reliable, affordable and environmentally diesel generators.
friendly energy supply. Energy supply in islands is still
dominated by fossil fuels, in particular oil products. As Island hotels are increasingly investing in RETs, which
a consequence, this makes the tourism sector – and the are now cost-competitive in most island contexts (IRE-
whole economy – of islands vulnerable to the volatility NA, 2013a; IRENA, 2012a). The four technologies ana-
of oil prices, and to the impacts deriving from the use of lyzed in this report have been compared to the typical
fossil fuels in a fragile environment. alternative found in most island hotels, and proved to be
cost-effective, with attractive payback periods. The case
In island tourism facilities, energy services such as air studies show a range of less than one year for SWH, and
conditioning, lighting, cooking and water heating are up to 11 years for small-scale SWAC systems.
often provided by fossil fuels, primarily from electric-
ity produced by diesel generators. The high price of In addition to the economic benefits directly derived
diesel fuel used for power generation results in com- from reduced energy costs, case studies indicate that
mercial electricity tariffs that are much higher than the the transition to renewable energy will bring additional
global average. In 2012 the average electricity price was gains by attracting eco-friendly travelers who are willing
USD 0.33/kWh in Caribbean islands and Mauritius, and to pay a premium for sustainable tourism experiences.
USD 0.43/kWh in Hawaii. In 2010 the electricity price The well-being of island communities will also be im-
in Pacific Island Countries ranged between USD 0.17 proved through the reduction of air and water pollution
and 0.51/kWh .This is in comparison to an average price from fossil fuel combustion and spillages, as well as
of about USD 0.26/kWh in EU member states, and through the creation of additional employment oppor-
USD 0.09/kWh in China and Canada (European Com- tunities for the installation, operation and maintenance
mission, 2014). Since the electricity bill is an important of RETs.
cost item for island hotels, the island tourism sector fac-
es difficulties in offering competitive prices compared However, the pace and scale of investment in RETs in
with the majority of non-island destinations, which have island tourism is currently well below its potential.
much lower energy costs.
Three key barriers that limit RET deployment in the
This report analyzes in detail the potential contribution tourism sector of islands are:
to the island tourism sector of four renewable energy zz Competitiveness of RE options (technical and
technologies (RETs): economic barriers)
zz Access to capital and cost of financing (owner-
zz Solar water heating (SWH) systems use solar ship and financial barriers)
heat to warm up domestic water, usually replac- zz Institutional and technical capability (knowledge
ing electric water heaters. gaps)
zz Solar air conditioning (SAC) systems use solar Enabling policies are discussed to provide solutions to
heat to provide cooling and heating, usually re- remove these barriers and accelerate the deployment of
placing traditional electric chillers. RETs in island tourism. These include capital investment,
zz Sea water air conditioning (SWAC) systems use incentives and disincentives, public targets mandated
cold water from the ocean depths to provide air by law, and institutional and technical capacity building.
conditioning in hotel rooms and facilities, usually Best practices and case studies that illustrate successful
replacing traditional electric chillers. deployment of each of these four RETs in island tourism
zz Solar photovoltaic (PV) systems produce elec- facilities are also presented, to show their benefits and
tricity from the sun, usually replacing diesel- provide concrete examples for replication.
Re n ewa b l e E n e rg y O p p o r t un it ie s fo r I sl a n d Tou rism 12 R e newa ble Energy O ppor t u ni t i e s for Is l and To urism
1 INTRODUCTION

With the exception of a few countries, small island           results in a drop in tourism demand and a consequent
states rely heavily on fossil fuels for their energy sup-     loss of revenue. Thus, increasing fossil fuel prices have a
ply. While diesel generators provide flexibility for power    direct impact on island tourism competitiveness.
generation, diesel prices are high, especially in Small
Island Developing States (SIDS), as a result of the dis-      RETs can generate significant savings for tourism opera-
tance from major oil refining and distribution hubs, high     tors by offsetting or replacing the use of diesel-based
fuel prices and import costs, lack of modern port and         electricity. In contrast to volatile diesel-based electricity
fuel storage facilities, and the use of outdated technolo-    prices, RETs provide stable operating costs to assist ho-
gies in some countries.                                       tels and resorts with long-term business planning. RETs
                                                              also contribute to improving the state of the environ-
Tourism represents an important economic driver for           ment and support efforts to position islands as sustain-
a small island economy, and is at the same time highly        able tourism destinations. All of these factors increase
dependent on reliable, affordable and environmentally         the competitiveness of the island tourism sector. This
friendly energy supply. This makes SIDS’ tourism, and         study assesses the potential contributions that four
SIDS’ economies as a consequence, vulnerable to fossil        commercially available RETs can provide to the island
fuel availability and energy price shocks.                    tourism sector.

In addition, although of less concern in the short term,      zz       Solar water heating (SWH)
environmental sustainability plays an important role in       zz       Solar air conditioning (SAC)
tourism. The less the environmental impact of a tour-         zz       Sea water air conditioning (SWAC)
ism activity, the longer that service can be available to     zz       Solar photovoltaic (PV) systems.
future tourists and also create revenue. Furthermore, as
tourists are becoming more aware about their environ-         These four RETs are evaluated considering their contri-
mental footprint, the demand for sustainable tourism is       bution to energy generation (for cooling, water heat-
growing.                                                      ing and lighting), the investment required, as well the
                                                              cost savings and benefits they create. Considering that
This report assesses the business case for the deploy-        the cost of fossil fuel imports in most islands results
ment of Renewable Energy Technologies (RETs) in               in commercial electricity tariffs that are higher than
island tourism. A systemic approach is adopted for            the global average (in the range of USD 0.33/kWh to
the analysis of the challenges and opportunities in the       USD 0.44/kWh in islands, against USD 0.26/kWh in
energy and tourism sectors, with consideration of the         European Union member states), these technologies
potential synergies that renewable energy deployment          can be economically attractive, generating considerable
strategies can create with other sectors key to the           cost savings. SWH systems offset or replace the cost of
socio-economic development of islands.                        electric water heaters, SAC and SWAC systems lower or
                                                              eliminate diesel-based heating and cooling services, and
High energy prices have several direct and indirect im-       PV systems reduce or eliminate the cost of electricity
pacts on the profitability of the tourism sector, which       from national utilities or onsite diesel generation. In ad-
also affect the social and economic development of            dition, RETs provide stable power generation costs that
islands and SIDS. Tourism operators make use of elec-         increase resilience and reduce vulnerability of island
tricity for cooling, water heating, lighting and other key    economies, and create a more conducive investment
services provided in hotels and resorts. Energy is also       environment. As an added value to tourism operators,
used for transportation and for food preparation. To          RETs improve branding by showcasing (sustainable)
compensate for increasing energy costs, tourism com-          facilities and activities, and by reducing environmen-
panies operating in islands are forced to raise the price     tal degradation (e.g., air and water pollution), both of
of accommodation and transport services. This often           which respond to the growing demand for ecotourism.

                                                             Re n ewa b l e E n e rg y O p p o r t un it ie s fo r I sl a n d Tou rism   3
Despite the advantages of RETs, their deployment in ly to reach 1.8 billion by 2030 (UNWTO, 2012).1 Accord-
island tourism faces several barriers: ing to the World Travel & Tourism Council, the tourism
sector contributes to one in every eleven jobs worldwide
zz Competitiveness of RE options (technical and (WTTC, 2012). Tourism represents a key driver of global
economic barriers) economic growth, and is a crucial component of the ef-
zz Access to capital and cost of financing (owner- fort to alleviate poverty and achieve the other develop-
ship and financial barriers) ment objectives in many developing countries.
zz Institutional and technical capability (knowledge
gaps). On the other hand, the approach adopted for tourism
development largely influences the sustainability of
Four main policy tools are available to create the re- the sector; intensive use of resources, high amounts
quired enabling conditions to overcome the barriers of waste generation, growing negative impacts on lo-
mentioned above: cal terrestrial and marine ecosystems, and mounting
threats to local cultures and traditions represent the
zz Capital investment main challenges faced by tourism worldwide (UNEP,
zz Incentives (such as tax reductions) 2011). In particular, the intensive use of energy in tourism
zz Public targets mandated by law is a serious concern for the long-term economic, social
zz Institutional and technical capacity building. and environmental sustainability of the sector, as many
tourism-based economies rely heavily on fossil fuels for
This report discusses these policy tools and best prac- energy supply, resulting in the tourism sector’s contri-
tices in detail, including new leasing models for RETs, bution of about 5% of global greenhouse gas (GHG)
such as the 2013 partnership between Starwood Hotels emissions (75% of which is due to travel and 21% to
& Resorts Worldwide and NRG Energy, and the net accommodation, air conditioning and heating systems)
metering policies and variable-accelerated depreciation (UNEP, 2011). In particular, it is estimated that the hotel
implemented by the Virgin Islands Water and Power sector’s contribution to global warming includes annual
Authority (WAPA) in the Virgin Islands, and by Grenada emissions of between 160 and 200 kg of CO2 per square
Solar Power Ltd (GRENSOL) in the Eastern Caribbean. metre of room floor area (Hotel Energy Solutions, 2011).
This report also details input received from island tour- Most of the energy consumption in the tourism sector
ism stakeholders and includes relevant case studies for is attributable to transport and accommodation, which
deployment of RETs. account for 75% and 21% of sectoral GHG emissions,
respectively (UNEP, 2011). Using renewable energy, ef-
ficient technologies and sustainable practices in avia-
1.1 Energy trends in the tourism tion, road transport and accommodation design and
sector and in Small Island operations are key in order to mitigate climate change
impacts in tourism. For example, one tourist travelling
Developing States on a one-week holiday from Amsterdam to Aruba would
require energy consumption of between 21 and 30 Giga-
1.1.1 Global energy trends in the tourism joules (GJ), of which 20 GJ would correspond to flight
sector energy use (potentially declining to 4 GJ with the use
of biofuels), while hotel energy use would fall in a range
Considering direct and indirect impacts, tourism ac- between 1 and 10 GJ, depending on hotel size and cate-
counts for approximately 9% of global gross domestic gory. As stated by UNEP’s Green Economy Report, high
product (GDP) – tourism is a major contributor to GDP energy consumption for tourism transport and accom-
in SIDS, reaching 45.5% in Aruba and 47.4% in Maldives modation is mainly due to the growth in international
(Hampton & Jeyacheya, 2013). In many developing and domestic travel, combined with the increasing use
countries, tourism is a key source of local employment of energy-intensive transport modes. In particular, over
opportunities and contributes to poverty eradication. At
the global level, it is estimated that international tourist 1 http://media.unwto.org/en/press-release/2012-01-16/
arrivals surpassed the 1 billion mark in 2012, and are like- international-tourism-reach-one-billion-2012
4 R e newa ble Energy O ppor t u ni t i e s for Is l and To urismFigure 1. Inbound tourism by mode of transport. Global average (left), SIDS (right)
Water
Road 41%
40%
Air Air
52% 59%
Rail 2%
Water 6%
Source: (UNWTO, 2013)
Figure 2. Breakdown of energy use for an average hotel.
General Other, 3.9%
equipment, 5.4%
Hot water &
laundry, 5.5%
Pool pumps,
7.4%
Guestroom Air
equipment, conditioning,
7.4% 48.2%
Kitchen &
refrigeration
equipment,
10.6%
Lighting, 11.5%
Source: (CHENACT, 2012)
half of all travelers prefer to arrive at their destination by water and rail transport decreased from 11% to 8% over
air, or choose destinations most easily reached by plane the same period (UNWTO, 2008; UNWTO, 2013).
(Figure 1). In fact, the global share of tourism traveling
by air grew from 42% to 52% between 2007 and 2012, The use of energy in hotels and resorts, e.g., for heating
and the share is naturally higher in the case of island and cooling, lighting, cooking, cleaning, ranges between
tourism.2 On the other hand, road travel for tourism 25 and 284 MJ per guest per night (UNEP, 2011). Overall,
purposes experienced a slight decline between 2007 the weighted global average of energy consumption
and 2012, going from 42% to 40% of total travel, while for international tourism activities is estimated at 135
MJ per guest per night (UNEP & UNWTO, 2012). The
drivers of energy use in the accommodation sub-sector
2 For example, tourist arrivals by air in 2012 accounted for 97% of
total arrivals in Fiji, 96% in Grenada and 98% in Mauritius (UNWTO,
vary considerably depending on the geographical area
2014). and the size of the hotel. In the Caribbean, for example,
Re n ewa b l e E n e rg y O p p o r t un it ie s fo r I sl a n d Tou rism 5Figure 3. Breakdown of electricity consumption in the hotel sector of Barbados, by hotel size.
Breakdown of electricity consumption in the hotel sector
100% 3% Miscellaneous
7% 2%
11% 6%
9%
21% 14% Office Areas Equipment
9% 13%
80% 4%
2% 11%
11%
Hot Water
10% 10%
19%
4%
31% Pumps
60% 8% 12% 15% 4%
Kitchen
14%
8%
40% Laundry
9%
2%
Guest Rooms Equip. & Lighting
9%
20% 39% 50% 50% 54%
Lighting
19%
Air Conditioning
0%
Very Small Medium Large Very
small large
Size of Hotel
Source: (CHENACT, 2012)
the main driver of energy consumption in hotels is 1.1.2 Energy and tourism trends in SIDS
air conditioning (48%), followed by lighting (11.5%),
refrigeration (10.6%), guestroom equipment (7.4%) and In the last decades, islands have gradually adopted
pool pumps (7.4%), as shown in Figure 2 (CHENACT, tourist activity as one of their development mainstays.
2012). In the case of Barbados, air conditioning is the Nowadays, if we take into account the total number of
main driver of electricity consumption, being responsible tourists, islands represent the second largest ensemble
for about 50% of total energy use in medium to large of tourist destinations in the world, after the block made
hotels, and 39% in small hotels. Water heating is instead up by big cities and historical towns.
the main driver of energy consumption in very small
hotels (Figure 3). Globally, hotels and resorts use up Tourism is a key sector for most SIDS. As an example,
to 50% of their energy consumption for heating and international tourism receipts contributed to 51% of the
cooling, followed by water heating and cooking (Beccali, total value of exports of SIDS in 2007 (Figure 4), com-
La Gennusa, Lo Coco, & Rizzo, 2009). This is also pared to 10% in other developing countries (UNDESA,
due to low energy efficiency and high energy waste, 2010).
which account for a large share of final consumption,
thereby leaving room for considerable improvements Tourist arrivals in SIDS have increased by almost 32%
and savings (UNEP & UNWTO, 2012). According to over the last decade, going from 22.9 million in 2000 to
the World Economic Forum, improvements in energy 30.19 million in 2010. However, the performance of the
efficiency and reductions in carbon emissions in the tourism sector in SIDS lagged behind the global trend,
accommodation sub-sector are primarily targeting the which grew by 39.3% over the same period (Figure 5)
use of existing technologies and practices, such as (UNWTO, 2012).
insulation, efficient lighting and appliances, change
in room temperatures and increased awareness by Figure 6 shows that the average share of renewable
consumers, but also include renewable energy use energy (including hydro) in total final energy consump-
(WEF, 2009). tion of SIDS has declined between 2000 and 2009,
6 R e newa ble Energy O ppor t u ni t i e s for Is l and To urismFigure 4. International tourism receipts in SIDS (% of total export and GDP).
International tourism receipts as percentage of total exports and GDP (2007)
100
90 Share of Exports Share of GDP
80
70
60
50
40
30
20
10
0
Sin ad a
Su a
Tri ame
Do e
Sa inica
Ha ome epu
Gu
Ma a
Be itius
Se
Ja elle
To
St. ua a
St. tts a Bar
Do ncen Nev da
Fij inica nd t
Gr mas
B a da
An dos
Ca atu
Ba Ver
St. ives
Va cia
Sa
Ma a
ma s
en
ng
i
yc
oT nR
nid
mo
rin
nu
pe
rb
ha de
liz
iti
ya
tig
m
m
ur
ld
ga
Ki
Vi
Lu
h
a
a
n
i
po d To
ca
re
nd bu
nd
n
t a is
an blic
dP
ba
rin
he
go
cip
Gr
e
en
ad
ine
s
Source: (UNDESA, 2010)
Figure 5. Tourist arrivals in SIDS, total and as share of world tourist arrivals.
35 4.0%
30 3.5%
3.0%
25
2.5%
20
2.0%
15
1.5%
10
1.0%
5 0.5%
0 0.0%
2000 2005 2006 2007 2008 2009 2010
Tourist arrivals (million) Arrivals in SIDS as % of world
Adapted from: (UNWTO, 2012)
Re n ewa b l e E n e rg y O p p o r t un it ie s fo r I sl a n d Tou rism 7Figure 6. Average renewable energy consumption in SIDS, including hydro (% of TFEC).
18%
17%
16%
15%
14%
13%
12%
11%
10%
2000 2001 2002 2003 2004 2005 2006 2007 2008 2009
Renewable energy consumption (% in TFEC)
Data from World Bank SE4ALL
going from about 17.6% to 14.6%. This indicates that Given the economic, social and environmental impacts
energy needs of SIDS increased at a faster pace than of fossil fuel imports, governments of SIDS have ex-
their deployment of RETs. As a result of the continued pressed interest in shifting towards a low-carbon econ-
reliance of SIDS on the use of imported fossil fuels, their omy by increasing investments in renewable energy
economies, including the tourism sector, are particularly and energy efficiency, as well as by establishing sound
vulnerable to energy price variability. In particular, with regulatory and policy frameworks for sustainable tour-
the rise of oil prices over the last few years, fuel import ism. Examples of the adoption of RETs do exist. In the
bills currently represent approximately 20% of annual Caribbean, examples include: a 20 MW PV system an-
imports for 34 of the 38 SIDS countries,3 and between 5 nounced by the Dominican Republic; investments in
and 20% of their GDP.4 the construction of several wind farms in Aruba and a
20 MW wind capacity investment announced by Haiti;
Pacific islands, for example, are reliant on fossil fuel 160 MW of geothermal capacity addition planned in
imports for 95% of commercial energy use. High im- Saint Kitts and Nevis; and the advanced development
port costs result in very high electricity tariffs, which of SWH systems in Barbados (Shirley & Kammen, 2013;
averaged USD 0.44/kWh for commercial users in 2010 IRENA, 2012a; IRENA, 2012b). In the Pacific, Fiji is using
(IRENA, 2013a). UNDESA estimated that an increase hydropower extensively (over 200 MW of capacity)
of USD 10 in average crude oil price produces a 1.5% and promoting the installation of PV systems (more
decrease in GDP in Pacific SIDS (UNDESA, 2010). As than 3,000 SHS installed in 2012); Palau has 540 KWp
a result, seven Pacific island states are ranked by the of grid-connected solar PV systems; and the Federated
Asian Development Bank among the ten economies States of Micronesia have planned the conversion of
most vulnerable to oil price volatility in the Asia-Pacific outer island diesel generators to mini-grid solar systems
region (ADB, 2009). by 2014 (IRENA, 2013a). In the Indian Ocean, solar PV
micro-power stations are being installed in villages in
Comoros, while Mauritius is increasingly investing in
3 38 SIDS are UN member countries, while another 19 are Non-UN
Members or Associate Members of the Regional Commissions the use of commercial biomass, to the point that 15%
4 http://sidsenergy.wordpress.com/tag/wave/ of its energy requirements are being met from bagasse
8 R e newa ble Energy O ppor t u ni t i e s for Is l and To urismderived from the production of sugarcane (UNDESA, renewable energy is considered to be part of the tourist
2010). At the Rio+20 Conference in June 2012, Heads attraction.6
of State formally adopted the 10-Year Framework Pro-
gramme on Sustainable Consumption and Production RETs could address existing challenges and turn them
(10YFP), a global action framework to enhance interna- into opportunities by lowering the cost of energy and
tional cooperation to accelerate the shift towards sus- guaranteeing stable generation costs. This in turn would
tainable consumption and production patterns in both increase the profitability of the tourism sector, support
developed and developing countries. Due to its increas- environmental preservation, and improve the contribu-
ing economic importance, sustainable tourism (includ- tion of the sector to the socio-economic development
ing ecotourism) has been recognised as a key vehicle of SIDS.
for sustainable development and has been integrated
as one of the five initial programmes under the 10YFP. Figure 7 compares the cost of electricity generation
Finally, 30 SIDS have joined the SIDS DOCK, a collective in islands for a variety of RETs with that of diesel-fired
institutional mechanism created in 2012 to support the generators. Electricity costs are currently high in most
transition towards sustainable energy in SIDS, in line SIDS, generally above USD 0.33/kWh in islands, and up
with the UN Secretary-General’s Sustainable Energy for to more than USD 1/kWh in particularly small islands
All (SE4All) initiative. (e.g., Levanzo in Italy and remote outer islands in the Pa-
cific) against USD 0.26/kWh in European Union mem-
ber states, as result of several related factors, including
1.2 An opportunity for the tourism (IRENA, 2013a):
sector to increase profitability
zz Long distance from major oil refining and distri-
and reduce socio-economic bution hubs;
vulnerability zz Lack of modern port facilities on some islands;
zz Lack of fuel storage facilities on smaller islands,
SIDS are highly reliant on fossil fuels for their energy mainly due to their limited size and economic
supply. Tourism represents an important economic resources;
driver for SIDS economies, and is at the same time highly zz High costs of diesel-based power generation,
dependent on a reliable, affordable and environmentally also due to the use of outdated technology.
friendly energy supply. As a consequence, this makes
SIDS’ tourism, and SIDS’ economies, vulnerable to However, the deployment of RETs in island tourism still
changes in fuel import prices. Further, recent trends faces a variety of barriers, which can be summarised in
show that global spending on ecotourism has increased three main categories:
by 20% every year in the past few years (TEEB, 2009);
6% of international tourists pay extra for sustainable (1) Competitiveness of renewable energy options
tourism options; and 25% would be willing to pay (technical and economic barriers);
more for environmentally friendly destinations (WEF, (2) Access to capital and cost of financing (owner-
2009). In the case of Crete, Greece, a survey showed ship and financial barriers); and
that 86% of the respondents would prefer to stay in (3) Institutional and technical capacity (policy and
hotels equipped with RETs, and 75% of them would be knowledge gaps).
willing to pay higher fees for staying in a hotel with RETs
installed (Tsagarakis, Bounialetou, Gillas, Profylienou, These barriers will be discussed in detail in section 3 of
Pollaki, & Zografakis, 2011). According to Tripadvisor,5 the report.
to stay at an environmentally friendly hotel, 25% of
tourists are willing to pay a 5-10% premium, and 12% are Moreover, climate change is already having a negative
willing to pay a 10-20% premium. This is also confirmed impact on natural capital and ecosystems, on which
by the case of the Lady Elliot Island Eco Resort in the island tourism extensively relies (Millennium Ecosystem
Great Barrier Reef World Heritage Site, Australia, where
6 For more information, see http://195.76.147.227/renforus/
5 http://www.tripadvisor.com/PressCenter-i134-c1-Press_Releases.html site/?p=2783
Re n ewa b l e E n e rg y O p p o r t un it ie s fo r I sl a n d Tou rism 9Figure 7. Typical Levelized Cost of Electricity ranges with weighted average for 2013. Graphs assume a 10%
cost of capital.
0.60
0.50 Diesel-fired electricity cost range
LCOE in (USD2012 /kWh)
0.40
0.30
0.20
0.10 Fossil fuel-fired electricity
cost range in OECD
0.00
Onshore wind
Offshore wind
CSP
Solar PV: large
Solar PV: small
Biomass
Hydro Small
Hydro Large
Geothermal
Onshore wind
CSP
Solar PV: large
Solar PV: small
Biomass
Hydro Small
Hydro Large
Geothermal
OECD Non-OECD
Source: (IRENA, 2014)
Assessment, 2005; IPCC, 2007). A study conducted by Regional organisations and national governments are
UNDP estimated that sea-level rise of 1 metre is likely increasingly aware of the challenges fossil fuel-depend-
to compromise the activities of 266 out of 906 tourism ent energy production poses to the long-term profit-
resorts and 26 out of 73 airports in the Caribbean, and ability and environmental sustainability of the island
that 49% of tourism resorts in the Caribbean Community tourism sector (IRENA, 2012c; AOSIS, 2012). The com-
(CARICOM) would be damaged by extreme weather mitment of island nations to increase renewable energy
events and coastal erosion (Simpson, et al., 2010). penetration and reduce energy waste through energy
In particular, costal and marine ecosystems provide efficiency improvements is demonstrated by the nu-
services to the tourism sector in islands, including merous policies and strategies that have been adopted
healthy reef attractions, sheltered beaches, protection for the enhancement of energy security (see Annex III).
of infrastructure from extreme weather events such as However, there is still much to be done in order to ac-
storms and floods, as well as provision of fish and other celerate the transition to renewable energy and reduce
seafood. The progressive reduction of these essential dependency on fossil fuel imports.
services caused by climate change-related phenomena
– coastal erosion, sea-level rise, coral bleaching, Building on these considerations, the following section
changes in fish species, alteration of mangrove and reef analyzes the main technology options available for
ecosystems, reduced rainfall and the likelihood of more renewable energy deployment in island tourism facili-
frequent and more intense seasonal storms – is reducing ties. Subsequently, the main barriers to a transition to
the attractiveness of island tourism destinations. renewable energy are discussed, together with enabling
Extreme weather events are increasing in frequency conditions and best practices. Finally, several case stud-
due to climate change, which creates the perception ies are proposed where challenges were turned into
that islands are risky tourism destinations. opportunities for the island tourism sector.
10 R e newa ble Energy O ppor t u ni t i e s for Is l and To urism2 TECHNOLOGY ASSESSMENT:
INVESTMENTS, AVOIDED COSTS AND
ADDED BENEFITS
Most island tourism energy needs are fulfilled through USD 300/kW for SWH, USD 1,800/kW for SAC,
technologies powered by diesel based electricity. The USD 3,750/kWp for solar PV, and USD 4,000/kW for
high cost of fossil fuel imports in most islands results SWAC. The payback period of each technology depends
in commercial electricity tariffs that are higher than the on a number of factors, such as the amount of energy
global average. In 2012 the average electricity price was consumed by hotels and the availability of renewable
USD 0.33/kWh in Caribbean islands,7 USD 0.43/kWh8 resources (e.g., solar radiation). In general, several case
in Hawaii and USD 0.33/kWh in Mauritius.9 In 2010 studies show that renewable energy investments in
the electricity price in Pacific Island Countries ranged island hotels have a payback period between 1 and 11
between USD 0.39 and 0.44/kWh for both households years.
(200 kWh/month) and commercial users (500 kWh/
month) (IRENA, 2013a). This is in comparison to an av- In addition to the economic benefits directly derived
erage price of about USD 0.26/kWh in European Union from reduced energy costs, the transition to renewable
member states, and USD 0.09/kWh in China and Can- energy will bring additional gains from the increased
ada (European Commission, 2014). Since electricity is attractiveness of sustainable hotel businesses in the
intensively used in hotels and other tourism facilities for eyes of eco-friendly travelers, whose choices are largely
basic services such as air conditioning, lighting, cooking driven by hotels’ sustainability practices. Also, the well
and heating, the island tourism sector faces difficulty being of island communities will be improved through
competing with the majority of non-island destinations, the reduction of air pollution from fossil fuel combus-
which have much lower energy costs. tion, as well as the creation of additional employment
opportunities for the installation and maintenance of
In response to this challenge, island hotels are RETs. Encouraging global trends are being observed,
increasingly investing in RETs, which, thanks to with potential also for job creation in SIDS, as the num-
declining costs, are now cost-competitive in most island ber of people directly and indirectly employed in the
contexts compared to the high price of fossil fuel- renewable energy sector grew by 14% between 2010
based electricity (IRENA, 2013a; IRENA, 2012d; IRENA, and 2011 (REN21, 2012; REN21, 2013).
2012e). The levelized cost of electricity (LCOE) of SWH,
SAC, solar PV and SWAC systems in islands ranges Overall, the shift to renewable energy production in
between USD 0.04 and 0.26/kWh. The average upfront island tourism facilities implies the adoption of a new
investment for these technologies varies depending investment model that takes into account the short-,
on several factors, including the materials used, medium- and long-term financial returns from fuel sav-
resource availability, and the distance of the island from ings and from access to the sustainable tourism market.
technology producers. Considering average costs for Moreover, renewable energy investments bring environ-
island settings, investments amount to approximately mental, social and economic benefits from a public sec-
tor perspective. Indeed, more secure and cleaner energy
7 http://blogs.iadb.org/caribbean-dev-trends/2013/11/14/the-carib-
in islands is expected to increase economic resilience,
bean-has-some-of-the-worlds-highest-energy-costs-now-is-the- reduce expenditures on fossil fuel imports, improve air
time-to-transform-the-regions-energy-market/ quality, and create employment opportunities for the
8 http://www.hawaiianelectric.com/heco/Residential/Electric-Rates/
local population. This is where the interest of the private
Average-Electricity-Prices-for-Hawaiian-Electric,-Maui-Electric,-
and-Hawaii-Electric-Light-Company and public sectors come together to shape a more sus-
9 http://ceb.intnet.mu/ tainable future.
Re n ewa b l e E n e rg y O p p o r t un it ie s fo r I sl a n d Tou rism 11Text Box 1 – Required investment and the Levelized Cost of Electricity of renewable
energy technologies
High electricity prices, mainly driven by the cost of imported fossil fuels, negatively impact the competitive-
ness and profitability of island tourism activities. Consequently, investments in renewable energy production
in hotels and resorts located in islands are likely to generate positive returns, while reducing the vulnerability
of the sector to increases in fossil fuel prices.
Investments are needed for the purchase, installation and maintenance of RETs. To assess their viability
hotel owners and other operators should conduct a cost-benefit analysis to estimate the payback period of
alternative technology options, and to quantify expected returns in the short, medium and long terms. The
accurate estimation of the total costs associated with the adoption of renewable energy solutions in hotels
should consider a variety of factors, which often change depending on the country context. In general, the
key factors influencing the final investment costs include: quality of the technology chosen; transportation
cost from factory to hotel; ease of installation; complexity and duration of bureaucratic procedures (e.g., for
the import and installation of technologies); cost of import tariffs; and existing in-country knowledge (e.g.,
knowledge level of hotel personnel) regarding the installation and use of RETs (Hotel Energy Solutions, 2011b).
The levelized cost of electricity (LCOE), a measure of the overall competitiveness of energy technologies,
can be used to assess the economic viability of the investment. In particular, the LCOE method consists of
comparing the cost to install and operate an energy system and its expected life-time energy output. The
calculation is done using the net present value method, in which upfront capital investments and payment
streams over the technology’s lifetime are calculated based on discounting from a reference date (Kost, et
al., 2013). The cash values of all the expenditures are divided by the cash values of power generation, yielding
a final value measured in, for instance, USD/kWh. For this reason, the LCOE is increasingly used as a reliable
indicator for comparing different energy technologies.
A dedicated LCOE calculator was developed by IRENA in order to compare the competitiveness of RETs with
respect to diesel-powered systems in island tourism facilities. The tool allows the full customisation of renew-
able energy projects, including technology and financial assumptions. For illustrative purposes, the LCOE was
calculated for a set of renewable energy projects that might be suitable for island hotels. The technologies
assessed include roof mounted solar PV systems, SWH systems with 200 litres of capacity, SAC systems
powered with evacuated tubes, trough solar thermal collectors, and SWAC.
Assuming a solar radiation of 1,700 kWh/m2/year, the LCOE of these solar energy technologies is calculated
to be in the range of USD 0.04 – 0.26/kWh (see also Annex II for a detailed list of assumptions and additional
results). As presented in Figure 8 and 9, this value should be compared with the price of diesel-generated
electricity (e.g., the commercial electricity tariff in Fiji was USD 0.37/kWh in April 2014). More precisely:
zz Solar PV Rooftop: the LCOE of solar PV rooftop systems with a capacity factor of 18.5%, capital cost
of USD 3,750/kW, and fixed annual O&M costs of USD 25/kW is USD 0.262/kWh, or USD 72.65/GJ.
zz SWH: the LCOE of an SWH system with capacity of 200 litres, capacity factor of 16%, capital cost of
USD 300/kW, and fixed O&M costs of USD 30/kW is USD 0.042/kWh, or USD 11.68/GJ.
zz SAC: the LCOE of a SAC system powered with evacuated tubes, capacity factor of 30%, capital cost of
USD 300/kW for evacuated tubes and USD 1,500/kW for a single-effect absorption chillers, and fixed
O&M costs of USD 30/kW is USD 0.113/kWh, or USD 31.5/GJ.
zz SWAC: the LCOE of a SWAC system with a capacity factor of 100%, capital cost of USD 4,000/kW, and
fixed O&M costs of USD 80/kW is USD 0.055/kWh, or USD 15.39/GJ.
12 R e newa ble Energy O ppor t u ni t i e s for Is l and To urismFigure 8. Range of LCOE estimations for PV, SWH, SAC and SWAC, under different CAPEX assumptions,
compared to the business-as-usual solutions
350
1.2
300
1
250
0.8 Electric water heaters,
USD/kWh
based on island electricity
USD/GJ
Electricity price range in 200
price and 90% efficiency
islands (diesel generators) Electric chillers, based on Electric chillers, based on
0.6 island electricity price and island electricity price and
COP of 2.8 COP of 2.8 150
0.4
100
0.2 50
0 0
PV SWH SAC SWAC
Low CAPEX Medium CAPEX High CAPEX baseline
Figure 9. Range of LCOE estimations for PV, SWH, SAC and SWAC, under different Weighted Average
Cost of Capital (WACC) assumptions, compared to the business-as-usual solutions
350
1.2
300
1
250
0.8 Electric water heaters,
Electricity price range in based on island electricity
200
USD/kWh
islands (diesel generators) price and 90% efficiency
USD/GJ
Electric chillers, based on Electric chillers, based on
0.6 island electricity price and island electricity price and
COP of 2.8 COP of 2.8 150
0.4
100
0.2 50
0 0
PV SWH SAC SWAC
WACC 7.5% WACC 10% WACC 12% baseline
Re n ewa b l e E n e rg y O p p o r t un it ie s fo r I sl a n d Tou rism 132.1 Solar water heating systems is the key component of the SWH system as it converts
the sun’s radiant energy to heat. SWH systems can use
SWH systems use solar heat to warm domestic wa- a variety of solar collector types for capturing solar ra-
ter, offsetting the cost of gas/electric water heaters. diation, including unglazed flat plate, glazed flat plate,
The average investment required to purchase an SWH integral collector storage (ICS), evacuated tube, and
system in the islands is about USD 300/kW, and the parabolic trough. Hotels located in islands with high so-
payback period can be as short as a few months (e.g., lar radiation can use less expensive flat plate or evacu-
Turtle Beach Resort in Barbados) (Husbands, 2014). ated tube collectors for capturing solar radiation. Flat
The LCOE of an SWH system with capacity of 200 litres plate collectors consist of a single flat-plate absorber,
is USD 0.042/kWh in islands with good solar radiation while evacuated tube systems are composed of multi-
(1,700 kWh/m2). SWH systems are generally commer- ple evacuated glass tubes. Flat plates are generally less
cially available, and are already extensively used in expensive and require less maintenance than evacuated
tourism facilities on many islands, including the major- tubes. On the other hand, evacuated tubes minimise
ity of small Pacific islands (IRENA, 2013a), an increasing heat losses due to the insulating effect of the vacuum,
number of islands in the Caribbean (Barbados being and are particularly suited for cloudy, colder climates
the regional champion) (Shirley & Kammen, 2013), and with limited annual solar radiation. Figure 10 shows a
islands in the Indian Ocean, such as Mauritius (GoM, type of SWH system commonly used in island hotels,
2009). Nevertheless, there are still significant opportu- consisting of roof-mounted flat-plate solar collectors
nities for expansion. paired with a water heater/solar storage tank.
The main components of an SWH system include the There are two main classifications of SWH systems: “ac-
solar collector and the balance of system, which in- tive” and “passive.” Active systems use an electrically
cludes the collector-storage loop, the storage tank and, driven pump and an electronic controller to circulate
depending on system type, heat exchanger(s), pump(s), a heat transfer fluid between the collector and solar
auxiliary devices and/or controllers. The balance of storage when solar energy is available. Passive systems,
system and installation both generally cost more than including ICS and “thermosiphon” types, use no pumps
the collector (IRENA, Forthcoming 2014). The collector or controls, relying instead on water main pressure to
Figure 10. Schematic representation of a solar water heater. Source: Australian Government
Roof mounted hot water
Heated
storage tank
water
Roof mounted
solar collectors
Cold water Heater water to
inlet internal fixtures
14 R e newa ble Energy O ppor t u ni t i e s for Is l and To urismYou can also read