CLIMATE SUSTAINABILITY PLAN 2016-2020 - MACKAY WHITSUNDAY ISAAC - Reef Catchments

Page created by Tracy Wheeler
 
CONTINUE READING
CLIMATE SUSTAINABILITY PLAN 2016-2020 - MACKAY WHITSUNDAY ISAAC - Reef Catchments
CLIMATE
SUSTAINABILITY
PLAN 2016-2020
M AC KAY • W H I T SU N DAY • I S A AC
CLIMATE SUSTAINABILITY PLAN 2016-2020 - MACKAY WHITSUNDAY ISAAC - Reef Catchments
Acknowledgments: Reef Catchments gratefully acknowledges report authors Robyn Bell and Cath Moran,
2016 Climate Sustainability Plan for the Mackay Whitsunday Isaac region 2016-2020.

Disclaimer: All information within this Climate Sustainability Plan © Reef Catchments. While every care
is taken to ensure the accuracy of the information included in this document, Reef Catchments make no
representation or warranties about their accuracy, reliability, completeness or suitability for any particular
purpose and disclaims all responsibility and all liability for all expenses, losses, damages which are incurred as
a result of this product being inaccurate.

Image: Katherine Sellers, runner-up Reef Catchments Coastcare photo competition 2016.
CLIMATE SUSTAINABILITY PLAN 2016-2020 - MACKAY WHITSUNDAY ISAAC - Reef Catchments
TABLE OF CONTENTS
EXECUTIVE SUMMARY_______________________________________________________________________________ 1

CHAPTER 1 Project Background_________________________________________________________________________ 2

CHAPTER 2 The participatory planning process____________________________________________________________ 5

CHAPTER 3 Climate change projections for the MWI NRM region_____________________________________________ 9

CHAPTER 4 Climate vulnerability in the MWI NRM Landscape_______________________________________________ 20

CHAPTER 5 Potential adaptation options for the MWI NRM region____________________________________________ 38

CHAPTER 6 Regional priorities for biodiversity and carbon in a changing climate________________________________ 45

CHAPTER 7 Strategies for action_______________________________________________________________________ 59

CHAPTER 8 Implementation of the Climate Sustainability Plan_______________________________________________ 70

REFERENCES______________________________________________________________________________________ 73

GLOSSARY________________________________________________________________________________________ 76

APPENDIX 1 Outputs Climate Futures Tool analyses from SILO Data Drill and historical seasonal data_______________ 78

APPENDIX 2 Supporting documents to Reef Catchments’ Climate Sustainability Plan____________________________ 81

                                                                     iii
CLIMATE SUSTAINABILITY PLAN 2016-2020 - MACKAY WHITSUNDAY ISAAC - Reef Catchments
We gratefully acknowledge the contributions that many regional stakeholders have made in the development of this plan.
We also acknowledge important input from Reef Catchments staff, as well as CSIRO and James Cook University partners.
Development of this plan was supported by funds from the Australian Government’s NRM Planning for Climate Change
fund, as well as the National Landcare Programme.

                                                                   iv
CLIMATE SUSTAINABILITY PLAN 2016-2020 - MACKAY WHITSUNDAY ISAAC - Reef Catchments
EXECUTIVE SUMMARY
Development of this Climate Sustainability Plan was supported by the Australian Government’s NRM Planning for Climate
Change fund. Reef Catchments was tasked with identifying priority areas for achieving carbon sequestration and biodiversity
benefits in the context of climate change. It was expected that this would be based on collaboration with scientists and
engagement with regional stakeholders.

This Plan sets out the most recent and regionally specific projections for rainfall, temperature, sea level rise and other climatic
changes. The science shows us that while average climate patterns may not change dramatically in the Mackay Whitsunday
Isaac (MWI) region, extreme events are likely to become more intense and more frequent. The MWI region is already subject to
flooding, storm surge and cyclones which incur significant economic and social costs.

This Plan takes a preliminary look at likely impacts and potential adaptation opportunities associated with climate changes.
Specifically, this Plan considers issues around the availability and supply of fresh water, sustainability of industries, maintenance
of healthy communities, the protection of natural systems and management of invasive species.

Natural systems have the least capacity to adapt to projected climate changes, meaning that particular effort will be needed
to protect plants, animals and their habitats in the region. The supply of fresh water is also likely to be seriously challenged by
increased evaporation, changes in rainfall and sea level rise. All of the regions’ communities and industries will be impacted,
requiring substantial changes in production, management practices, emergency services, and even the location of some human
settlements.

This Plan documents strategies and specific actions, identified through extensive consultation with regional stakeholders, that
are aimed at adapting to these challenges. Implementation of these strategies and actions will require integration with other
strategies, programs and initiatives within Reef Catchments, with all levels of government, with industries, research organisations
and other stakeholder groups.

The current policy context is uncertain and complex, but there is substantial motivation across most sectors in the MWI region to
develop better understanding of the impacts of climate change, and to negotiate adaptation pathways that lead to a sustainable
future for the region. This Plan represents the first, important step in what will be an ongoing process of working together to
adapt to substantial and unprecedented change in our region.

                                                                            1
CLIMATE SUSTAINABILITY PLAN 2016-2020 - MACKAY WHITSUNDAY ISAAC - Reef Catchments
1
CHAPTER 1
Project Background
In 2012, the Australian Government committed $44 million         (MWI) NRM region is part of the Wet Tropics Cluster that also
to the Regional NRM Planning for Climate Change Fund             included the Wet Tropics (Terrain NRM), Cape York (Cape
(Australian Government, 2013). This funding was designed         York NRM) and the Torres Strait region (Torres Strait Regional
to support regional Natural Resource Management (NRM)            Authority -TSRA).
groups throughout Australia to update their NRM plans using
new regionally synthesised science products. These products      Projects to support the planning process included:
support adaptation responses to climate change and guide
climate change program actions and impacts on-the-ground,        •   Delivery of Climate Projections (CSIRO/ Bureau of
and maximise the environmental benefits of carbon farming            Meteorology) specific to the eight clusters (Figure 1.1)
projects (Bohnet et al., 2013; Australian Government, 2013).
                                                                 •   AdaptNRM. Tools and resources to support climate
Two streams of funding were provided under the program:              adaptation planning which has delivered modules on
Stream 1 to support regional NRM organisations across                planning, weeds, and biodiversity http://adaptnrm.csiro.
Australia to update their NRM plans for adaptation to climate        au/about-adaptnrm/
change impacts. Stream 2 supported coordination of research
(Parts A and B) to develop scientific information on climate     •   Terranova. A central long-term data repository hub for
change at the national and regional level, and to generate new       access to all research, tools and resources developed
knowledge and tools required to develop new adaptive                 through the program https://terranova.org.au/about
NRM plans.
                                                                 •   Regional research support. The MWI NRM region has
Australia’s 56 NRM regions were grouped into eight clusters          been a part of the Wet Tropics Cluster supported through
based on broad similarity in climate, landscape and socio-           James Cook University and CSIRO.
economic characteristics through which the research was
delivered (see Figure 1.1). The Mackay Whitsunday Isaac
                                                                                   Mackay
                                                                                   Whitsunday Isaac
                                                                                   NRM region

                                                                                 Figure 1.1 Clusters for delivery of climate
                                                                                 projections and location of the Wet Tropics
                                                                                 cluster and Mackay Whitsunday Isaac NRM
                                                                                 region.

                                                                     2
CLIMATE SUSTAINABILITY PLAN 2016-2020 - MACKAY WHITSUNDAY ISAAC - Reef Catchments
Wet Tropics Cluster                                                   Developing Reef Catchments Climate
co-research approach                                                  Sustainability Plan
The James Cook University (JCU) and CSIRO research                    Reef Catchments commenced updating their NRM Plan
consortium used a co-research approach to delivering the              prior to release of the Stream 1 funding, and it was released
project Knowledge to manage land and sea: A framework for             in February 2015. The completed MWI NRM Plan contains
the future in the Wet Tropics Cluster. The co-research approach       agreed outcomes and management actions for protecting and
undertaken in the Wet Tropics Cluster brings together                 restoring the region's natural assets. This Climate Sustainability
researchers with different scientific backgrounds as well as          Plan supports updates to the MWI NRM Regional Plan (Reef
NRM planners and managers from the four NRM agencies                  Catchments, 2014a) which identifies climate change as one
to make collaborative decisions about research direction,             of the region’s issues. A number of the outcomes from the
the allocation of project resources, and long-term science-           stakeholder engagement process (see Chapter 2) that have
planning partnerships in the region. Central to the approach          been used to develop this Plan were incorporated into the
was the establishment of a Brokering Hub with representatives         NRM Regional Plan, but are further developed into specific and
from research and practice disciplines (Figure 1.2). This             spatially explicit priority actions.
co-research approach draws on the growing evidence that
transdisciplinary research methods are of critical importance         The process used in development of the Climate Sustainability
to solving sustainability problems and achieving climate              Plan acknowledged that climate change is not the only change
adaptation (e.g. Jahn et al., 2012; Lang et al., 2012).               the regional community is experiencing. This approach is also
                                                                      consistent with that of the Intergovernmental Panel for Climate
The Brokering Hub consisted of two project co-leaders                 Change (IPCC). The 2007 IPCC AR4 synthesis examined
(CSIRO and JCU), a project Knowledge Broker who                       coping range, adaptive capacity and vulnerability of various
coordinated and managed the activities of the Wet Tropics             sectors in the Australian and New Zealand context (Figure 1.3).
Cluster, representatives from each of the four regional NRM
agencies, researchers representing three science nodes and
the national project team. The three science nodes were: (1)
science synthesis, (2) participatory scenario and knowledge
integration, and (3) prioritisation and opportunities (Figure 1.2).

Figure 1.2. Co-research approach that promoted through collaboration and co-research, in the formation of
the Wet Tropics cluster (Source: Bohnet et al., 2013).

                                                                             3
CLIMATE SUSTAINABILITY PLAN 2016-2020 - MACKAY WHITSUNDAY ISAAC - Reef Catchments
Figure 1.3 shows that natural ecosystems are identified as        available information (Principle iii., above). While there are
having the highest vulnerability and least capacity to adapt      some stakeholders who did not engage in the process, wide
to ongoing temperature change. Water security and coastal         representation from a diversity of stakeholder groups was
communities (such as the MWI NRM region) are also highly          achieved. The plan identifies priority landscapes for carbon
vulnerable in this context. Impacts on other sectors are also     plantings and strategies to build landscape integrity (consistent
likely to be serious, but in many cases, their vulnerability is   with principle i., above; described in Chapter 6). Transparency
lower and adaptive capacity higher.                               has been achieved through the presentation and discussion
                                                                  of scientific information in a range of freely-available formats,
Consistent with the Australian Government’s NRM Planning          as well as the documentation of results from engagement
for Climate Change program, Reef Catchments’ Climate              processes, and circulation of workshop reports to participants.
Sustainability Plan has been developed using the following
three key NRM planning principles:                                Many concerns were expressed about gaining effective
                                                                  engagement during the project, due to changes in policy and
i.	Plans identify priority landscapes for carbon plantings       the resulting uncertainty among stakeholders in relation to
    and strategies to build landscape integrity and guide         State and Federal government commitment and support. This
    adaptation and mitigation actions to address climate          was compounded by portrayal of uncertainty in the media
    change impacts                                                around the validity of climate change science and potential
                                                                  negative impacts on the economy. In an attempt to address
ii.	Planning process is logical, comprehensive and               these barriers to engagement around issues relating to climate
     transparent                                                  change, the process acknowledged that 'climate change is
                                                                  not the only change society is experiencing’. Engagement
iii.	Plans use best available information to develop actions     focused on the key drivers of change that impact on the
      and are based on collaboration with government,             regional community, providing a pathway for stakeholders to
      community and other stakeholders                            develop priority strategies and actions that worked towards
                                                                  social, cultural, environmental and economic sustainability in a
The process used to develop this Climate Sustainability Plan      changing climate.
has been logical, comprehensive and transparent (principle ii.,
above), using a participatory planning process to collaborate
with stakeholders and work with scientists. This has involved
an iterative process of different forms of engagement with
government, community and other stakeholders, as well
as collaboration with scientists to develop and access best

Figure 1.3 Coping range, adaptive capacity and vulnerability of issues in the Australian and New Zealand context
(Source: Adapted from IPCC 2007a Figure 11.4)

                                                                      4
CLIMATE SUSTAINABILITY PLAN 2016-2020 - MACKAY WHITSUNDAY ISAAC - Reef Catchments
2
CHAPTER 2
The participatory planning
process
This chapter provides an outline of the participatory processes
used to develop Reef Catchments’ Climate Sustainability Plan.
These processes emphasised participation from Traditional
Owners, a wide range of regional NRM stakeholders and
Reef Catchments staff. This process aimed to record their
aspirations and values as well as to develop practical strategies
and actions. The process also involved partnership with
scientists, to ensure integration with community-led and
science-led priorities.

The supporting document to this Plan ‘Participatory Processes
used to support development of the Climate Sustainability Plan’
describes how the process was framed, how a wide range
of stakeholders were engaged in the process, and how best
available information was developed and incorporated into
the process (Appendix 3). This chapter provides a summary
of outcomes from the stakeholder workshops and other
engagement processes. Chapter 5 of this plan documents the
priority landscapes and strategies identified through these
processes.

Key events in the timeline of stakeholder engagement are
depicted in Figure 2.1, below.

              June 2013                                             June 2014                                June 2015
                                                                                                        e g or
                                p

                                                                                                                 m

                                                                                                                 p
                        ns

                                                                                                                 rt

                                                                                                                ps

                                                                                                                 n

                                                                                                                aff

                                                                                                                 rt

                                                                                                                  l

                                                                                                                 p

                                                                                                                 p

                                                                                                                  s
                                                                                                               oo

                                                                                                              TO
                                                                                                               io
                                  o

                                                                                                              ho

                                                                                                              ho

                                                                                                              ho
                                                                                                              po

                                                                                                              po
                                                                                                             ru

                                                                                                   Ir nf
                                                                                                               n
                     io

                               sh

                                                                                                            ho

                                                                                                             st

                                                                                                           sT
                                                                                                            eg

                                                                                                            io
                                                                                                           ks

                                                                                                          ks

                                                                                                          ks
                                                                                                           re

                                                                                                           re
                                                                                                          fo
                  ss

                                                                                               W io

                                                                                                          th
                            rk

                                                                                                        ks

                                                                                                         ts
                                                                                                        Ir

                                                                                                        re
                                                                                                       or

                                                                                             M at
                                                                                                     or

                                                                                                     or

                                                                                                     wi
                                      sis

                                                                                                       is
                cu

                                                                                                        c
                         wo

                                                                                                   en
                                                                                                   W
                                                                                                   or

                                                                                                    u
                                                                                                      i

                                                                                                 rw

                                                                                        in itis
                                                                                                  es
                                                                                                    l

                                                                                                  w

                                                                                                  w
                                                                                                  ut
                                                                                                ub
             is

                                    e

                                                                                                  p
                                                                                                M

                                                                                              hm
                                                                                              rw
                       ge

                                 th

                                                                                                h

                                                                                              ho
                                                                                            eF

                                                                                              er

                                                                                             ity
                                                                                                r
           yd

                                                                                               e

                                                                                   on io
                                                                                             nt
                                                                                              p
                                                                                           he

                                                                                            ld
                               yn
                   an

                                                                                         de

                                                                                            c

                                                                                          ld

                                                                                         ks
                                                                                rb pr

                                                                                           s
                                                                                          k

                                                                                         sy

                                                                                         at
                                                                                          o
        ar

                                                                                          t
                                                                                          t

                                                                                       er
                              ss

                                                                                      ris

                                                                                      Ca

                                                                                      ho
                 ch

                                                                                      eh

                                                                                      or
                                                                                      ol

                                                                                     im
                                                                                       n

                                                                             ca al
      in

                                                                                      n

                                                                                    iv
                                                                                   si

                                                                                 ew
                                      eh
                             ct

                                                                                 ke
                                                                                 tio
                                                                                  ak

                                                                          d ati
                                                                                   e

                                                                                 Cl
                of
      im

                                                                                 ef

                                                                                od
                                                                              isk

                                                                               at
                         pa

                                    ak

                                                                               st

                                                                               a
                                                                              ta

                                                                      an sp
                                                                             Re
                 s
   el

                                                                              &

                                                                             nc
                                                                             Bi
                                                                             st
                                                                            im
              er

                        m

                                                                           er

                                                                           ap
                                                                          ird
                                  st
 Pr

                                                                          ns

                                                                 it y o f

                                                                         cie
                                                                           r
           riv

                      ei

                                                                         th
                                                                         Cl
                                                                        at

                                                                        fo

                                                                         d
                                                                      Th
                                o

                                                                      tio

                                                               rs r y
                                                                     ea
                    at

                                                                     ur
       yd

                                                                     es
                               w

                                                                     m

                                                                     p

                                                          ive ive
                                                                  jec
                  im

                               tt

                                                                 Fo
                                        cli

                                                                 ho

                                                                  at

                                                                 at
     Ke

                             rs

                                                       o d el
                Cl

                                                              im

                                                               ro

                                                              im
                                        n

                                                            ks

                                                            D
                                      to
                         Fi

                                                          ep
                                                           Cl

                                                           Cl
                                                          or
                                  or

                                                       W

                                                       at
                                 p

                                                      m

                                                    bi
                              Re

                                                  cli
                                               al
                                             on
                                          gi
                                       Re

Figure 2.1 Indicative timing of major stakeholder engagement activities, together with the delivery of key
supporting resources and tools

                                                                            5
CLIMATE SUSTAINABILITY PLAN 2016-2020 - MACKAY WHITSUNDAY ISAAC - Reef Catchments
The conceptual framework for working through multi-stakeholder workshops is shown in Figure 2.2. Workshops predominantly
used 2030 as a target year to focus future-oriented discussion, though different time frames were also considered in
presentations and discussions, and climate change projections were characterised in terms of the 4.5 (business as usual) and 8.5
representative concentration pathways (RCP).

                     Values                                                                   Focal issues
                                                                                        What are the main risks and
      What do you like about the MWI region?
                                                                                      opportunities in the MWI region?

                                                Key drivers of change
                                                 What are the main influences of
                                                 conditions in the MWI region?

                                                         Strategies
                                                 What pathways will help avoid
                                              or minimise risks and take advantage
                                                        of opportunities?

                                                           Actions
                                               What specific actions could enable
                                                      priority strategies?

Figure 2.2 Conceptual framework for the multi-sectoral stakeholder workshop series.

Workshops achieved diverse, multi-sectoral stakeholder             •   Recreational fishers
representation, including:
                                                                   •   Steel Pacific Insurance Brokers.
•   Planning and emergency services staff from the
    Whitsunday, Mackay and Isaac Regional Councils                 Efforts were made also to engage with North Queensland Bulk
                                                                   Ports (NQBP), Regional Development Australia (RDA) and
•   Indigenous groups, i.e. the Yuibera Aboriginal Corporation     community health organisations. However these efforts were
    and Yuibera, Koinmerburra and Ngaro-Gia Traditional            not successful in gaining their involvement in the process.
    Owners;                                                        NQBP did participate in the community forum on climate risk.
                                                                   Workshop activities were intentionally designed to integrate
•   Agricultural industries, i.e. Cane growers, graziers, Plane    representation from different sectors. Information about priority
    Creek & Mackay sugar mills, AgForce, GrowCom; sugar            values, key threats and potential strategies was developed
    productivity services                                          during the workshop.

•   Tourism sector                                                 Outcomes of the participatory
                                                                   planning process
•   Mining (Anglo-American Coal)
                                                                   Reports provide more detail about the content and outputs
                                                                   of the various workshops (Bell et al., 2014a, b; 2015). These
•   Non-governmental organisations (NGO’s), i.e. Landcare,
                                                                   were circulated to stakeholder and researcher participants for
    Turtle Watch, Mackay Conservation Group, Community
                                                                   comment after the workshops. This section, identifies the key
    gardens
                                                                   values from the stakeholder workshops and the related drivers
                                                                   of change and key issues. Secondly, this section identifies the
•   Agriculture and Fisheries (QDAF), Department Natural           principles that emerged from the multi-sectoral stakeholder
    Resources and Mines (DNRM), Education Queensland and           engagement processes, together with those identified in
    The Department of State Development (SD)                       the supporting science. These principles are based on a
                                                                   combination of Values, Drivers of change and Focal issues
•   Great Barrier Reef Marine Park Authority (GBRMPA)              (see Figure 4.2 above).

•   Regional Development Australia

                                                                       6
A collective vision for the future
A range of values and focal issues were identified during stakeholder workshops. These are attributes that the stakeholders
either would like to preserve (values) or change (focal issues) as part of a preferred vision for the future. Together, these are key
elements of a collective vision for the future of the MWI region. Those that were agreed across multiple stakeholders included:

a.	The ‘sense of community’; small-town feel, non-commercialised; cultural and social diversity
b.	Resilient communities, including in relation to extreme weather
c.	Diversity of natural landscapes, e.g. reef and ranges
d.	Access to good services and infrastructure such as schooling, pools, airports
e.   Food security
f.   Water security
g.   Agreeable climate and weather.

Discussions during workshops identified the following four key drivers of change that are likely to have the most influence over
the collective vision for the future of the MWI region. These are:

Rapidly increasing population: it is projected that the current population will grow by 47% by 2031 (Binney, 2014). Much of the
recent increase is attributable to the mining ‘boom’ in the region. A major concern is the past and potential future loss of good
agricultural land (and hence, viability of some industries) from loss to urban/suburban development. Affects a)-f).

Community capacity: the MWI population in general is characterised by having relatively low levels of education but relatively
high income (Reef Catchments, 2104). This is attributed largely to the legacy of the mining industry in the region. Many
community organisations e.g. Landcare, depend on Volunteers but many of these are ageing. Also, large number of shift-workers
(especially, but not only, in mining industry) with limited capacity for community involvement. Existing processes for consultation
sometimes perceived as token. Apathy. Traditional Owners. Affects b) especially

Economic conditions: It is generally perceived that there is a lack of diversity in the region’s economy. Overall economic
conditions in the region are determined by the mining industry, with cyclical ‘boom-and-bust’ characteristics in mining and
related industries such as construction and retail, and a lack of strength in other sectors. The relative economic importance of
agriculture in the region has decreased, as has the availability of agricultural labour and this affects succession planning on farms.
It was also pointed out that mining has increased the rate base in the region, improved services and infrastructure, and created
new employment opportunities, though these have been shown to be transient with the recent downturn in resources. A major
impact of mining has been dramatically reduced affordability of housing Affects a)-f)

Climate change: It is well-recognised that the MWI region is already one of very high climate variability. The impact of projected
climate changes, particularly extreme events, will strongly affect the collective vision for the future of the region. Natural disasters
already have major impacts on the MWI region and small changes in the mean climate can dramatically increase the occurrence
of extreme events. Affects b), e)-g).

Note that the key drivers identified in multi-stakeholder workshops closely match those identified in the Brokering Hub workshop
(Section 1.i). In the stakeholder workshop, government policies are recognised as critical but, instead of being a separate driver
of change, were conceived as being embedded within each of the other drivers of change. In Table 2.1. key drivers of change are
shown, together with the elements of the collective vision they most influence, and the strategies identified for managing this
influence.

                                                                             7
Table 2.1. A summary of outputs from the multi-stakeholder workshop series. The seven basic elements of the collective vision
described for the MWI region are listed. Key drivers of change are shown in relation to the elements of the collective vision they most
influenced (unshaded areas). Related strategies are listed in the far right column.

 Key drivers of change                                                     Collective vision                       •   Related strategies

                                                                           The ‘sense of community’                •   Collaboration
                                                                                                                   •   Traditional Owner involvement
                                                                           Diversity of natural landscapes         •   Strategic planning
                                                                                                                   •   Biodiversity
                                                                           Access to services and infrastructure   •   Strategic planning
                                                                           Food security                           •   Strategic planning
                                                                                                                   •   Diversified industry
                                                                           Water security                          •   Strategic planning
                                                   Increasing population
                             Economic conditions

                                                                                                                   •   Diversified industry
                                                                           Resilient communities                   •   Collaboration
                                                                                                                   •   Community education
Community

            Climate change

                                                                                                                   •   Traditional Owner involvement
capacity

                                                                                                                   •   Strategic planning
                                                                                                                   •   Diversified industry
                                                                           Agreeable climate and weather           •   Strategic planning

In addition to the work done through multi-stakeholder workshops, the work conducted with Traditional Owners identified some
key issues of importance, including access to country, the importance of fresh water and wetlands, protection and conservation
of important cultural species and sites (e.g. fish traps and shell middens), camps on country and employment of the mob to look
after country, revegetation and replacement of important plants, and monitoring and reporting health of country. The mapped
climate risks are projected to increase with extreme weather events. The third stage was the involvement of the Traditional
Owners in the regional multi-stakeholder climate adaptation workshops where they presented some of the activities undertaken
in the project, highlighted the values they hold for country and the priorities issues they want to address.

 SUMMARY
 A large number of opportunities were provided to facilitate participation by stakeholders in the process of developing this plan.
 These included one-on-one meetings, focused work with particular groups or sectors and large, cross-sectoral stakeholder
 workshops. It has been particularly important that engagement with TO’s, respects and acknowledges their responsibility
 to land and sea country. In general terms, participatory processes centred on the identification of values and aspirations,
 development of understanding of key threats to these, and formulation of actions and strategies to address these threats. The
 outcomes of this process represent a solid starting point for further discussion about specific adaptation pathways for the
 MWI region.

                                                                                                         8
3
CHAPTER 3
Climate Change projections
for the MWI NRM region

Weather, Climate Variability
and Climate Change
The terms weather and climate are often used interchangeably;      with some summers hotter or wetter than others in different
however weather, climate variability and climate change refer      years and winters that may be cooler or drier in a certain year.
to different things in climate science. A brief explanation is     Climate drivers that influence climate variability are a result of
given below.                                                       interactions between the ocean and the atmosphere, e.g. the El
                                                                   Niño Southern Oscillation (ENSO) plays a large role in climate
The Weather experienced on a day-to-day basis is a result of       variability from year to year.
the constant changing state of the atmosphere. Weather is
characterised by the temperature, wind, rain, clouds and other     Climate change is a change in the state of the climate that can
weather elements (IPCC 2007a) such as cyclones. Typically,         be identified by changes in the mean and/ or variability of its
climate defines the average weather over a period of time,         properties, and that persists for an extended period, typically
generally a minimum of 20 years.                                   decades or longer (IPCC 2007b).

Climate Variability refers to the variability in general climate   The timescales on which weather, climate variability and
patterns that occur over time. The average climate of summer       climate change are shown in Figure 3.1.
is warmer than winter, but seasons vary from year to year

Figure 3.1 Time scales of weather, climate variability and climate change.
Source: http://www.pacificclimatefutures.net/en/help/climate-projections/understanding-climate-variability-and-change/

                                                                          9
Climate drivers in the                                              There are two Bureau of Meteorology meteorological stations
                                                                    that monitor climate within the region: Mackay (Latitude
MWI NRM region                                                      21.12oS – Longitude 149.22oE – Elevation 30m) and Proserpine
                                                                    airport (Latitude 20.49oS – Longitude 148.56oE – Elevation
The Australian continent has the largest rainfall (and climate)     20m). Climate scientists have made significant advances in
variability in the world. The drivers of climate variability for    understanding weather and climate processes but these tend
Australia are described in the climate projections report           to focus on the influence of larger-scale processes or drivers
(CSIRO and Bureau of Meteorology 2015) and are categorised          and the parts of the continent that they influence. The rest of
via tropical and extratropical modes (weather features). The        this chapter focuses on the larger scale processes that are
MWI region however, has higher climate variability (Nicholls        known to influence the region’s climate..
et al. 1997) than the other NRM regions in the cluster (Wet
Tropics, Cape York and Torres Strait) and there may be
                                                                    The weather and climate features that affect climate variability
some influences from extra-tropical modes for the region’s
                                                                    in Australia are shown in Figure 3.2.
climate that are yet to be clarified by climate scientists. Most
information provided in this section has been sourced from the
                                                                    Two distinct seasons (wet and dry) occur in northern
CSIRO and Bureau of Meteorology (2015) climate projections
                                                                    Australian tropical modes (CSIRO and Bureau of Meteorology
report.
                                                                    (2015). These are influenced by the Australian monsoon, but
                                                                    influence of the monsoon is stronger in the northern parts of
The regional climate varies significantly with wetter parts
                                                                    the Wet Tropics cluster and has less of an influence in the MWI
of the region (i.e. Finch Hatton) to drier areas such as Eton.
                                                                    region. Onset of monsoon breaks is partly determined by the
The regional climate is influenced by local and regional land
                                                                    Madden-Julian Oscillation (MJO), which is an eastward moving
surface characteristics that influence moisture and energy
                                                                    tropical disturbance of high convection and rainfall with an
(solar radiation) exchange with the atmosphere (Sturman &
                                                                    average frequency of 40-50 days.
Tapper 2005). The direct influence at particular locations needs
longer term monitoring to improve understanding of variations
                                                                    The main drivers of natural tropical climate variability: the El
and influences within the region. Sturman and Tapper (2005)
                                                                    Niño Southern Oscillation (ENSO) and Indian Ocean Dipole
is an excellent reference to improve understanding of weather
                                                                    (IOD) influence timing of the Monsoon and MJO from year to
and climate drivers in Australia including regional and temporal
                                                                    year.
scale influences.

Figure 2.2 The main weather and climate features affecting climate variability in Australia. (Source: Risbey et
al. 2009 cited by CSIRO and Bureau of Meteorology 2015)

                                                                       10
ENSO is a major driver of global inter-annual climate variability   Projecting climate change
and has three phases (neutral, El Niño and La Niña) that are
based on anomalies of sea surface temperatures (SST) along          The climate is known to have changed over millennia through
the equator in the Pacific Ocean. The ENSO dominant neutral         examination of air trapped in proxy records such as ice cores.
phase occurs when SST and trade winds are in balance. The           Examination of layers in ice cores and other proxies has shown
El Niño phase occurs when the trade winds along the equator         that the composition of the atmosphere has varied between
lessen and SST are higher than normal in the eastern Pacific        glacial (ice ages) and inter-glacial (warm) periods and the
(and cooler over northern Australia), which brings reduced          average climate has changed around every 10,000-12,000
rainfall to eastern Australia. The La Niña phase occurs when        years. Further, the composition of CO2 in the atmosphere has
trade winds strengthen, SST’s are lower than average in the         generally been around 200ppm during glacial periods and
eastern Pacific and higher over northern Australia. La Niña         280ppm during inter-glacial periods.
is associated with higher than average rainfall over eastern
Australia, with increased risk of tropical cyclones.                Factors that can cause climate change include:

The IOD is a feature of the equatorial Indian Ocean                 •   Changes in the Earth’s orbit around the sun
characterised by changes in SST that affect year to year
climate variability across Australia and is broadly correlated      •   Changes in the sun that can affect the amount of solar
with rainfall across central and southern Australia (Risbey             radiation coming to the Earth
et al. 2009). The influence of the IOD to the climate of the
MWI region is not clear. For further information about ENSO         •   Volcanic eruptions that can put large amounts of ash
phases and the IOD see Chapter 4 in CSIRO and Bureau of                 (aerosols) into the atmosphere which can decrease the
Meteorology (2015).                                                     amount of solar radiation reaching the Earth, resulting in
                                                                        cooler temperatures
Understanding of the weather and climate has progressed
rapidly over the last 30 years, however many studies have           •   Changes in the concentrations of gases (such as CO2) in
examined climate drivers in isolation from each other and               the atmosphere.
at larger scales than specific NRM regions. The extent of
influence of these drivers and their interactions is also likely    In the 19th Century, Svante Arrhenius discovered the
to change on a yearly, decadal or longer-term basis. Drivers        potential relationship between increased greenhouse gases
of climate in the extra-tropical regions of Australia (Southern     in the atmosphere and temperature. A timeline of improved
Annular Mode, Subtropical Ridge, etc.) may or may not               understanding of climate science including global and
influence the local region. Further information on the current      Australian responses to the science is reproduced in Figure 3.3.
state of knowledge can be accessed from Chapter 4 in CSIRO
and Bureau of Meteorology (2015) and associated reference           Throughout the world a number of global climate models
material.                                                           have been developed that aim to simulate the interactions
                                                                    of the world’s atmosphere, oceans and land surface. These
                                                                    models are used for weather forecasting, to longer-term
                                                                    seasonal climate forecasts, to projecting climate change. The
                                                                    Coupled Model Intercomparison Project (CMIP) is a standard
                                                                    experimental protocol that commenced in 1995 for examining
                                                                    the outputs from these coupled atmosphere-ocean general
                                                                    circulation models (www.cmip-pcmdi.llnl.gov/). The latest
                                                                    series of models projecting future climate are referred to as the
                                                                    CMIP5 series.

                                                                    The IPCC Fifth Assessment Report (2013) using the CMIP5,
                                                                    also defines the methodologies and temporal scales for
                                                                    how climate scientists measure the change in climate (e.g.
                                                                    temperature, rainfall, evaporation, humidity etc.). In this Plan
                                                                    historical climate is based on the average climate for a 20-
                                                                    year period (1986-2005) as the baseline, which is centred at
                                                                    1995. Future climate scenarios from climate modelling for time
                                                                    periods also follow this definition 2030 (2020-2039), 2050
                                                                    (2040-2059), 2070 (2060-2079).

                                                                           11
Milestones in Understanding Climate                                                                                  Global and Australian Responses

                                                                                 Year
                                                                                1820
Understanding of the relationship between the earth’s
atmosphere and temperature                                                       1830
                                                                                 1840
                                                                                 1850
                                                                                 1860
Discovery that certain gases block infra-red radiation and prediction
that changes in their concentration would lead to climate changes               1870
                                                                                 1880       1880
                                                                                 1890         13.8˚C
Calculation that human emissions of carbon dioxide (CO2 ) would                             280 ppm1
                                                                                                          CO2
                                                                                 1900
lead to global warming.
                                                                                 1910
                                                                                1920

                                                                                1930

Warming trend since late 1800s documented
                                                                                1940

                                                                                1950
Advances in understanding of the global atmosphere
                                                                                            1960
                                                                                1960                       CO2
                                                                                            316 ppm1

Study of Man’s Impact on Climate conference warns of rapid and                  1970
                                                                                            1972 Establishment of United Nations (UN) Environment Program to provide
serious climate change caused by humans. This conference
                                                                                            leadership and foster international partnership.
dramatically increased awareness of climate change.

                                                                                            1978 US National Climate Program Act to co-ordinate climate programs and policies
                                                                                1980        1979 Scientific knowledge and concern building. World Climate Program launched
                                                                                            within World Meteorological Organization to urgently improve understanding of
                                                                                            global climate system.

Scientists call for international agreements to reduce
greenhouse gas emissions                                                                    1987 Montreal Protocol enables successful international action on reducing
                                                                                            global emissions of ozone-damaging gases
Intergovernmental Panel on Climate Change (IPCC)                                            1988 Scientific understanding being transformed into a policy issue. Toronto conference calls
established to provide clear scientific information about potential                         to reduce emissions of greenhouse gases by 20% by 2005. UK conservative Prime Minister
environmental, social and economic impacts of climate change.                   1990
                                                                                            Thatcher calls for action on climate change.
First IPCC Report showing earth already warmed
                                                                                            1992 Framework for Convention on Climate Change signed by 154 countries.
Breaking up of Antarctic ice shelves                                                        A legally binding agreement on the need to stabilise levels of greenhouse gases.
Second IPCC report, confirming human “signature” on warming
and predicting serious future warming                                                       1997 Kyoto protocol negotiated; 84 signatories.

Borehole data confirm warming trend                                                                     1997 Australia chooses not to ratify Kyoto protocol
                                                                                2000                    1997 Australia establishes Australian Greenhouse Office
Third IPCC report, predicting severe impacts of                                                         1998 Australian National Greenhouse Strategy
unprecedented global warming
                                                                                            2005 European Union Emissions Trading Scheme (ETS) commences. A market-based
Fourth IPCC report showing high economic, social and
                                                                                            approach to controlling emissions of greenhouse gases which provides economic incentives
environmental costs of climate change impacts
                                                                                            to reduce emissions.
Decline of Greenland and Antarctic ice sheets and                                                       2007 Australia ratifies Kyoto protocol
Arctic ocean sea-ice                                                                        2009 Copenhagen Conference achieves an agreement on a two degree guardrail and 30
                                                                                2010        billion dollars in commitments from developed countries.
                                                                                            2011 Canada withdraws from Kyoto Protocol.
Bureau of Meteorology (BOM) adds two colours to extreme                                               2011 Australia introduces carbon price
temperature mapping because of new record high temperatures
                                                                                            2012 Doha Amendment adopted, starting the second commitment period of Kyoto
Fifth IPCC report, demonstrating need for mitigation of                                     protocol 2013-2020
greenhouse gas emissions to avoid devastating climate change
impacts                                                                                     2014 UN Climate Summit, New York.
Australian BOM and CSIRO release climate report showing warming                                         2014 Australia repeals carbon price legislation
temperatures and projecting continued warming, sea level rise                                           2015 Australia introduces Emissions Reduction Fund
and ocean acidification                                                                     2014
CSIRO and BOM publish downscaled climate projections for the Wet                              14.6˚C
                                                                                            398 ppm1
                                                                                                          CO2
Tropics NRM cluster region
                                                                                2020
Information Sources
http://www.aip.org/history/climate/timeline.htm; www.skepticalscience.com; Edison M Salas                            1) Figures are global averages; source www.noaa.gov
(unpublished, James Cook University ); http://climate.nasa.gov/climate_resources/28/;
ftp://aftp.cmdl.noaa.gov/products/trends/co2/co2_annmean_mlo.txt; http://www.noaan-                                  Produced by the Wet Tropics Cluster Brokering Hub, November 2015
ews.noaa.gov/stories2011/20111109_greenhousegasindex.html

      Figure 3.3 Timeline of improved understanding of climate science including global and Australian responses

                                                                                                  12
How is the climate changing?                                        Statements about future climate are therefore linked with
                                                                    confidence statements that range from very high confidence
Mauna Loa Observatory in Hawaii has the longest records of          (almost certain) to low confidence.
direct measurements of CO2 in the atmosphere, beginning
in the late 1950s. Despite knowledge and scientific evidence
of the impacts of increased atmospheric CO2 this trend has          Climate Projections for the
continued unabated (Figure 3.4).                                    MWI NRM region
                                                                    There is compelling evidence that the global (and national)
The latest series of IPCC reports (https://www.ipcc.ch/report/
                                                                    climate has changed and will continue to do so. Projected
ar5) provides the most current information on the state of
                                                                    climate change level of confidence for the Macky Whitsunday
scientific knowledge about climate change. This information is
                                                                    Isaac NRM region including the relevant are as follows:
supplemented through the work completed by CSIRO/ BOM
for specific clusters as described in Chapter 1. Turton (2014)
discusses the climate projections for key climate variables in      •   Substantial increase in average, maximum and minimum
Chapter 2 of Hilbert et al. (2014) and is complemented by the           temperatures Very high confidence.
Wet Tropics Cluster report (McInnes et al. 2015). Links to these
documents can be found on the climate change pages of the           •   Substantial increases in the temperature of hot days,
Reef Catchments website (www.reefcatchments.com.au)                     as well as in the frequency and duration of extreme
                                                                        temperatures Very high confidence.
The IPCC AR5 developed four emissions scenarios entitled
Representative Concentration Pathways (RCPs) that describe          •   Average sea level and height of extreme sea-level events
plausible trajectories of future greenhouse gas and aerosol             will continue to rise Very high confidence.
concentrations to 2100 (Turton 2014), which are RCP2.6,
RCP4.5, RCP6 and RCP8.5. In brief, RCP2.6 presumes                  •   Increases in evapotranspiration in all seasons High
that action has been taken to reduce emissions, RCP4.5                  confidence.
presumes that emissions are starting to reduce now and CO2
concentrations in the atmosphere have stabilised by 2040.           •   Increased intensity of extreme rainfall events High
RCP8.5 is the worst case or business as usual where there is            confidence.
no effort to reduce emissions. For further information about
RCP’s see Turton (2014) or Chapter 3 in CSIRO and Bureau of         •   Less frequent but more intense tropical cyclones Medium
Meteorology (2015).                                                     confidence.

Projections in changes to the climate are linked with               •   Changes to rainfall are possible but unclear due to
confidence statements due to the inability to predict the future.       uncertainty in projecting change in some drivers of
CSIRO and Bureau of Meteorology (2015) group the levels of              tropical rainfall Low confidence.
uncertainty into three main categories:
                                                                    •   Little change to fire frequency is projected; however where
•   Uncertainty in scenarios due to not knowing future                  fires do occur fire behaviour will be more extreme High
    emissions and concentrations of greenhouse gases and                confidence.
    aerosols
                                                                    •   Higher sea levels and more frequent sea level extremes
•   Uncertainty in the response of the climate system which             Very high confidence.
    is a result of limitations in understanding of the climate
    system and its representation in climate models                 •   Warmer and more acidic oceans in the future Very high
                                                                        confidence.
•   The uncertainty around the natural variability in the
    climate system and its response to climatic change.             (Source: McInnes et al. 2015):

                                                                          Figure 3.4 Change in atmospheric concentration of CO2
                                                                          measured at Mauna Loa Observatory in Hawaii. (Source:
                                                                          www.esrl.noaa.gov/gmd/ccgg/trends. Accessed 18/1/2016)

                                                                           13
Methodology to determine                                           Climate Futures for the
future climate                                                     MWI NRM region
                                                                   The locations of the region’s meteorological offices (Mackay
CSIRO and Bureau of Meteorology (2015) developed a Climate         and Proserpine airport) are shown in Figure 3.5. Eungella has
Futures tool (www.climatechangeinaustralia.gov.au) for users       a distinctively different climate to both Mackay and Proserpine
to develop scenarios about change in climate variables for         due to its higher elevation and topography and is also depicted
different seasons and timescales that could be applied to          on the map.
assess likely change from historical baseline climate at a
regional level (based on the 20-year climatology of 1986-          The 20-year climatology (1986-2005) for the wet (November to
2005). Regional stakeholder groups were consulted on climate       April) and dry (May-October) determined from BOM records
variables, seasons and timeframes for their areas of interest to   (Mackay and Proserpine) and Eungella (SILO) are shown in
conduct these analyses.                                            Table 3.1.
The climate variables analysed were temperature, rainfall,
relative humidity and evapotranspiration. Seasons and
timeframes are for 2030, 2050 and 2070 for four seasons
(requested by the sugar industry), two seasons and annually.
Although analysis of change to evaporation was requested,
these analyses are only possible using CMIP3 models (IPCC’s
Coupled Model Inter-comparison Project used for the 2007
IPCC climate projections) and not the most recent suite of
climate models (CMIP5) and were therefore not conducted.
Further, historical records of evaporation, along with other
climate variables such as wind-speed and humidity (for a
20-year climatology), are not available from the regional
meteorological offices. Meteorological records were accessed
from the Bureau of Meteorology website (www.bom.gov.
au/climate/data/) for Mackay and Proserpine and the
historical climate calculated for requested seasons. There is
no meteorological station at Eungella therefore interpolated
datasets on historical climate were generated from the
Queensland governments SILO climate data drill (https://www.
longpaddock.qld.gov.au/silo/).

The Climate Futures tool has the ability to generate climate
projections based on emission scenarios (RCP’s) using 42
global climate models. Two emission scenarios were used in
these analyses: RCP4.5 which is described as greenhouse
gases (or CO2 concentrations) stabilising in the atmosphere
by 2040, and RCP8.5 business as usual or worst case scenario;
which is also the current trajectory for global greenhouse gas
emissions.

Due to the uncertainties in projecting future climate, three
scenarios are also usually generated which are: best case
(least change in the climate), worst case (greatest possible
change in the climate) and maximum consensus (where
most of the climate models agree on projected change).
Consideration of the three scenarios in this way enables a
range in the change trajectory to be generated for a specific
climate variable. It was agreed by regional stakeholders to
generate only the maximum consensus on likely climatic
change; therefore the potential change is only given as an
average figure and not the potential range. McInnes et al. 2015
presents the range generated through climate models for the
Wet Tropics cluster for 2030 and 2090.

The Climate Futures tool generates scenarios from cluster
regions (in this case Wet Tropics Cluster) and the user selects
the case (maximum consensus) to generate a model that can
then be applied to the historical climatology. These scenarios
are also linked with confidence limits. The detail around the
results from the Climate Futures Tool and climate models that
generated the results are appended (Appendix 1).

                                                                      14
Figure 3.5 Location of areas in the region examined for future climate

                                                                         15
Table 3.1 20-year climatology for Mackay, Eungella and Proserpine

 Site                 Temperature (oC)                                                                   Rainfall (mm)
                      Wet Season                               Dry Season
                      Maximum              Minimum             Maximum                Minimum
                                                                                                         Wet Season          Dry Season          Annual
 Eungella             29.4                 19.5                24.0                   12.7               1085                372                 1457
 Proserpine           30.9                 21.9                26.6                   14.3               1216                238                 1454
 Mackay               29.3                 22.5                24.0                   16.1               1179                313                 1492

Note: Additional information relating to seasonal historical climatology for four seasons and other climate variables derived from SILO are appended (Appendix 1).

As described earlier in this chapter there is significant variability from year to year in large-scale climate drivers and the variation
in topography across the region.

Results from the Climate Futures tool, model consensus and projected change are shown in Table 2.2 for a range of climate variables.

Table 3.2 Projected seasonal change in climate (for the maximum consensus case) for a range of climate variables for NRM regions
in the Wet Tropics cluster (expressed as oC change for temperature and percentages for rainfall, humidity and evapotranspiration)

                                2030                              2050                             2070                             2090
                                RCP4.5            RCP8.5          RCP4.5          RCP8.5           RCP4.5           RCP8.5          RCP4.5           RCP8.5

 Model Consensus                Moderate          High            Moderate        Moderate         Moderate         Moderate        Low              Low
 Climate Variable
 Temperature
 Max (wet)                      0.6               0.7             1               1.2              0.9              2.2             1.3              2.2
 Min (wet)                      0.6               0.6             1               1.2              0.6              2.2             1.2              2.1
 Max (dry)                      0.7               0.6             1               1.2              0.9              2.1             1.3              2.4
 Min (dry)                      0.7               0.6             1               1.3              0.7              2.2             1.3              2.3
 Rainfall
 Wet                            6                 -5              6               1                1                12              -1               -5
 Dry                            -2                -6              -4              5                2                10              -3               -1
 Humidity
 Wet                            0                 0               0               0                1                0               0                1
 Dry                            1                 0               -1              1                1                0               -1               3
 Solar radiation
 Wet                            0                 1               -1              1                0                -2              0                -1
 Dry                            0                 1               0               0                0                -2              -1               -1
 Evapotranspiration
 Wet                            2                 3               2               5                3                5               3                7
 Dry                            3                 3               4               5                3                7               4                10
Note: RCP 4.5 Emissions stabilising in the atmosphere by 2040, RCP 8.5 business as usual and no curbing of Emissions.

Certainty around the climate futures varies with only moderate consensus amongst models for most of the futures analysed. It needs
to be kept in mind that these results need to be interpreted with the general statements previously as to confidence around change
in climate variables.

Ongoing increases in temperature appear relatively small; however increasing average temperatures for all seasons and more
extreme weather events (e.g. heatwave events as the average temperature baseline increases) will have a range of impacts on
sustainability for the MWI region. This is discussed in more detail in later chapters. There is low confidence around the direction
of rainfall change for the Wet Tropics cluster region and these results need to be used with caution. Changes in humidity and
solar radiation appear negligible but may have an impact on ecosystem health in concert with increasing temperatures. Changes in
evapotranspiration are positive for all seasons with greater changes toward the end of the century. It is evident though that projected
change, at various temporal scales, is greatest under the higher emissions scenario (RCP8.5).

                                                                                         16
20

                                                                                                                                                        C°
                          15                                                                                                                                20

 Change in maximum
                10    temperature by                    May-Oct
 season for Eungella         RCP4.5 RCP8.5 RCP4.5 RCP8.5    RCP4.5 RCP8.5
                                                                                                                    Change in maximum
                                                                                                                                  15  temperature by                                                  May-Oct
Change      The  following  bar graphs depict projected  changes
                                                        Nov-Apr   in                                                season for Mackay
    35 in maximum    temperature by                   May-Oct 2070                                                                                                                                    Nov-Apr
                 Historical      2030           2050
            temperature to 2070 (2090 excluded due Nov-Apr
season for Eungella                                    to low model                                                Change in maximum temperature by                                                  May-Oct
                                                                                                                                  10
                                                                                                                   season for Mackay
              consensus) for two seasons (wet and dry), relative to the                                                                                                                              Nov-Apr
                                                                                                                                                                             RCP4.5 RCP8.5 RCP4.5 RCP8.5 RCP4.5 RCP8.5
   35
    30
                                                                                                                          30
              historical climatology for Eungella (Figure 3.6), Proserpine                                                                                     Historical          2030             2050            2070
   30
    25         Change
              (Figure  in
                        in minimum
               Change3.7)          temperature
                            and Mackay
                           maximum      (Figure
                                    temperatureby
                                                by3.8).              May-Oct
               season for Eungella                                   May-Oct                                             30                            Change in maximum temperature by
               season for Eungella                                                                                                                                                                                     May-Oct
 C°

                                                                                   Nov-Apr                                25
   25
    20                                                                             Nov-Apr                                                             season for Mackay
                 25                                                                                                                                                                                                    Nov-Apr

                                                                                                                     C°
                  35 in maximum temperature by
               Change                                                              May-Oct
C°

                                                                                                                         25                             Change in maximum temperature by                              May-Oct
   2015        season for Eungella                                                 Nov-Apr                                20
                                                                                                                                                        season for Mackay temperature by

                                                                                                                    C°
                      30
                      35
                      20
                                                                                                                                                       Change  in minimum                                             May-Oct
                                                                                                                                                                                                                      Nov-Apr
                                                                                                                                                           30 for Mackay
                                                                                                                                                       season
     1510                                                                                                                20                                                                                           Nov-Apr
                  25
                   RCP4.5 RCP8.5 RCP4.5 RCP8.5 RCP4.5 RCP8.5                                                              15                              30
                  30
     10Historical 15                                                                                                                                       30
                   C°

                       2030           2050          2070                                                                                                   25
                  20
                  RCP4.5  RCP8.5 RCP4.5 RCP8.5 RCP4.5 RCP8.5                                                             15
                  25                                                                                                      10

                                                                                                                                                        C°
                                                                                                                                      25
                                                                                                                                        RCP4.5 RCP8.5 RCP4.5 RCP8.5 RCP4.5 RCP8.5
      Historical                2030             2050           2070                                                                   25
                   C°

                      10
                       15                                                                                                              20
                      20                                                                                                 10Historical       2030          2050          2070
                                                                                                                                       RCP4.5 RCP8.5 RCP4.5 RCP8.5 RCP4.5 RCP8.5

                                                                                                                                                       C° C°
 Change in minimum temperature by                                                                                                     20
                                                          May-Oct
                10
 season for Eungella
                 5                                                                                                        Historical                        20
                                                                                                                                                             15     2030              2050            2070
                15            RCP4.5 RCP8.5
                                      RCP8.5 RCP4.5       Nov-Apr
                                              RCP4.5 RCP8.5
                                                      RCP8.5  RCP4.5RCP8.5
                                                                      RCP8.5
Change in minimum temperatureRCP4.5
                                 by                          RCP4.5
    25 for Eungella                                      May-Oct                                                                                            15
season           Historical
                10Historical      2030
                                 2030             2050
                                                2050               2070
                                                         Nov-Apr 2070
                                          RCP4.5 RCP8.5 RCP4.5 RCP8.5 RCP4.5 RCP8.5                                                                            15
                                                                                                                                                               10
   25                                                                                                                                            RCP4.5 RCP8.5 RCP4.5 RCP8.5 RCP4.5 RCP8.5
    20
                                                                                                                    Change in minimum
                                                                                                                                  10    temperature  by                     May-Oct
                   Historical      2030         2050                            2070                                season for Mackay
                                                                                                                                   10Historical      2030            2050 Nov-Apr 2070
   20
               Change in minimum temperature by                                        May-Oct                     Change
                                                                                                                       30 in minimum temperature    by RCP8.5 RCP4.5 RCP8.5
                                                                                                                                                 RCP4.5                    May-Oct
                                                                                                                                                                                RCP4.5 RCP8.5
               season for Eungella                                                                                                 5
                                                                                                                   season for Mackay
 C°

    15                                                                                 Nov-Apr                                                  RCP4.5  RCP8.5 RCP4.5      Nov-Apr
                                                                                                                                                                       RCP8.5 RCP4.52070
                                                                                                                                                                                      RCP8.5
                                                                                                                      30            Historical       2030            2050
               Change
                  25 in minimum temperature by                                     May-Oct                             25            Historical     2030          2050             2070
C°

     15        Changefor
               season  in maximum
                          Eungella temperature by
      10                                                                           May-Oct
                                                                                   Nov-Apr
               season for Proserpine                                               Nov-Apr                            25                               Change in minimum temperature by                               May-Oct
                      25
                      20                                                                                               20
     10               35                                                                                                                               season for Mackay                                              Nov-Apr
       5

                                                                                                                     C°
                                                                                                                      20                                    30
                   RCP4.5 RCP8.5 RCP4.5 RCP8.5 RCP4.5 RCP8.5
                  20                                                                                                   15
                                                                                                                                                       Change in minimum temperature by                               May-Oct
                  30
                   C°

                   15                                                                                                                                  season for Mackay
      5 Historical     2030           2050          2070                                                                                                                                                              Nov-Apr
                                                                                                                    C°
                  RCP4.5 RCP8.5 RCP4.5 RCP8.5 RCP4.5 RCP8.5                                                                         30
                                                                                                                                    25
                  25                                                                                                     15                                                                                               Proserpi
                  15                                                                                                      10 Mean annual number of days above 35C° (8 model average)
                   C°C°

       Historical 10 2030            2050          2070                                                                                                                                                                   Mackay
                  20                                                                                                                              45      25
                                                                                                                                                          20
                                                                                                                         10
                  105                                                                                                      5
                                                                                                                                                  40   C°
                                                                                                                                     RCP4.5 RCP8.5 RCP4.5 RCP8.5 RCP4.5 RCP8.5
                  15          RCP4.5 RCP8.5 RCP4.5 RCP8.5 RCP4.5 RCP8.5
                                                                                                                       5 Historical
                                                                                                                             35     20
                                                                                                                                     15
                                                                                                                                         2030          2050          2070
 Change in maximum
                10    temperature2030
                 5 Historical      by            2050     May-Oct
                                                                  2070                                                              RCP4.5 RCP8.5 RCP4.5 RCP8.5 RCP4.5 RCP8.5
                                                                                                                                                       C°

 season for Proserpine        RCP4.5 RCP8.5
                              RCP4.5          RCP4.5 RCP8.5
                                      RCP8.5 RCP4.5   RCP8.5 RCP4.5
                                                              RCP4.5 RCP8.5
                                                                      RCP8.5                                                 30
Change
                                                          Nov-Apr                                                  Figure 3.8 Projected
                                                                                                                        Historical         change in maximum
                                                                                                                                     10 2030
                                                                                                                                    15                2050     and minimum
                                                                                                                                                                    2070
    35 in maximum    temperature 2030
                                  by             2050    May-Oct 2070
                                                                                                                               no. days

                  Historical
                 Historical       2030            2050             2070                                                      25 for two seasons (wet and dry) for Mackay
                                                                                                                   temperature
season for Proserpine                                    Nov-Apr
   35
                                                                                                                   (maximum20consensus
                                                                                                                                105    case) for RCP4.5 and RCP8.5
    30        Figure 3.6 Projected change in maximum and minimum                                                                                                             RCP4.5 RCP8.5 RCP4.5 RCP8.5 RCP4.5 RCP8.5
              temperature for two seasons (wet and dry) for Eungella                                    Projected 15 changes    appear small;     however projections       around
   30
    25         Change in maximum temperature  by                                                   Meanextreme
                                                                                                          annual number    5 Historical
                                                                                                                           of
                                                                                                                                             2030               2050              2070
                                                                                                                                                                               Proserpine
              (maximum   consensus  case) for RCP4.5 and RCP8.5 May-Oct                                           events
                                                                                                                    10     bydays   above
                                                                                                                                climate    35C° (8RCP8.5
                                                                                                                                         scientists
                                                                                                                                        RCP4.5
                                                                                                                                                    model
                                                                                                                                                      intoaverage)
                                                                                                                                                           the future
                                                                                                                                                           RCP4.5       provide
                                                                                                                                                                    RCP8.5        a RCP8.5
                                                                                                                                                                             RCP4.5
                                                                                                                                                                               Mackay
               season for Proserpine
 C°

                                                                                       Nov-Apr        45very high confidence       for extreme (8temperature      (hot days are
   25
    20                                                                                                               5                                                        Proserpine
                  35 in maximum temperature by                                                     Mean  annual number    of Historical
                                                                                                                             days above      2030
                                                                                                                                          35C°                  2050
                                                                                                                                                   model average)                 2070
               Change                                                                                                                                                         Mackay
                                                                                   May-Oct              getting  hotter)  and   high  confidence     for intense   rainfall events.
C°

               season for Proserpine                                                                  40
                                                                                                     45              0
   2015        Change  in minimum  temperature by                                  Nov-Apr                                           RCP4.5    RCP8.5      RCP4.5     RCP8.5     RCP4.5   RCP8.5
                                                                                                      35Temperature and rainfall extreme events impact highly on
                  30                                                               May-Oct
                  35 for Proserpine
               season
                                                                                   Nov-Apr           40
     1510                                                                                               all aspect ofHistorical
                                                                                                                        sustainability2030
                                                                                                                                        due to damage     2050               2070
                                                                                                                                                            to infrastructure,
                      25
                      25
                       RCP4.5 RCP8.5 RCP4.5 RCP8.5 RCP4.5 RCP8.5                                      30                                                                                   Proserp
                      30                                                                             35         Mean
                                                                                                        social and     annual health
                                                                                                                      cultural  numberand
                                                                                                                                        of days   above 35
                                                                                                                                             wellbeing    asC°well  as natural
                                                                                                                                                               (8 model average)
                                                                                                                                                                                           Mackay
                   C°

                                                                                                      no. days

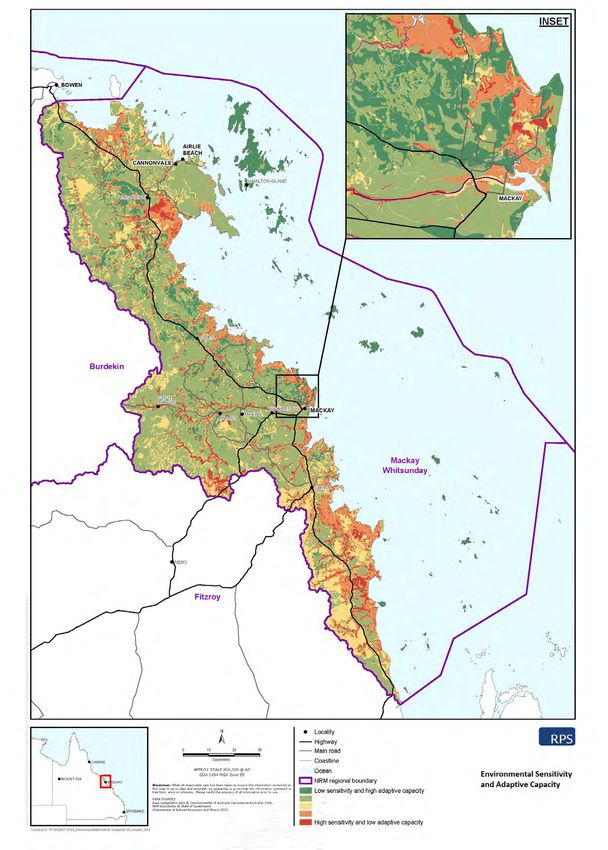
     10Historical          2030          2050          2070                                           25
                      20
                      RCP4.5
                      20     RCP8.5 RCP4.5 RCP8.5 RCP4.5 RCP8.5                                      30 ecosystems. 45 Increased frequency of these events reduces the
                      25                                                                                                                                                                  Proserpi
                                                                                                      20ability Mean   annualmost
                                                                                                                to recover:    number   of days above
                                                                                                                                     particularly        35C° (8 ecosystems.
                                                                                                                                                    in natural   model average)
                                                                                                 no. days

      Historical                2030             2050           2070                                 25             40                                                                    Mackay
                   C°
                   C°

                       15                                                                                                                         45
                      20
                      15                                                                                         2015                             35
                                                                                                                    Figure   3.940shows the projected changes to extreme
                          10
                          15              RCP4.5 RCP8.5 RCP4.5 RCP8.5 RCP4.5 RCP8.5                              1510           30
                          10                                                                                        temperature 35 (a) and rainfall (b) for the Wet Tropics cluster for
                                                                                                                 105
                                                                                                                               no. daysno. days

                                                                                                                    RCP 2.6, 4.525 and 8.5. RCP 2.6 has not been used in previous
                10Historical      2030          2050           2070
                                                                                                                   0            30
 Change in minimum
                 5    temperature by RCP8.5 RCP4.5 RCP8.5
                             RCP4.5                       RCP4.5 RCP8.5
                                                       May-Oct                                                    5 content as20this    presumes
                                                                                                                                     RCP4.5        global
                                                                                                                                              RCP8.5       emissions
                                                                                                                                                        RCP4.5        haveRCP4.5
                                                                                                                                                                  RCP8.5     already started
                                                                                                                                                                                       RCP8.5
 season for Proserpine       RCP4.5 RCP8.5 RCP4.5 RCP8.5 RCP4.5 RCP8.5
Change in minimum
                 Historical       2030
                     temperature by
                                                2050 Nov-Apr 2070                                                   to decline.25
                                                                                                                  0Historical    15For 2030
                                                                                                                                       both graphs the    middle bold line
                                                                                                                                                        2050            2070is the median
                  Historical     2030          2050   May-Oct 2070                                                                  RCP4.5   RCP8.5    RCP4.5    RCP8.5    RCP4.5     RCP8.5
    25
season for Proserpine                                                                                               value of the20 model simulations (20 year moving average). The
                                                                                                                                 10
                                                                      Nov-Apr                                     Historical          2030             2050            2070
   25
                                                                                                                    dark shaded 15 areas show the range (10th to 90th percentile) of
    20                                                                                                                            5
                                                                                                                    model simulations
                                                                                                                                10          of 20-year average climate. The light shaded
                                                                                                                                  0
               Change in minimum temperature by                                                                     areas represent the projectedRCP4.5 range  (10thRCP4.5
                                                                                                                                                                     to 90th percentile)    of
 C°

   20                                                                                  May-Oct                                                            RCP8.5               RCP8.5    RCP4.5                            RCP8.5
    15         season for Proserpine                                                                                              5
                                                                                       Nov-Apr                      individual years     taking into
                                                                                                                                  Historical         account year 2050
                                                                                                                                                   2030             to year variability
                                                                                                                                                                                     2070in
C°

                                                                                                                                  0
     1510      Change
                  25 in minimum temperature by                                     May-Oct                          addition to the long-term      response.
                                                                                                                                                RCP4.5    RCP8.5    RCP4.5     RCP8.5    RCP4.5                            RCP8.5
               season for Proserpine
                                                                                   Nov-Apr                                                         Historical               2030             2050            2070
     105              20
                      25                                                                                           Figure 3.9a demonstrates that agreement amongst the models
                       RCP4.5 RCP8.5 RCP4.5 RCP8.5 RCP4.5 RCP8.5
                                                                                                                   is higher for extreme temperature events with a distinctive
                   C°

      5 Historical 20
                    15 2030           2050          2070
                   RCP4.5 RCP8.5 RCP4.5 RCP8.5 RCP4.5 RCP8.5                                                       upward trajectory that increases with increased greenhouse
                                                                                                                   gas emissions.
                   C°

       Historical 15
                  10 2030                       2050           2070

                          105                                                                                      There is a high level of variability in rainfall extremes (Figure
                                          RCP4.5 RCP8.5 RCP4.5 RCP8.5 RCP4.5 RCP8.5
                                                                                                                   3.9b); however the majority of models show an upward
                           5 Historical       2030          2050                2070                               trajectory for increased intensity of rainfall events under higher
                                          RCP4.5 RCP8.5 RCP4.5 RCP8.5 RCP4.5 RCP8.5
                                                                                                                   emissions (RCP8.5).
              Figure 3.7 Projected
                   Historical      change in maximum
                                 2030          2050   and minimum
                                                              2070
              temperature for two seasons (wet and dry) for Proserpine
              (maximum consensus case) for RCP4.5 and RCP8.5

                                                                                                                                      17
You can also read