SUSTAINABLE BUSINESS PERFORMANCE SUMMARY - NIKE, INC. FY12/13 - ResponsibilityReports.com
←
→
Page content transcription
If your browser does not render page correctly, please read the page content below
NIKE, INC. FY12/13
SUSTAINABLE
BUSINESS
PERFORMANCE
SUMMARY
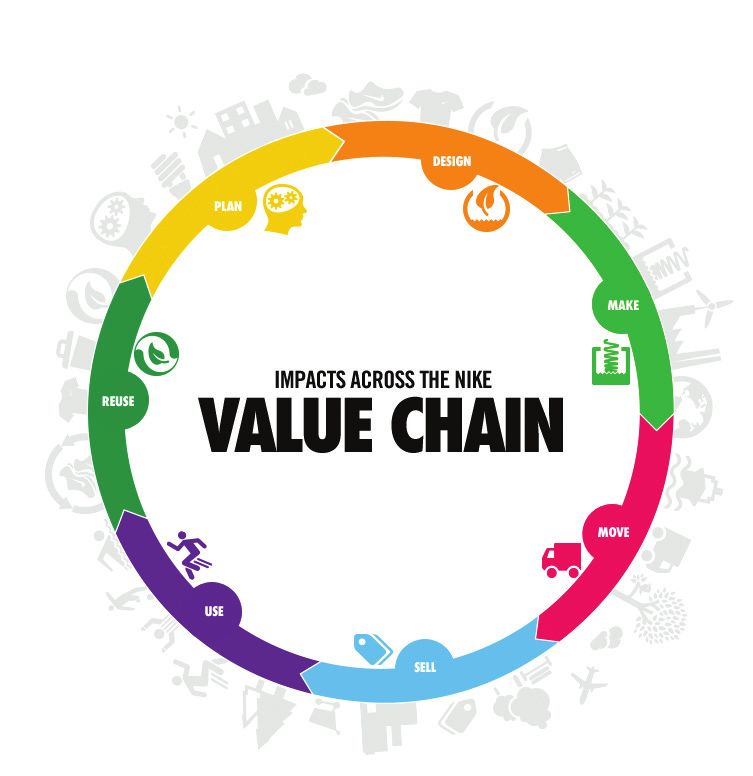
TABLE OF                     FY12/13 Sustainable Business Performance Summary

CONTENTS

WELCOME						 3

LETTER FROM PRESIDENT & CEO						                                          4

STRATEGY                      Business Overview 			                       7
                              Our Sustainability Strategy 		             10
                              Targets & Performance 		                   25

MAKE TODAY BETTER             Climate & Energy			 31
                              Labor 				35
                              Chemistry				43
                              Water				46
                              Waste 				50
                              Community			54

DESIGN THE FUTURE             Innovation 				     61
                              Product 				63
                              Manufacturing 			66
                              People & Culture			 73
                              How We Work			      79

GOVERNANCE & PUBLIC POLICY    Governance			   81
                              Public Policy			83

ABOUT THIS REPORT             Reporting at NIKE			               85
                              Stakeholder Engagement & Reporting 86
                              Reviews 				87
                              Recognition 			88

ONLINE CONTENT                www.nikeresponsibility.com
                              Glossary
                              Contracted Manufacturers Interactive Map
                              Design Experience
                              Data Sets
                              Background
                              Historic Reporting
                              Timeline
                              Guidelines & Principles Index

                                                                                2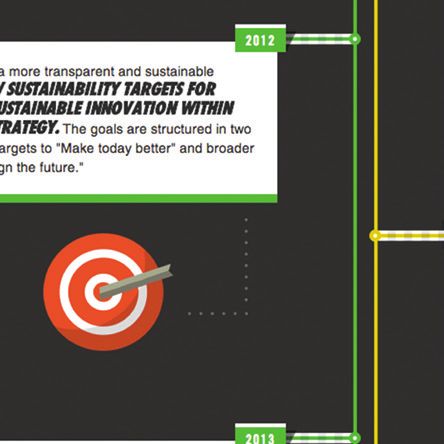
FY12/13 Sustainable Business Performance Summary

    WELCOME TO NIKE, INC.’s
    FY12/13 SUSTAINABLE BUSINESS
    PERFORMANCE SUMMARY

    Transparency and accountability are                       References to NIKE, Inc. generally include                how we are integrating sustainability into
    fundamental to our business and our                       all businesses in our portfolio during the                the core of our business.
    approach to sustainability. This report                   respective time period. However, references
    offers insight into our sustainability                    to the NIKE Brand generally exclude                       This print-on-demand report is
    strategy, performance and progress                        Converse, Hurley, NIKE Golf and Jordan.                   complemented by more comprehensive
    against the targets and commitments                       Further discussion of these changes and                   reporting at nikeresponsibility.com,
    we shared in our FY10/11 report.                          the boundaries of our reporting is included               including an interactive user experience
                                                              in our “Business Overview” and “About this                through which readers can access
    Our organization has undergone several                    Report” sections.                                         additional background data, explore our
    changes since our last report, including the                                                                        value chain and impacts, and find more
    divestiture of Cole Haan and Umbro in FY13                To provide concise, comprehensive                         extensive information and tools.
    and the inclusion of Hurley and NIKE Golf                 information, we have included dashboard-
    within the NIKE Brand in FY14. Generally,                 style summaries of progress against our                   Further details on our approach to reporting
    the operational metrics included in this                  targets and commitments, along with more                  can be found in the “About this Report”
    report are based on the structure of our                  detailed commentary and analysis.                         section on page 85.
    portfolio during the FY12 and FY13 reporting
    period. They have not been recalculated or                The report also includes a message
    changed to reflect the subsequent changes                 from our President & CEO, and an in-                      We hope you find this report useful.
    in our business portfolio.                                depth discussion of the importance of                     Please let us know how we’re doing at
                                                              sustainability to our growth strategy and                 nikeresponsibility@nike.com.

    NOTE: The information in this report and NIKE, Inc.’s corporate responsibility/sustainability reporting and website, inclusive of charts, graphs and discussion, and all
    other information presented, may contain forward-looking statements, estimates or projections based on expectations as of the original date of those materials. Those
    statements, estimates and projections are subject to certain risks and uncertainties that could cause actual results to differ materially. These risks and uncertainties
    are detailed in our reports filed with the US Securities and Exchange Commission, including Forms 8-K, 10-K and 10-Q. Presented information may also discuss non-
    public financial and statistical information and non-GAAP financial measures. All information was current only as of the date originally presented. We do not update or
    delete outdated information contained in website materials, and we disclaim any obligation to do so. All content is the property of NIKE, Inc.

3
FY12/13 Sustainable Business Performance Summary
LETTER FROM
PRESIDENT & CEO
NIKE, Inc.’s success as a growth company is tied directly to our culture of innovation. Today we
believe that sustainable innovation that benefits the athlete, the company and the planet will
NIKE is dedicated to serving play a key role in the future of our business.
athletes and helping them This principle shapes how NIKE does business. The results we see continue to motivate
reach their full potential. us. As you will read in this report, we are pushing the boundaries to decouple our growth
from constrained resources in order to leave the lightest possible footprint, while driving
As a growth company we are uncompromising performance for athletes everywhere.
dedicated to creating value for We are constantly integrating more sustainable ways of working across our business – from
our shareholders. The world in design to production, to logistics and retail. While this work propels us forward we also
recognize that NIKE is positioned to leverage the power of our brand to drive positive change
which athletes and companies across our entire value chain, within our industry and beyond.
compete is changing fast.
SUSTAINABLE INNOVATION INSIGHTS
We believe business has a Spanning almost 20 years, NIKE’s sustainability journey has been dynamic, marked by an ever-
critical role to play in meeting evolving set of challenges and opportunities. As we continue to raise the bar on our approach,
we see new opportunities. Three that stand out as I reflect on our FY12/13 progress are:
the challenges of a changing
1. Sustainability and business growth are complementary. Our strategy to create value while
world – addressing climate pursuing innovation that reduces our impact on the environment is delivering measurable
change, preserving the results. For example, the natural assumption is that as revenue goes up so does a company’s
greenhouse gas emissions as more sales translates to increased product manufacturing and
earth’s constrained resources, freight activity. However through a variety of initiatives we have been able to change the results
enhancing global economic of that equation, reducing absolute greenhouse gas emissions by close to 3 percent while
simultaneously increasing revenues by 26 percent over the time period covered by this report.
opportunity – not by reducing This motivates us to push even harder for sustainable innovation across the business.
growth but by redefining it.
Breakthrough technologies like NIKE Flyknit, which dramatically reduces waste compared
To do this we believe with traditional footwear manufacturing, and ColorDry, which eliminates water and process
businesses must embrace chemicals from dyeing while also driving down energy consumption, increasing productivity and
improving quality, provide just a snapshot of the game-changing innovation that will help fuel
sustainability as an innovation NIKE’s sustainable growth.
opportunity and governments 2. Materials Matter. Six years ago we identified that nearly 60 percent of the environmental
should act to create the right impact of a pair of NIKE shoes was in materials used to make it. That insight, along with our
commitment to design with purpose, has helped sharpen our focus on the need for disruptive
policies and incentives to innovation in the world of materials.
accelerate change at scale. Arguably, the last major breakthrough in materials that reshaped the industry at scale was
the introduction of polyester about 50 years ago. We believe there are significant innovation
opportunities ahead and are working to unlock the barriers to developing and scaling a new
palette of more sustainable materials, but we cannot do so alone.
To effectively drive systemic change we know we must collaborate and seek out unconventional
partnerships. Through our LAUNCH partnership with NASA, US Agency for International
Development, and the US Department of State, we are working to uncover innovations in
sustainable materials that can have a positive impact on people and the planet.
3. Climate change requires business change. At NIKE, everything we do begins with the athlete.
We know that climate-related issues, like pollution and extreme weather conditions, impact an
athlete’s ability to perform and the changing environment presents a unique set of innovation
challenges. Similarly, as a business with diverse global operations, NIKE’s supply chain is
exposed to a range of changing risk factors. This means that our products, as well as how and
where they are made, are fundamental considerations in the long-term success of our business.
NIKE’s approach to meta-trend analysis, future-casting and innovating for long-term growth, will
help drive performance in the short term, while also positioning us to continue to turn risks into
innovation opportunities over the long term.
4
FY12/13 Sustainable Business Performance Summary

    FROM REPUTATION MANAGEMENT TO INNOVATION OPPORTUNITY
    As NIKE has grown and changed, we have fundamentally shifted our sustainability strategy.
    Early on, we learned that rather than just managing our reputation by reacting to criticism about
    our supply chain, we could create real opportunities for change by creating an environment of
    industry collaboration, partnership and transparency.

    This approach has continued to evolve to one where we are harnessing the power of innovation
    to manage risks, create opportunities and meet our sustainability and social goals, adding value
    to our business and brand.

    In 2013, in recognition of the importance of sustainability to NIKE’s Innovation strategy, we
    transitioned our Sustainable Business & Innovation organization into NIKE’s core Innovation
    function, signaling the enterprise-wide role sustainable innovation will play in NIKE’s future.

    During the period this report covers, we also worked with two leading academic institutions
    – Harvard Business School and Stanford Graduate School of Business – on case studies that
    examine NIKE’s journey since the 1990s. As these teaching instruments are more widely
    adopted, we hope NIKE’s experience as one of the first brands to respond to the challenges of
    responsibility associated with globalization, will positively inform the decisions of tomorrow’s
    business leaders.

    ENHANCING PERFORMANCE THROUGH TRANSPARENCY
    In our previous report, we established new sustainability targets across all impact areas in our
    value chain; most of which are 2015 targets. In the interim, this report provides a detailed
    account of the progress we have made and where we have faced challenges.

    Our performance against targets is detailed extensively throughout this report. We believe that
    disclosing our targets and reporting against them provides a strong mechanism to continue to
    drive internal integration and build external understanding among all of our stakeholders.

    We established a new norm by disclosing our contract factory base back in 2005, and we still
    believe transparency is essential for industry change. We also continue to work with global
    influencers, including the United Nations Global Compact, in support of global principles in the
    areas of human rights, labor, the environment and anti-corruption.

    IT’S NOT A QUESTION OF LESS; IT’S A QUESTION OF BETTER
    NIKE is dedicated to serving athletes and helping them reach their full potential. As a growth
    company we are dedicated to creating value for our shareholders. The world in which athletes
    and companies compete is changing fast. We believe business has a critical role to play in
    meeting the challenges of a changing world – addressing climate change, preserving the earth’s
    constrained resources, enhancing global economic opportunity – not by reducing growth but
    by redefining it. To do this we believe businesses must embrace sustainability as an innovation
    opportunity and governments should act to create the right policies and incentives to accelerate
    change at scale.

    By sharing our experience, documenting our progress, noting where we have fallen short and
    identifying the challenges that lie ahead, we are hopeful NIKE can help positively shape the
    future.

    The challenge to create a sustainable economy is global and requires a global response.
    We believe it begins with a simple idea: invent better solutions.

                                                President & Chief Executive Officer
                                                NIKE, Inc.

5
FY12/13 Sustainable Business Performance Summary
STRATEGY
Innovation has never been more important than it
is today. It’s not just about improving the products
we make. It’s about how we invent better ones, work
with other companies and organizations to develop
markets that value and encourage the creation of new
sustainable processes and products, and improve lives
by leveraging sustainability as the world’s greatest
innovation opportunity.
IN THIS SECTION: NIKE, Inc. continues to deliver strong Indeed, creating and building business
BUSINESS
growth. What fuels our success and models that not only recognize and
challenges us? Innovation. It’s our growth accommodate but thrive on the constraints
OVERVIEW engine. It’s what our athletes, consumers
and investors expect of us – and always
of the natural world is the only way we
can achieve growth in the present that
OUR have. It’s what we expect of ourselves. It
enables new heights in performance and
won’t compromise our ability to grow and
succeed for decades to come.
SUSTAINABILITY raises the bar for our industry and beyond.
Of course, this transition is challenging
STRATEGY Our world faces unprecedented change: for a company that sells physical products
constrained resources, population growth, and has bold ambitions to provide those
TARGETS & heightened connectivity, increased products to more people in more places
demand. In a world of finite natural worldwide. Transforming NIKE in this
PERFORMANCE resources, our growth is enabled by way will take time and is a long-term
infinite human resources: innovation and commitment. It touches every aspect of
inspiration. our business, from how we design and
make our products to how we engage
We understand that innovation through the our employees and other businesses in
lens of sustainability is fundamental to our value chain. It begins with placing
achieving our vision of growth that is not sustainability at the beginning of the
dependent upon constrained resources. innovation process.
6BUSINESS FY12/13 Sustainable Business Performance Summary
OVERVIEW
As the world’s leading athletic footwear, apparel and equipment
company, NIKE, Inc. is dedicated to inspiring every athlete to
reach their full potential. NIKE co-founder Bill Bowerman saw
endless possibilities for human achievement through sport. His
philosophy still guides our mission today: “To bring inspiration
and innovation to every athlete in the world.” We believe if you
have a body, you are an athlete.
Through our commitment to innovation, sustainability and design, we are continually
We are working to integrate challenging ourselves, and our consumers, to reach the next level of achievement.
sustainability into every aspect
of our business. Our aim is to WE STRIVE FOR INNOVATION THAT:
challenge, push and explore • Serves the athlete
• Grows the company
ways that change the game • Delivers inspiration
entirely for materials, design
and manufacturing. COMPANY PORTFOLIO
NIKE, Inc. includes five distinct brands, each with a powerful connection to its customers:
• NIKE Brand designs, develops and sells high-quality athletic performance gear
and sport-inspired lifestyle products, including footwear, apparel, equipment and
accessories
• Converse, Inc. designs, markets, licenses and sells casual sneakers, apparel and
accessories
• Hurley International LLC designs, markets and distributes surf and youth lifestyle
footwear, apparel and accessories
• Jordan Brand designs and markets premium footwear, apparel and accessories
inspired by the dynamic legacy, vision and direct involvement of Michael Jordan
• NIKE Golf designs and markets golf equipment, apparel, balls, footwear, bags and
accessories
Converse, Hurley and NIKE Golf were reported as “Other Businesses”in FY12 and FY13.
Other affiliated brands in our portfolio at the end of FY12 were Cole Haan and Umbro,
which we divested in FY13. Beginning in FY14, Hurley and NIKE Golf results are now
reported within the NIKE Brand, while Converse results are a separate reporting segment.
Accordingly, we have restated all comparative financial information to reflect these
changes, which can be found at investors.nikeinc.com. However, reference to other NIKE
Brand metrics throughout this report have not been restated to reflect these changes.
7BUSINESS FY12/13 Sustainable Business Performance Summary
OVERVIEW
NIKE, INC. CORPORATE OVERVIEW
Over the past 15 years,
we have evolved from
approaching sustainability
reactively as a reputation
management issue to
embracing it as a key
driver of innovation and
an important source of
competitive advantage.
*Forward-looking statements, estimates or projections are based on expectations as of the original date of those materials. Those statements, estimates
and projections are subject to certain risks and uncertainties that could cause actual results to differ materially. These risks and uncertainties are
detailed in our reports filed with the US Securities and Exchange Commission, including Forms 8-K, 10-K and 10-Q.
PLAN FOR GROWTH
NIKE, Inc. is a growth company. Over the last 10 years, we’ve more than doubled our
revenue, and we believe we’ll deliver $30 billion in revenue by FY15 and $36 billion
by FY17.*
Since we published our FY10/11 Sustainable Business Performance Summary, our
overall employee base grew to approximately 48,000 at the end of FY13, including
seasonal and part-time, an increase of 10,000 employees. We expect strong growth in
Running, Basketball, Football, Men’s Training, Sportswear, Women’s Training and Direct to
Consumer sales. As we look forward, we believe that sustainability is one of the key drivers
that will catalyze innovation and lead us toward continued growth.
8BUSINESS FY12/13 Sustainable Business Performance Summary
OVERVIEW
NIKE, INC. REVENUE PERFORMANCE FIVE-YEAR NIKE, INC. STOCK PERFORMANCE VS. S&P 500*
FY09-13 CAGR 7%* FY09-13
Revenue in millions
30k 100%
95%
$25,313
$23,331
15k $18,528 $18,324 $20,117 50%
30%
0 0%
FY09 FY10 FY11 FY12 FY13 S&P NKE
*
5-year Compound Annual Growth Rate (CAGR) based on Fiscal Year 2008 Revenue of *
Performance of the S&P 500 and NIKE stock is calculated by comparing the total returns
$18,075 million. The revenue amounts presented reflect the results of our continuing of each assuming the reinvestment of dividends over the time period of 5/31/2008 to
operations. 5/31/2013.
NIKE, Inc. DILUTED EPS PERFORMANCE* NIKE, INC. RETURN ON INVESTED CAPITAL*
FY09-13, Five-Year CAGR 8%** FY09-13
Revenue in millions
3 25%
$2.69 21.7% 22.2% 23.8%
20.7%
$2.24 $2.24 17.8%
1 $1.79 $1.95 12%
0 0%
FY09 FY10 FY11 FY12 FY13 FY09 FY10 FY11 FY12 FY13
*Diluted EPS amounts presented reflect the results of our continuing operations. These *
Return on Invested Capital calculation is included in the quarterly earnings section of our
amounts have been restated to reflect our two-for-one stock split on December 24, 2012 investor relations website, investors.nikeinc.com, as one of our key financial metrics calcula-
and are not directly comparable as they include non-recurring expenses and benefits tions. Please refer to this site for more detail on this calculation.
such as restructuring changes and settlements.
**
5-Year Compound Annual Growth Rate (CAGR) based on Fiscal Year 2008 diluted EPS
of $1.85.
Like many other businesses, NIKE faced some headwinds in FY12/FY13. Rising costs for
energy, materials and labor sparked inflationary pressures in some locations and margin
pressures across our industry. Major weather events, such as flooding in Thailand, put
stress on supply chains and delivery. Both weather conditions and political unrest affected
markets and confidence in some areas.
While these challenges were shared across our industry, the competitive advantages we
have are unique to the NIKE portfolio. In spite of ongoing macroeconomic challenges, we
remain well positioned to leverage our strengths – including scale, operational capabilities,
brand strength and product innovation – to help mitigate the risks beyond our control and
capitalize on opportunities to grow our company.
TAKING THE LONG VIEW
At NIKE, we seek to deliver shareholder value through sustainable growth. One of the ways
we will achieve this goal is to find avenues to reach our long-term vision of decoupling
profitable growth from constrained resources.
We are working to integrate sustainability into every aspect of our business. Our aim is to
challenge, push and explore ways that change the game entirely for materials, design and
manufacturing. We don’t grow just to get bigger. We grow to be better and do better.
9OUR FY12/13 Sustainable Business Performance Summary
SUSTAINABILITY
STRATEGY
We focus sustainable innovation on our biggest areas of
opportunity and risk. We ask difficult questions of ourselves,
our business model and our industry. We seek to understand
the meta-trends and the signals – strong and weak – that
add complexity and uncertainty to the future. Rather than
working to avoid only known risk, we work to understand where
opportunity may emerge and what’s needed to foster and scale
it, to enable new forms of innovation to take hold.
The scale of today’s Based on extensive analysis of the impacts of our business across the value chain (see
page 12 for detail), we know that materials and manufacturing represent the greatest
challenges requires areas of impact on workers, communities and the environment, and the greatest potential
breakthrough innovations for sustainable innovation.
such as entirely new materials
While NIKE has focused on materials innovation for many years, most improvements
and ways to make products. across the industry have been incremental, not fundamental. The time is right for
innovation that leads to a more sustainable palette of materials and chemistries (see
page 17 for detail). We have focused for many years on improving the working conditions
of contract factory workers, increasing productivity, and reducing the environmental
footprint of manufacturing, eventually bringing these threads together through
implementation of lean manufacturing.
The future of lean for NIKE is to deliver profitable growth through sustainable
manufacturing and sourcing. To do this, we are making lean NIKE, Inc.’s manufacturing
standard. We require a commitment to lean as part of being accepted into our source
base and a minimum commitment and progression for positive ratings by including it in
our Sourcing and Manufacturing Sustainability Index, a component of our Manufacturing
Index which assesses factories based on sustainability, cost, quality and on-time delivery.
We are working with our supply chain to demonstrate the value of lean as a driver of
sustained, improved business performance where workers are engaged and enabled to
drive business success through continuous improvement. Some of the standard metrics
we use to assess factory adoption include productivity, human resources management
assessments, turnover, absenteeism, and factory implementation of and results from
worker engagement and well-being surveys.
We are now driving a portfolio of advanced manufacturing initiatives that encompass
changes to the traditional manufacturing business model that includes the role of
workers in the production of better products and services. (See discussion in the
“Manufacturing” section.) As described throughout this report, these two areas –
materials and manufacturing – are central to our strategy.
10OUR FY12/13 Sustainable Business Performance Summary
SUSTAINABILITY
STRATEGY
MAKING TODAY BETTER WHILE DESIGNING THE FUTURE
Sustainable innovation takes many forms at NIKE. Incremental improvements play an
important role in our efforts, since even small changes have large impacts across our
portfolio. However, incremental changes on their own fall short of the progress needed.
The scale of today’s challenges requires breakthrough innovations such as entirely new
materials and ways to make products. As an example, in 2012 we introduced the first
product made using the innovative new NIKE Flyknit technology and manufacturing
process. The Flyknit Lunar 1+ running shoe, launched in 2013, reduces footwear waste
in the upper by 80% on average compared with traditional production methods. To put
a picture to that amount of waste, from its introduction in 2012 through FY13 the total
combined material savings from just the uppers of the Flyknit Lunar 1+ compared to
a traditional running shoe was 66,000kg – about the same as 12 adult male African
elephants. Flyknit is a game changer and we believe there is significant potential ahead as
Flyknit technology is implemented more broadly across our footwear offering.
We run a thriving global business.
NIKE’s ability to deploy disruptive technologies like Flyknit at scale multiplies
PLAN The people, offices, brand and sustainability benefits. And as the game changes, we remain on the offense, always.
beyond – they’re all part of the plan.
Our designers combine technology,
creativity and mindful material In some cases, where we have direct influence, we use our management tools, expertise
selection to make all of our and other resources to take a leadership role. One example is the creation and proliferation
products. While we have control
DESIGN over what materials we select, we of the NIKE Materials Sustainability Index (NIKE MSI). (See page 18 for detail.)
recognize each material has its own
often considerable footprint, from
growing through to processing. Other opportunities, such as improving working conditions within our global supply chain,
We’re focusing on turning the are beyond the reach of any single organization and require collaboration with other supply
sustainability challenges of chain participants. One way we are working on these changes is through our collaboration
manufacturing into lasting
MAKE opportunities by carefully selecting with the Fair Labor Association to develop the Sustainable Compliance Initiative. This
those we source from, and working initiative, still in development, provides tools to improve the quality, consistency and
together to reduce impacts.
efficiency of efforts in our industry to comply with country laws/regulations, and company
The world isn’t getting smaller, but
our global logistics make obstacles standards.
MOVE like distance and time easier to
hurdle.
People don’t go to a NIKE store just
For challenges such as building a market for sustainable materials, we need input from
SELL to shop. They expect expert advice, a broad range of stakeholders and experts. (See page 23 for detail.) After all, risk is
inspiration and experience.
interconnected so solutions must be collaborative. Companies that win in the future
Our products spend most of
their lives with consumers. How will be those capable of accessing new sources of knowledge, creativity and capital to
USE consumers care for them over time accelerate sustainable innovation and bring it to scale.
makes a big difference.
NIKE shoes have better things to do
than retire in a landfill. We aim to To further advance our efforts, at the start of FY14 we embedded our Sustainable
reuse and recycle our products as Business & Innovation function into the company’s Innovation group (see page 20 for
REUSE much as possible. And even after
their useful life is over, where they detail). This streamlines the sharing of sustainable innovation throughout the company
end up matters. and continues a nearly 20-year evolution to move corporate responsibility and sustainable
innovation from the periphery of the organization to the core of the company. This move
For details on our methodology and an
interactive exploration of our value chain visit means that sustainability will be central to the questions asked and the solutions created
nikeresponsibility.com. in the innovation process.
11OUR FY12/13 Sustainable Business Performance Summary
SUSTAINABILITY
STRATEGY
OUR VALUE CHAIN
FOOTPRINT (FY13)
Plan Design Make Move Sell Use Reuse
(Materials)
Emissions
3% 56% 15% 5% 1% 20%OUR FY12/13 Sustainable Business Performance Summary
SUSTAINABILITY
STRATEGY
to increase our overall positive impact. This approach has been central to our relationships
with contract manufacturers and other brands for many years.
Within every sustainability
challenge also lies a In 2013, we furthered our study of our environmental footprint across our entire value
business opportunity. chain – from raw materials production through consumer disposal of products after use.
This is a complex analysis, due to the variation in the availability and quality of data, the
need to make assumptions and extrapolations, and the dynamic nature of this system and
its many participants. Our knowledge in this area continues to grow.
The analysis – which covers energy use, water consumption, waste generation and
greenhouse gas (GHG) emissions – confirmed what we have long believed about the
importance of the design process and materials, and how products are made. These issues
are thus the main focus of our programs and this report. More detail on our methodology
and approach is available online at nikeresponsibility.com.
The footprint graphic (page 12) only tells part of the story. We also made discoveries
within these categories, such as the significant effect of cotton and leather on our overall
impacts. In the raw materials stage of the value chain, growing cotton represents 87% of
water use, and it accounts for more than 63% of water use across our entire value chain.
Leather production represents 56% of GHG emissions during the raw materials stage –
mostly from methane as a result of cattle’s digestive processes – and more than 18% of
our total greenhouse gas footprint. These types of insights are valuable as we develop
and evolve our programs moving forward. They compel us to look well beyond the surface
levels of the systems we touch and deep into our value chain. This perspective reinforces
that our span is much bigger and more complex than one might imagine, stretching even
into the agricultural fields where the raw materials for our products are grown and raised,
and where some of our biggest system impacts occur.
By nature, footprinting is backward-looking. Setting our sustainability strategy also
requires looking forward, to navigate in the direction we believe the world is heading.
For many years we’ve focused on meta-trends – “strong signals” – pointing to the
sustainability-related issues that pose the greatest business risks or opportunities. These
meta-trends include issues such as water scarcity, materials cost inflation, climate
change, rising labor costs as well as increased transparency and heightened levels of
collaboration. (See page 12 of our FY10/11 Sustainable Business Performance Summary
for more detail.)
We also listen closely to “emerging signals.” Some of the emerging signals we’ve
identified – including micro-plastics in the environment and increasing and changing
environmental policies – are broader than our company or industry. Issues such as these
have the potential to become even more relevant to NIKE in the future.
Within every sustainability challenge also lies a business opportunity. For example,
to better manage constrained resources, we develop and use more recycled and more
sustainable materials, and leaner manufacturing processes. To decrease our exposure
to labor cost inflation and capacity constraints, we increase the efficiency of our supply
chain. We have developed superior materials such as water-based adhesives through
green chemistry, which also delivers health and safety benefits to workers. These types
of innovations have already delivered substantial benefits to our business, and we expect
them to increase in the coming years.
13OUR FY12/13 Sustainable Business Performance Summary
SUSTAINABILITY
STRATEGY
SUSTAINABILITY CHALLENGES AND OPPORTUNITIES
SUSTAINABILITY CHALLENGES AND OPPORTUNITIES
How NIKE, Inc. views, anticipates and responds to emerging signals alongside global
How
trends, NIKE,
risks and Inc. views, anticipates
opportunities, and responds
and business to emerging
challenges to informsignals alongside global
its plans
trends, risks and opportunities, and business challenges to inform its plans
EMERGING SIGNALS
GLOBAL META TRENDS We identified the following
emerging signals that could
Environment Governance pose challenges or opportunities
for NIKE in the future:
GLOBAL RISK/ BUSINESS
OPPORTUNITY CHALLENGES
Increasing Energy Resource Cost
Consumption Volatility
Water Inadequacy Performance
Changing Climate Innovation
Income Divides & Labor Inflation
Health Bridges
Efficient Supply Chain
Connectivity
& Wellness Obesity Spreads
Growth
Coming of Age in the
Southern Hemisphere
Women in a New Light
Easy Access to
Information
EXECUTED PLANS
Demographics Security
SUSTAINABLE SUSTAINABLE NEW SOURCES ENABLERS &
PRODUCTS & MANUFACTURING & OF REVENUE MANAGEMENT
MATERIALS SOURCING CAPABILITIES
PORTFOLIO PORTFOLIO
OPPORTUNITIES
Infinite resource availability • Closed-loop product
Zero waste • Low-risk value chain services
We also use scenario planning to sharpen our understanding of the potential impact of
sustainability issues on our business and to inform decision making. Through scenario
planning, we can assess the potential impacts that external issues such as climate
change or resource scarcity might have on NIKE. We can model the rippling effect
that a percentage change in our use of a more sustainable material might have across
the value chain, or the impact of changes to our sourcing base as we fully implement
our sustainability indices. We can also analyze how initiatives, such as those that
improve energy or water efficiency, or decrease waste, could impact the company’s
competitiveness.
Understanding these interconnections helps us prepare for a range of possible futures and
improves our ability to develop innovative solutions to address emerging risks before they
become more challenging to manage.
For example, in 2013 we developed a scenario tool to explore the impacts that climate
change, and related water scarcity, could have on cotton, one of our main product inputs.
We developed a Business and Environmental Scenario Tool (see page 15) which gives us
the ability to assess overall and intersecting impacts from changes to different scenarios.
14OUR FY12/13 Sustainable Business Performance Summary
SUSTAINABILITY
STRATEGY
We work with stakeholders and experts from outside the company to validate this work,
Understanding these
to develop a collective understanding of the systemic issues we face and to identify
interconnections helps shared solutions.
us prepare for a range
of possible futures and BEST (BUSINESS AND ENVIRONMENTAL SCENARIO TOOL)
improves our ability to BEST provides a 10-year quantified view of environmental and financial impacts from
develop innovative solutions changes to scenarios such as materials used or changes in sourcing.
to address emerging risks Before developing BEST, we:
before they become more • Calculated separately the impact that changes to the business had on each criterion
challenging to manage. (financial, water, energy, CO2, waste)
• Took extended time to conduct the environmental analyses
• Had a limited view due to the focus on and analysis of one criterion at a time,
therefore we made decisions based only on one criterion or continued with
potentially conflicting analyses across different criteria
• Often excluded interactions between criteria
• Usually focused only on Tier 1 suppliers – those with whom we directly contract for
goods or services – though a considerable portion of the impact occurs earlier in the
value chain
• Saw each group within NIKE focus on the criteria that were important to them
With BEST we can:
• Input one scenario and receive data on simultaneous impacts to five criteria
(financial, water, energy, CO2, waste)
• Complete the analysis quickly, with a turnaround in minutes, rather than weeks
• Take a holistic view of all criteria and compare the return on investment for all
criteria at the same time
• Capture how changes to one criterion impacts others
• Take into account a more complete view of the supply chain
• Provide users with a view of the entire business so they can see how their decisions
impact other business areas
We now use BEST to assess various impacts and decisions. Some examples include:
• Impacts to costs, water usage and energy usage if we use less cotton and more
polyester
• Changes to the amount of materials purchased, energy used and waste generated if
we increase pattern efficiency by certain percentages
15OUR FY12/13 Sustainable Business Performance Summary
SUSTAINABILITY
STRATEGY
NIKE’S SUSTAINABILITY STRATEGIC FRAMEWORK
We deliver a portfolio of
NIKE’s Sustainable Business and Innovation team focuses on enabling the company to
sustainable products and thrive in a sustainable future, and provides the insights, tools and expertise to hardwire
services that maximize sustainable decision making into global business operations.
athlete performance.
Given the trends and analysis described earlier, NIKE drives sustainable business
innovation in three strategic ways:
1. Deliver a portfolio of sustainable products and services that enhance
athlete performance
2. Prototype and scale sustainable sourcing and manufacturing models
3. Explore new sources of revenue not based on constrained resources
These pillars are underpinned by skills and capabilities that enable their success. The
sections below describe these pillars and how they work together to drive the disruptive
innovations that will shape our future.
It’s important to note that NIKE also continues to focus on other important aspects of
corporate responsibility including compliance, stakeholder management, employment
practices and community investment. These play an important role in our overall
performance, and our programs and progress in these areas are described later in
this report.
SUSTAINABILITY STRATEGIC FRAMEWORK
Drive profitable
profitable growth and reduce risk through sustainable innovation
1 2 3
Deliver a portfolio Prototype and scale Explore new sources
of sustainable sustainable sourcing of revenue not based
products and services and manufacturing on constrained
that enhance athlete models resources
performance
Turn sustainability risks into business opportunities
Hardwire sustainability in the way we operate and drive adoption of sustainability innovation
Catalyze strategic partnerships to bring sustainable innovations to scale faster, cheaper, better
Explore Prototype Pilot Scale
Landscaping and Proof of Business Catalyze
business case concept transition markets
16OUR FY12/13 Sustainable Business Performance Summary
SUSTAINABILITY
STRATEGY
MATERIALS MATTER
NIKE’s main environmental impacts, by far, are realized in the products we sell and the
materials used to make them.
The materials we choose have impacts that ripple across every stage of the value chain.
The approximately 900 million units produced annually through our supply chain are
made from more than 16,000 materials selected from more than 1,500 different vendors,
chosen from a staggering 80,000 material options.
From our analysis, the production of these materials – from growing cotton and harvesting
rubber, to raising livestock for leather and extracting oil for polyester – represents 21% of
the total energy use throughout our value chain, 73% of the water consumption and 33%
of the greenhouse gas emissions. When you include materials processing activities, such
as the dyeing and finishing of fabrics, those percentages increase to 54% of total energy
use, 83% of water consumption and 56% of GHG emissions.
THE
THE EVOLUTION
EVOLUTION OFOF OUR
OUR PRODUCT
PRODUCT SUSTAINABILITY
SUSTAINABILITY INDEXES
INDEXES
We launched new and updated evaluation tools for rating the sustainability of footwear and
We launched new and updated evaluation tools for rating the sustainability of footwear and
apparel designs in FY13. Described below, these indexes represent the next generation of our
apparel designs in FY13. Described below, these indexes represent the next generation of our
Considered Indexes.
Considered Indexes.
NIKE FSI
Footwear Sustainability Index
The NIKE FSI
rates footwear designs
as follows:
40%
NIKE Materials
30%
Manufacturing
20% 10%
Manufacturing Manufacturing
Sustainability Waste Solvent Energy
Index Score Score Use Score Use Score
NIKE ASI
Apparel Sustainability Index
The NIKE ASI
rates apparel designs
as follows:
60%
NIKE Materials
40%
Manufacturing
Sustainability Index Score Waste Score
17OUR FY12/13 Sustainable Business Performance Summary
SUSTAINABILITY
STRATEGY
Reducing materials-related impacts is among the strongest levers we have for improving
our overall environmental performance. However, it’s challenging to reach far upstream
Our materials decisions are into our value chain and influence the behavior of companies and individuals over
limited by what materials are which we have no direct impact. Therefore, we focus on product design, an area we do
available and their expected control. Decisions we make in the design phase determine the majority of a product’s
environmental impacts, and can have exponential effects up and down our value chain.
performance attributes. So These impacts are embedded in the creation of materials, from how much they weigh to
we also seek to understand transport, to how much water and energy are used in washing them, to what is left when a
and engage others who play product’s useful life is over. However, our materials decisions are limited by those that are
available and can their expected performance attributes. So, we also seek to understand
critical roles in the process and engage others who play critical roles in the process of developing, creating and
of developing, creating and bringing materials to market.
bringing materials to market.
Over the past several years, we have created scoring tools and indices that give our
product creation teams the information they need to make better decisions about
materials based on sustainability as well as performance characteristics. Two key
improvements help a design’s score: reducing waste by improving pattern efficiency,
and the choice of more sustainable options (e.g., recycled polyester rather than virgin
polyester). We tested and rolled out our updated footwear and apparel indices in FY12;
both include the NIKE Materials Sustainability Index (NIKE MSI). The NIKE MSI
measures energy and water use, waste generation and chemical use in materials. We have
communicated with and trained our material vendors to help them understand the NIKE
MSI and how they can improve their materials’ scores by providing more sustainable
options, which makes them more attractive to work with as a source for materials.
Collaborating with others is key to fueling disruptive innovation. Our strategy includes
strategic partnerships and making selective investments in breakthrough technologies
in the materials space. In 2012, for instance, we made a minority investment in
DyeCoo Textile Systems B.V., a Netherlands-based company that has developed the first
commercially available waterless textile dyeing machines. By using recycled carbon
dioxide, DyeCoo’s technology eliminates the use of water in the dyeing process. This
holds great promise for NIKE, since dyeing and finishing represents about 5% of water
use across the value chain. In 2013, we worked with Far Eastern New Century Corp. and
DyeCoo to launch the “dye house of the future” in Taiwan to optimize the dyeing process.
This new process, which we call ColorDry, provides the most consistent color results to
date and eliminates water and process chemicals from the dyeing process.
Decreasing materials use is also core to our approach. NIKE Flyknit technology
revolutionizes the age-old craft of shoemaking by knitting the shoe upper with individual
strands of yarn, which drastically reduces manufacturing waste and materials compared to
traditional cut-and-sew methods while providing strength and support where it’s needed
most. The Flyknit Racer’s laces are 30% recycled polyester, the upper is colored with
water-based inks, and the sock liner is made from recycled materials. We also use 100%
water-based adhesives in the midsole and outsole to reduce the use of volatile organic
compounds. We’re only just beginning to see the potential for Flyknit and we plan to
increase use of this technology in the coming years.
To continue to drive innovations like these, we have a Materials Science Innovation
function that explores the next generation of materials – for instance, non-petroleum-
based, low environmental impact feedstocks for apparel fabrics. This function also
considers how innovations in other fields – such as medicine and biomechanical
engineering – might transfer to our industry.
18OUR FY12/13 Sustainable Business Performance Summary
SUSTAINABILITY
STRATEGY
All of these efforts build on work we have done for years to identify and develop
environmentally preferred alternatives to our most-used materials, such as cotton,
polyester, leather and rubber. For example, we helped to establish the Leather Working
Group, which has created standards for better environmental management of leather
processing, and are Pioneer members of the Better Cotton Initiative.
See “Product” section for more information about our efforts and progress in this area.
NEW METHODS OF MANUFACTURING
PROTOTYPE AND SCALE Manufacturing is another major part of the equation. We estimate that more than
SUSTAINABLE SOURCING AND 2.5 million people work at various stages throughout our supply chain, including more
MANUFACTURING MODELS than 1 million in the factories we contract with directly. This makes manufacturing our
biggest area of impact on people. That’s not a new insight, and we have been working
for years to help raise the bar for working conditions, not only in our own supply base but
We envision lean across our industry. We have done this by developing and communicating our Code of
manufacturing that will Conduct and Code Leadership Standards, and by assessing suppliers’ compliance with our
deliver profitable growth requirements and legal standards. We have also worked with our suppliers to help them
develop their human resources management capacity so they can proactively manage and
through sustainable engage their workforce.
manufacturing and sourcing.
These efforts led to an insight that has been critical in our work with factories: that lean
manufacturing benefits factory owners and workers, increases productivity, reduces
environmental impacts, enhances our brand, and that workers are key to the successful
implementation of lean.
This integrated approach is reflected in how we assess performance. Factories are rated
using our Sourcing & Manufacturing Sustainability Index (SMSI), a component of our
Manufacturing Index, which puts sustainability considerations on equal footing with
quality, cost and on-time delivery, and is one tool we use to select factories with which
we do business. This approach serves as a way to identify factories to engage with more
collaboratively and to which we direct more attention, resources and business. The SMSI
incorporates results of other scoring tools that measure progress in worker health and
safety; labor compliance; human resources management; lean implementation; energy and
carbon management and other environmental sustainability issues.
We are now working to implement an enhanced vision of lean manufacturing as part of a
portfolio of initiatives we’re calling the “manufacturing revolution.” This transformation is
a response to significant trends in our supply chain, including advancements in technology
and engineering, and ongoing volatility in labor and materials pricing. It aims to redefine
both how our products are made and what they are made of. It includes innovations in
advanced technology, as well as manufacturing excellence and modernization.
As we look ahead to a new era of manufacturing, we also see opportunities to create a
more sustainable, stable supplier base. To implement the changes we’re anticipating,
the workers employed by our suppliers will need to learn and use multiple skills. During
2013, we conducted two pilot studies in Indonesia that tested both the technology and
human aspects of lean manufacturing implementation. The pilots measured changes
to productivity, cost and worker engagement, and found significant improvements in a
number of areas when lean manufacturing lines were compared to control lines. We are
collaborating with other organizations and contract factories to encourage them to look
at additional opportunities to improve the lives of workers outside the factories. See the
“Manufacturing” section for details on how we are working to meet our commitments
and define a new future for our supply chain. 19OUR FY12/13 Sustainable Business Performance Summary
SUSTAINABILITY
STRATEGY
BEYOND PRODUCTS
EXPLORE NEW SOURCES OF In 2009, we founded our Sustainable Business and Innovation Lab to focus on materials
REVENUE NOT BASED ON and manufacturing innovation partnerships as well as revenue sources that are decoupled
from constrained resources, including through digital services. Among other initiatives, the
CONSTRAINED RESOURCES Lab helped to fuel our vision to extend NIKE’s leadership in athletic footwear, apparel and
equipment into the digital realm of fitness, coaching and training services.
Our goal is to hardwire
sustainability into the One example of NIKE’s efforts that focuses on services is the NIKE+ digital platform that
enables athletes to track and analyze movement – for example, to share their workouts
way we operate and drive and calories burned and personal targets and performance. NIKE+ has grown into a
adoption of sustainable full ecosystem, delivered with different apps and services, with more than 18 million
innovation. members spanning the globe at the end of FY13. Collectively, members have run more
than 1 billion miles, the equivalent of 40,000 times around the earth at the equator.
This expanding business supports athletes’ health and wellness, opening additional
opportunities to NIKE.
In early 2013, we launched the first NIKE+ Accelerator, which hosted 10 companies for a
three-month, immersive, mentor-driven startup program. Leveraging the success of NIKE+,
participants worked to create products and services to inspire athletes across a broad
range of activity and health goals, including training, coaching, gaming, data visualization
and “quantified self.” Participating companies pitched their business concepts to more
than 1,000 investors, potential strategic partners and prospective collaborators. Through
the program, we received more than 1,000 requests for access to the NIKE+ development
platform.
STRENGTHENING OUR CORE
For more than 15 years, we have been on a journey of sustainability integration. This task
is essential. To achieve ongoing, profitable growth, sustainability considerations must be
deeply embedded throughout the company. At NIKE, sustainability is not just about vision
and values. It depends equally on having the systems, structures, people, responsibilities
and accountabilities in place to ensure our commitments are reflected in our day-to-day
business activities.
During the last two years, we have advanced business integration on several fronts. Some
changes relate to refining our internal organizational structures to more effectively drive
sustainable innovation. These include the following:
• The Sustainable Business & Innovation (SB&I) team focuses on a broad range of areas
including finding and deploying new chemistries, training supplier factories on energy
and water efficiency programs, partnering with product teams to promote the use of
more sustainable materials and designs, developing scenario planning tools, gathering
information about social and environmental performance within NIKE and its supply
chain, and evaluating and reporting that performance. The team also drives several
of our external engagement activities, collective action efforts and open innovation
agendas to accelerate and scale game-changing solutions. Importantly, SB&I became
a part of NIKE’s Innovation organization in 2013, streamlining the process of scaling
sustainability innovation throughout the company.
• The Materials Science Innovation function, which grew out of the sustainable product
research and design function within SB&I and focuses on sustainable materials, now
reports into NIKE’s product innovation team. It includes a dedicated sustainable
product R&D team, making it even better aligned with broader apparel and footwear
materials research.
20OUR FY12/13 Sustainable Business Performance Summary
SUSTAINABILITY
STRATEGY
NIKE INTEGRATION TIMELINE • The Sustainable Manufacturing Excellence team is formally aligned to both SB&I
For more than a decade, we have been and NIKE’s sourcing functions. This enables a strategic outlook for the future of
on a journey of sustainability integration. manufacturing and a holistic view of the impacts and capacity-building work done with
nikeresponsibility.com/timeline factories as well as joint planning for future growth.
• A new product sustainability team works directly with NIKE’s product groups to drive
sustainable innovation deeper into the company’s product creation processes and
pipeline.
Other recent changes reflect the deeper integration of several important processes and
activities throughout the company. For example:
• Our NIKE Apparel Sustainability Index and NIKE Footwear Sustainability Index have
become part of the standard tools used by our global product creation teams. This
ensures that design decisions take environmental factors into account.
• We integrated our Manufacturing Index which includes the Sourcing & Manufacturing
1990s: Received negative publicity for labor Sustainability Index into our sourcing selection and evaluation criteria. The Index
issues in supply chain assesses suppliers on relevant dimensions related to lean manufacturing, such as on-
1998: Established first VP of Corporate time delivery and defect rate. As a result, sustainability is a factor in all supplier ratings.
Responsibility • We created and launched a business simulation experience – NIKE 2021 – a half-
2001: Established Board of Directors Corpo- day strategy immersion in which participants adopt roles as chief executive, chief
rate Responsibility Committee
financial officer, and vice presidents in supply chain, product, brand, innovation and
2001: Published first standalone Corporate
Responsibility report sustainability. Together they compete against other teams to plot strategic investments
2006: Launched NIKE Considered Design and decisions that consider impacts to cost of materials and manufacturing, product
2006: Published first list of factories availability, revenue and net income. Nearly 2,000 employees from senior executives
contracted to produce NIKE Brand products to teams in product development, finance, supply chain and geographies have
(disclosing factory names and locations) participated. NIKE continues to evolve the experience and deliver it to more teams.
2007: Established scenario planning and trend • We have publicly discussed and published our perspective on the risks of climate
analysis
change and sustainability-related issues in broader forums. This illustrates the
2008: Established Project Rewire
(to connect impacts of sourcing increasing importance of sustainability issues to the company and our stakeholders.
with decision makers)
2009: Changed name of C orporate During 2013, NIKE also aligned community engagement activities more closely with our
Responsibility organization to Sustainable businesses and geographies. This embeds planning and performance tracking into the
Business & Innovation
(with corresponding shift in focus) appropriate business cycles and increases accountability.
2009: Established internal audit program
(outside SB&I) focused on oversight of factory As we integrate sustainability even more deeply throughout the company, the role of the
audits according to HSE standards SB&I team continues to evolve. Using a unique set of capabilities and expertise, the
2009: Established Sustainable Business & team focuses on activities that enable more sustainable decision making companywide
Innovation Lab (focused on closed loop and
manufacturing, and revenue sources decou- that often involves a longer time horizon than the typical business planning cycle. This
pled from constrained resources, especially includes:
through digital services) • Providing a holistic perspective on sustainability opportunities and risks
2012: Established non-financial disclosure • Working in partnership with business functions to set and deliver against companywide
committee with oversight of NIKE, Inc.
sustainability reporting sustainable innovation priorities
2012: Launched new set of sustainability • Delivering analysis and guidance on sustainability-related investments
targets, with input and buy-in from relevant • Building a center of excellence in sustainability data capture, analysis and disclosure
business groups and functions • Developing tools and capabilities such as environmental footprinting (see page 12),
2012: Released NIKE Materials Sustainability scenario planning (see page 15) and systems thinking (see page 23)
Index to the Sustainable Apparel Coalition
• Facilitating companywide sustainability target setting, performance measurement and
2012: Launched Flyknit
reporting (both internal and external)
2013: Launched MAKING App
2013: Harvard Business School and Stanford
Graduate School of Business both publish In addition to having the right structures in place, integration is also about engagement.
case studies on NIKE’s sustainability journey Everyone at NIKE has an important role to play in making the company sustainable
2013: Waterless dyehouse opens; and we encourage leaders and employees to grasp the issues and opportunities ahead,
ColorDry announced consider the sustainability implications of their decisions, and be accountable for their
actions.
21You can also read


