REGIONAL OVERVIEW OF FOOD SECURITY AND NUTRITION - ASIA AND THE PACIFIC 2018 - FAO
←
→
Page content transcription
If your browser does not render page correctly, please read the page content below
2018

    ASIA AND THE PACIFIC
     REGIONAL
  OVERVIEW OF
FOOD SECURITY
AND NUTRITION
      ACCELERATING PROGRESS
           TOWARDS THE SDGs
2018

    ASIA AND THE PACIFIC
     REGIONAL
  OVERVIEW OF
FOOD SECURITY
AND NUTRITION
      ACCELERATING PROGRESS
           TOWARDS THE SDGs
This flagship publication is part of THE STATE OF FOOD SECURITY AND NUTRITION series of the Food and Agriculture
Organization of the United Nations.

Recommended citation:
FAO. 2018. Asia and the Pacific Regional Overview of Food Security and Nutrition 2018 – Accelerating progress
towards the SDGs. Bangkok. License: CC BY-NC-SA 3.0 IGO.

The designations employed and the presentation of material in this information product do not imply the expression of any
opinion whatsoever on the part of the Food and Agriculture Organization of the United Nations (FAO) concerning the
legal or development status of any country, territory, city or area or of its authorities, or concerning the delimitation of its
frontiers or boundaries. The mention of specific companies or products of manufacturers, whether or not these have been
patented, does not imply that these have been endorsed or recommended by FAO in preference to others of a similar
nature that are not mentioned.

ISBN 978-92-5-130845-5
© FAO 2018

Some rights reserved. This work is made available under the Creative Commons Attribution-NonCommercial-ShareAlike
3.0 IGO licence (CC BY-NC-SA 3.0 IGO; https://creativecommons.org/licenses/by-nc-sa/3.0/igo).

Under the terms of this licence, this work may be copied, redistributed and adapted for non-commercial purposes,
provided that the work is appropriately cited. In any use of this work, there should be no suggestion that FAO endorses
any specific organization, products or services. The use of the FAO logo is not permitted. If the work is adapted, then
it must be licensed under the same or equivalent Creative Commons license. If a translation of this work is created,
it must include the following disclaimer along with the required citation: “This translation was not created by the Food
and Agriculture Organization of the United Nations (FAO). FAO is not responsible for the content or accuracy of this
translation. The original English edition shall be the authoritative edition.”

Any mediation relating to disputes arising under the licence shall be conducted in accordance with the Arbitration Rules of
the United Nations Commission on International Trade Law (UNCITRAL) as at present in force.

Third-party materials. Users wishing to reuse material from this work that is attributed to a third party, such as tables,
figures or images, are responsible for determining whether permission is needed for that reuse and for obtaining
permission from the copyright holder. The risk of claims resulting from infringement of any third-party-owned component
in the work rests solely with the user.

Sales, rights and licensing. FAO information products are available on the FAO website
(www.fao.org/publications) and can be purchased through publications-sales@fao.org.
Requests for commercial use should be submitted via: www.fao.org/contact-us/licence-request.
Queries regarding rights and licensing should be submitted to: copyright@fao.org.

COVER PHOTOGRAPH ©Shutterstock/Vietnam Stock Images
CONTENTS
Foreword...................................................................................................................................................... vii
Acknowledgements ................................................................................................................................ viii
Key messages ..............................................................................................................................................ix
Abbreviations and acronyms ...................................................................................................................x
The setting..................................................................................................................................................... 1
Part 1: Food security and nutrition in Asia and the Pacific: An update....................................... 5
Prevalence of undernourishment and experienced food insecurity.................................... 6
Prevalence of undernourishment................................................................................................7
Food insecurity as experienced by people............................................................................... 9
Malnutrition trends............................................................................................................................. 10
Stunting among children under five years of age.................................................................. 11
Wasting among children under five years of age...................................................................13
Overweight among children under five years of age............................................................. 17
Adult overweight and obesity.....................................................................................................21
Exclusive breastfeeding for infants under six months of age........................................... 22
Anaemia in women of reproductive age................................................................................. 22
Part 2: Food security and malnutrition: Drivers and determinants........................................... 27
Climate-related disasters and their impact................................................................................29
The nature and scale of the impact of climate related disasters..................................... 32
on agriculture, food security and nutrition
Consequences of climate-related disasters on food security........................................... 35
Responding to the challenge of climate-related disasters................................................38
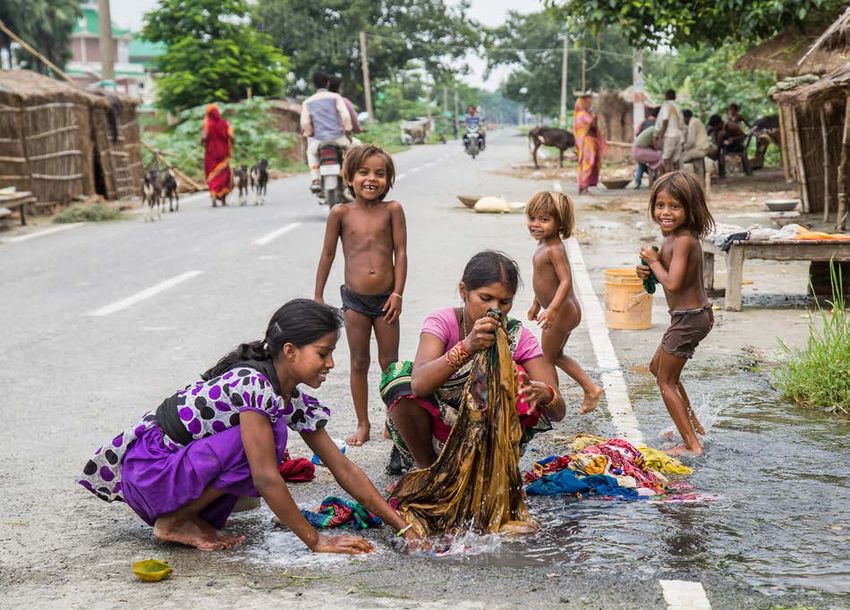
Water, sanitation and hygiene (WASH).........................................................................................42
WASH realities in Asia and the Pacific..........................................................................................45
Part 3: Urban malnutrition......................................................................................................................59
Urban food insecurity and malnutrition in Asia and the Pacific............................................61
Understanding urban food security and nutrition...................................................................63
Salient features of the urban food complex...............................................................................65
References.................................................................................................................................................. 72
BOXES, FIGURES AND TABLES

BOXES
Box 1: World health assembly six global nutrition targets for 2025 for maternal, infant and young child..........11
       nutrition and one NCD target
Box 2: Cost of diets in Asia and the Pacific.............................................................................................................................16
Box 3: Determinants of stunting in indonesian children: Evidence from a cross-sectional survey.................... 44
       indicate a prominent role for the wash sector in stunting reduction
Box 4: Water quality in cambodia undermining the full development of young children........................................ 50
Box 5: Swachh Bharat Abhiyan................................................................................................................................................. 53
Box 6: Urban governance of food issues in Seoul, Republic of Korea........................................................................... 66

FIGURES
Figure 1:        Prevalence of undernourishment in Asia and the Pacific................................................................................8
Figure 2: Prevalence and number of severely food insecure based on FIES, 2014 to 2017...................................10
Figure 3: Prevalence of stunting in children under five years of age in Asia and the Pacific................................ 12
Figure 4: Economic growth and progress in reduction of stunting rates...................................................................13
Figure 5: Prevalence of wasting in children under five years of age in Asia and the Pacific.................................14
Figure 6: Cost and affordability of healthy diets in selected countries.......................................................................16
Figure 7:        Coverage of 90+ iron folic acid supplements among pregnant women (by percent)...........................18
Figure 8: Prevalence of overweight in children under five years of age in 2000 and 2017.................................... 19
Figure 9: Growing burden of stunting and overweight among children under five years of age........................ 20
Figure 10: Prevalence of overweight only and concurrent stunting and overweight in selected countries..... 20
Figure 11: Trends in the prevalence of overweight and obesity....................................................................................... 21
Figure 12: Prevalence of exclusive breastfeeding in infants younger than 6 months in Asia and....................... 23
           the Pacific
Figure 13: Prevalence of anaemia in women of reproductive age in Asia.................................................................... 24
Figure 14: Prevalence of anaemia in women of reproductive age in the Pacific........................................................ 24
Figure 15: Trends in the occurrence of climatic hazards in the Asia-Pacific region................................................. 30
Figure 16: Total damage per disaster in Asia and the Pacific............................................................................................ 31
Figure 17: Distribution of total loss and damage in agriculture by three main sub-sectors in selected............ 34
           Asian countries
Figure 18: Proportion of households without access to an improved latrine and prevalence of child............... 44
           stunting in children aged 0-59 months in Indonesia
Figure 19: SDG 6 targets and indicators for drinking water, sanitation and hygiene................................................ 45
Figure 20: Regional drinking water trends...............................................................................................................................47
Figure 21: Safely managed drinking water (2015) in South Asia and East Asia and the Pacific.............................47
Figure 22: Access to safely managed drinking water by service level........................................................................... 48
Figure 23: Number of people without piped water supply in premises......................................................................... 49
Figure 24: Coliforms (CFU/100ml) at point of use................................................................................................................ 50
Figure 25: E. coli (CFU/100ml) at point of use....................................................................................................................... 50
Figure 26: Basic sanitation coverage in the Asia-Pacific region: 2015.......................................................................... 52
Figure 27: Proportion of populaton with at least basic sanitation by household wealth quintile......................... 53
Figure 28: Number of open defecators.................................................................................................................................... 54
Figure 29: Percentage of population accessing handwashing facilities...................................................................... 56
Figure 30: Population of Asia and the Pacific........................................................................................................................ 60
Figure 31: Prevalence of stunting in urban and rural areas by wealth quintiles........................................................ 63
Figure 32: Percent of female caregivers, aged 15-49 years, meeting minimum dietary diversity and............... 68
           consuming various foods, Marshall Islands
Figure 33: Urban population living in slums (2005 and 2014)........................................................................................... 71

TABLES
Table 1:      Trends in the prevalence of undernourishment and the number of undernourished people in.............8
              Asia and the Pacific
Table 2: Matrix of cross-country correlations among the eight indicators of food security and nutrition...... 25
Table 3: Average annual number of natural hazards and percent increase, 1992-1999 and 2009-2017........... 31
Table 4: Estimated damage and loss in ten PDNA reports reviewed............................................................................ 33
Table 5: Impact of climate-related shocks on employment and wages...................................................................... 36
Table 6: SDG defined service level for drinking water....................................................................................................... 46
Table 7: SDG defined service level for sanitation................................................................................................................. 51
Table 8: Prevalence of stunting, wasting, and overweight and obesity among under-five children.................. 62
         (as a percentage of the total under-five population)
Table 9: Some prominent features of the urban nutrition complex.............................................................................. 64
©FAO/Ishara Kodikara
FOREWORD

Progress in reducing undernourishment has slowed               health and water systems, sanitation and hygiene.
tremendously. FAO’s estimates show that the number             This report synthesizes a range of response measures
of hungry people has barely changed during the past            including early warning systems, insurance and
two years, making it increasingly difficult to achieve         safety nets, and highlights the need for an integrated
the Zero Hunger target of SDG 2. The situation is              package of these measures aimed at strengthening
similarly challenging in nutrition and health areas,           the resilience of communities and households.
where a large majority of countries in the region risk
missing the SDG and World Health Assembly targets.             ‘Urban Malnutrition’ is the special theme of this year’s
These developments in food security and nutrition              report. Experience across the world has shown that
are at odds with the region’s continuing high level of         while urbanization promotes social and economic
economic growth.                                               advancement, and improves quality of life, poorly
                                                               planned and managed urbanization can also have
The other sad reality is that an unacceptably large            severe negative consequences for food security and
number of children in the region continue to face              nutrition. This report synthesizes our understanding of
the multiple burden of malnutrition despite decades            urban food environments, which, due to their heavier
of economic growth. This is a colossal human loss              reliance on markets, complex logistics and distribution
given the association between undernutrition and               systems, and heterogeneous and mobile populations,
poor cognitive development, with severe lifelong               require more nuanced and carefully articulated
consequences for the future of these children.                 responses. Local city and municipal governments
Rapid growth in the number of overweight children              must play a central role in improving urban food
is also a growing concern in the region with serious           systems by providing essential urban infrastructure,
consequences for children’s future health and                  improving food systems, and promoting targeted
well-being. Investing in measures to eliminate child           interventions. Food, nutrition and health-related
malnutrition, both overweight and undernutrition,              agencies need to join hands with them in
is an economic and moral imperative, and we all                strengthening their technical capacity in these areas.
need to face this challenge together.
                                                               With four UN agencies coming together for the first
At the same time, the region is increasingly impacted          time in the Asia-Pacific region in reporting on the
by climatic shocks. Besides damaging farming                   progress towards the elimination of hunger and
infrastructure and properties, such shocks have                malnutrition, we hope to better serve the member
significant impacts on economic access to food by              countries in the coming years. It is our hope that this
disrupting jobs and cutting wage incomes, with the             report will contribute to a more informed dialogue
impact disproportionately higher on the poor. Studies          and more concerted action by all partners in
also show such shocks worsen child malnutrition and            accelerating progress towards the goal of a healthy
health by damaging vital infrastructure supporting             and hunger-free Asia and the Pacific.

Kundhavi Kadiresan                      Karin Hulshof                                  Jean Gough
Assistant Director General              Regional Director                              Regional Director
and Regional Representative             East Asia and the Pacific                      South Asia
for Asia and the Pacific                United Nations Children’s Fund                 United Nations Children’s Fund
Food and Agriculture Organization
of the United Nations

David Kaatrud                           Shin Young-soo                                 Poonam Khetrapal Singh
Regional Director                       Regional Director                              Regional Director
for Asia and the Pacific                for the Western Pacific                        for South East Asia
World Food Programme                    World Health Organization                      World Health Organization

                                                         vii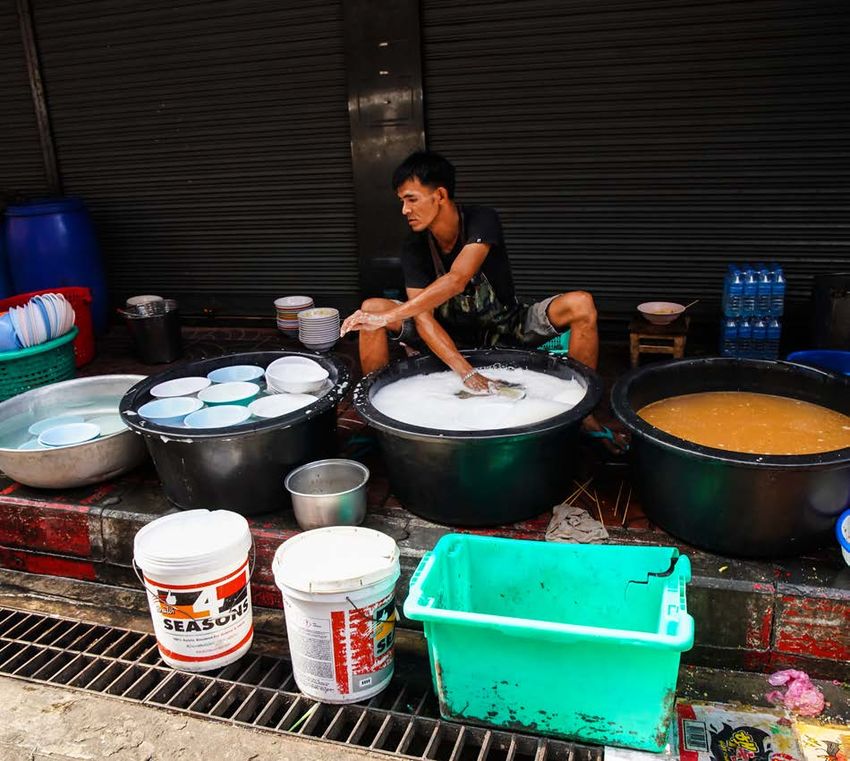
ACKNOWLEDGEMENTS
This report was jointly prepared by the Food and Valuable comments and inputs on the report were
Agriculture Organization Regional Office for Asia and provided by Rosa Rolle, Carlos Cafiero, Cindy
the Pacific (FAORAP), United Nations Children’s Fund, Holleman, Klaus Grunberger, Trudy Wijnhoven,
East Asia and Pacific Regional Office (UNICEF EAPRO) Giovanni Carrasco Azzini, Abdul Sattar, and Ann
and the Regional Office for South Asia (UNICEF ROSA), Kepple (FAO headquarters), Sridhar Dharmapuri,
the World Food Programme Regional Bureau for Beau Daemen, Hang Pham, Kastubh Devale, Sumiter
Asia and the Pacific (WFP RBB) and the World Health Broca, Clara Park, Xiangjun Yao and Yurdi Yasmi
Organization South East Asia Regional Office (FAORAP) and Justin Dittmeier, Shelly Sayagh and
(WHO SEARO) and the Western Pacific Regional Yingci Sun (WFP RBB).
Office (WHO WPRO).
At FAORAP, Allan Dow helped develop the key
Under the overall leadership of Kundhavi Kadiresan, messages and Rachel Oriente, Kanokporn
Jean Gough, Karin Hulshof, David Kaatrud, Poonam Chansomritkul, Surawishaya Paralokanon, and
Khetrapal Singh and Shin Young-soo, the technical Poranee Ngarmtab coordinated the publishing
coordination of the publication was carried out by process with the valuable support of Jessica
Vinod Ahuja in collaboration with Christiane Rudert, Matthewson and other colleagues at FAO
Jessica Blankenship, Siemon Hollema, Angela de headquarters.
Silva, Harriet Torlesse, and Juliawati Untoro.
Copy editing, proofreading and layout were provided
The core writing team comprised Vinod Ahuja, by QUO Global in Bangkok.
Ramesh Sharma, Sunniva Bloem and David Dawe
(FAORAP); Jessica Blankenship, Chander Badloe, For more information about this publication,
Anu Paudyal Gautam and Dorothy Foote please contact FAO-RAP@fao.org.
(UNICEF EAPRO); Harriet Torlesse (UNICEF ROSA),
Serena Chong (WFP RBB) Angela de Silva
(WHO SEARO), Juliawati Untoro and Peter
Hoejskov (WHO WPRO).
viii
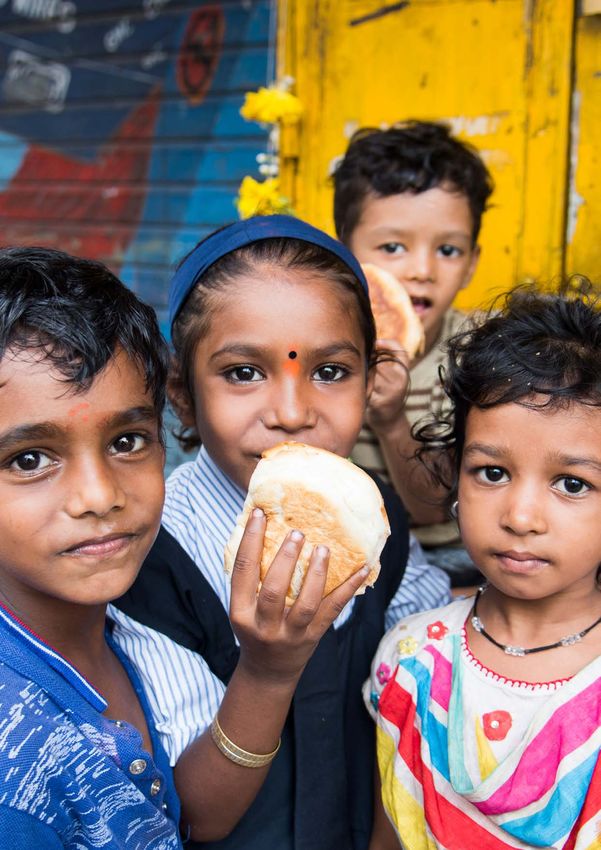
99KEY MESSAGES
• The SDGs provide governments and other sector alone and requires shared actions
stakeholders with an unprecedented opportunity to implemented through multi-sectoral approaches
reduce the serious burden of food insecurity and that cut across food systems, health, sanitation,
malnutrition in Asia and the Pacific. But the progress social protection and education.
toward achieving the SDG 2; Zero Hunger targets
continues to be slow, and immediate and urgent • The frequency of climate-related disasters and
actions need to be taken. the damage they cause have been rising in the
region, negatively affecting food security and
• FAO estimates that some 486 million people remain nutrition. There is a need for continued research
undernourished in Asia and the Pacific, and little to mitigate the impact of climatic shocks, further
changed from the past two years. Progress has advance risk-informed and shock-responsive social
stagnated in all sub-regions. protection systems and strengthen the resilience of
livelihoods and food systems to climate variability
• More than half of the world’s malnourished children and extremes.
live in Asia and the Pacific. It is also home to the
fastest growing prevalence of childhood obesity in • Limited or poor access to safe water, sanitation
the world. This paradox is attributed to a nutrition and hygiene (WASH) is one of the key drivers
transition with children increasingly exposed to of malnutrition among children. To contribute
cheap and convenient unhealthy processed foods substantially to reducing malnutrition, WASH
rich in salt, sugar and fat but poor in essential improvements and coverage must be heightened
nutrients. This double burden of malnutrition sees and implemented throughout the whole community.
undernourished and overweight children living in the
same communities and households and it can even • In urban areas, undernutrition is high, and obesity
occur in the same child. is rising rapidly. Given rapid rates of urbanization,
it is important to ensure that rapidly expanding cities
• There are multiple causes of child malnutrition – in the Asia-Pacific region are planned in an inclusive,
poverty, poor access to food markets and health sustainable and nutrition-sensitive manner. Local
services, and poor knowledge and practices for city governments and urban planners must become
nutrition, health, water and sanitation. This the new nutrition partners and nutrition policy
complexity means that eradicating child advocators in tackling these challenges.
malnutrition cannot be addressed through one
ixABBREVIATIONS AND ACRONYMS
ASEAN Association of Southeast Asian Nations
BMI body mass index
CERF Central Emergency Response Fund
CGIAR Consultative Group on International Agricultural Research
CoD Cost of the Diet
CREWS Climate Risk and Early Warning Systems
EM-DAT Emergency Events Database
ESCAP Economic and Social Commission for Asia and the Pacific
EWEA Early Warning–Early Action
FAO Food and Agriculture Organization
FbF Forecast-based Financing
FIES Food Insecurity Experience Scale
IUGR intrauterine growth restriction
JME WHO/UNICEF/World Bank Group Joint Child Malnutrition Estimates
JMP WHO/UNICEF Joint Monitoring Programme on Drinking Water, Sanitation and Hygiene
MDG Millennium Development Goal
NCD non-communicable disease
PDNA Post-Disaster Needs Assessment
PoU prevalence of undernourishment
SAARC South Asian Association for Regional Cooperation
SAM severe acute malnutrition
SDG Sustainable Development Goal
SUN Scaling Up Nutrition
UN United Nations
UNICEF United Nations Children’s Fund
WASH water, sanitation and hygiene
WFP World Food Programme
WHA World Health Assembly
WHO World Health Organization
WMO World Meteorological Organization
99
xTHE SETTING
Recent trends in food insecurity and malnutrition and living in larger households with more children
in Asia and the Pacific are at odds with the region’s (World Bank, 2016a). It finds, based on data from
high economic growth. The region has maintained household surveys, that the share of the total poor
its leadership position as the economically living in rural areas was 75 percent in East Asia and
fastest-growing region with declining poverty. the Pacific, and 83 percent in South Asia. Poverty
However, progress towards the targets for the 2030 rates are more than three times higher among rural
Sustainable Development Goals (SDGs) is less than than urban residents and agricultural workers are over
satisfactory. The 2016 Asia-Pacific regional report four times more likely to be poor relative to people
on Food Security and Nutrition indicated that only employed in other sectors of the economy.
a handful of countries were likely to meet the
2030 SDG 2 target with the recent rates of hunger This means that agriculture and the rural economy
reduction (FAO, 2016a). Data for the last few years still deserve the attention they received in the past
show that, rather than improving, the rate of hunger despite the shrinking share of agriculture in national
reduction is slowing down and even reversing for economies. The 2016 edition of the FAO Asia-Pacific
some countries. The situation is similarly challenging regional report had pointed out that most countries
for a number of other nutrition indicators and a in the region were under-spending on agriculture
large majority of countries in the region risk missing relative to its contribution in the economy. Likewise,
the SDG 2 and World Health Assembly (WHA) global public expenditures on agricultural research, a
nutrition targets. vital driver of productivity growth, were also below
recommended levels in a large number of
Poverty and inequity remain the principal causes countries, jeopardizing the ability of countries to
of hunger and malnutrition. According to the World adequately provide safe and nutritious food to the
Bank’s Poverty and Shared Prosperity 2016 report, region’s growing and rapidly urbanizing population
the global poor are predominantly rural, mostly (FAO, 2016a).
employed in agriculture, young, poorly educated,
©Shutterstock/elwynn
1The role of agriculture in Asia is transforming when requires more integrated monitoring based on a wide
it comes to meeting the food security and nutrition range of indicators. Accordingly, this year, the regional
challenge. It is no longer sufficient to see agriculture offices from four UN agencies – FAO, UNICEF, WFP
as an independent sector with the objective of and WHO – join hands in an attempt to present a more
maximizing production. Agriculture has become integrated picture of the status and determinants of
just one part of an integrated and more globalized food insecurity and malnutrition in the Asia-Pacific
food system. This can pose a huge challenge for region, drawing from their specialized yet
producers (particularly for small farmers) in many complementary knowledge and expertise.
countries where even the most efficient producers
can be excluded from parts of the value chain as The structure of this report is as follows:
they may lack the mechanisms to integrate into a
new marketplace. This requires food and agricultural • Part I reviews food security and nutrition in the
systems to improve their inclusiveness by linking region covering multiple indicators, including
smaller producers (farmers, foresters and fishers, (i) indicators of hunger and food insecurity, the
and their respective organizations) with agribusiness prevalence of undernourishment (PoU), and
enterprises and supply chains for more effective the Food Insecurity Experience Scale (FIES);
participation in rapidly changing global, regional and (ii) malnutrition among under-5 children –
national markets. This also requires a more enhanced stunting, wasting and overweight/obesity; and
understanding of food flows and an appreciation (iii) obesity among adults, anaemia in women of
of nutritional needs so as to inform more rational reproductive age, and exclusive breastfeeding.
management of local, regional and global food The discussion in this part also integrates the
systems. narrative on the drivers of malnutrition and
ongoing innovations and responses at the
While sustainable food systems remain at the core country level.
of efforts towards ending hunger and all forms of
malnutrition, it is clear that malnutrition derives from • Part II delves deeper into two selected themes,
a series of interlinked factors, including child feeding each covering a set of drivers (i) climatic shocks
practices, dietary practices, women’s education, and disasters, and their linkages with food
sedentary lifestyles, enabling sector policy security and nutrition, and (ii) the state of access
environments, institutional stability, quality health to water, sanitation and hygiene.
care, sanitation and hygiene. Given its multiple
dimensions and drivers, it is quite clear that a • Finally, in view of rapid urbanization in the
response strategy dealing with food insecurity and region and its implications for food systems and
nutrition requires a comprehensive and integrated nutrition, Part III presents a review of issues
understanding of the dynamics at play, as well as and responses on the special topic of Urban
a coordinated package of interventions. This also Malnutrition.
99
2©Shutterstock/CRS PHOTO
©UNICEF/Giacomo Pirozzi
Part   1
FOOD SECURITY
AND NUTRITION
IN ASIA AND
THE PACIFIC:
AN UPDATE
Part    1

FOOD SECURITY AND NUTRITION
IN ASIA AND THE PACIFIC:
AN UPDATE

   ©FAO/Sean Gallagher

Achievements in the Asia-Pacific region have a                  PREVALENCE OF
strong bearing on the global progress towards SDGs.
Past progress in reducing poverty, hunger and
                                                                UNDERNOURISHMENT AND
undernutrition notwithstanding, recent trends raise             EXPERIENCED FOOD
serious concerns. Progress in hunger reduction is               INSECURITY
slowing down and most countries in the region are off
course to achieving a number of targets under SDG 2:            PoU and FIES are two indicators used for monitoring
End hunger, achieve food security and improved                  progress in hunger reduction under the SDGs. PoU
nutrition and promote sustainable agriculture. The              was also the main indicator used to monitor the World
region is also failing in promoting good sanitation, and        Food Summit target and the Millennium Development
child and maternal nutrition practices. At the same             Goal (MDG) 1C target: Eradicate extreme hunger and
time, obesity prevalence is rising, leading to a growing        poverty. The PoU estimates are based on average
double burden of malnutrition.                                  national dietary energy supply, minimum dietary
                                                                energy requirements for an average individual, and a
                                                                measure of the distribution of food within a country.

                                                           99
                                                           6
©FAO/Hoang Dinh Nam
Unlike many other indicators of hunger and food in the PoU in both percentage and absolute terms.
insecurity derived from national food balance, Unfortunately, recent estimates of the PoU and FIES
household food consumption or similar data, the confirm continued signs of worsening hunger and
FIES establishes a metric for the severity of the food food insecurity in the region as reviewed below.
insecurity condition of individuals or households.
The metric is calculated based on people’s direct
Prevalence of undernourishment
responses to questions regarding their access to
food of adequate quality and quantity. The FIES is As per the latest FAO estimates, there has been
an experience-based scale indicator which captures virtual stagnation in the number of undernourished
the access dimension of food security.1 people (in terms of dietary energy supply) in Asia and
the Pacific between 2016 and 2017 (see Figure 1). In
The 2017 Asia-Pacific regional report noted a 2017, the number of hungry people in the region stood
substantial slowdown in the rate of reduction in the at 486.1 million against 486.5 million in 2016. Within
PoU during the period 2010-2015 compared with the Asia-Pacific sub-regions, South Asia continued
the five years before that (FAO, 2017a). Furthermore, to witness some progress in reducing the number
the projections for 2016 had shown that both the of undernourished people, although clearly not
PoU and the total number of undernourished people sufficient to achieve the zero hunger target by 2030.
may have actually begun to rise in the region. During In South Asia, the number of undernourished people
2015-2016, South Asia and East Asia sub-regions declined by less than a million between 2016 and
were estimated to have experienced a reduction in 2017. East and Southeast Asia witnessed no
the absolute number of undernourished people, while improvement and Oceania added another 200 000
in Southeast Asia there was an estimated increase people (see Table 1).
1
Further details on FIES can be found at http://www.fao.org/in-action/voices-of-the-hungry/en/#.Wv0-UU1lLcs
7REGIONAL OVERVIEW OF FOOD SECURITY AND NUTRITION ASIA AND THE PACIFIC 2018
FIGURE 1: PREVALENCE OF
UNDERNOURISHMENT IN Number of undernourished people
ASIA AND THE PACIFIC Prevalence of undernourishment
19 700
Number of undernourished people (million)
Prevalence of undernourishment (percent)
18
650
17
600
16
15 550
14
500
13
450
12
11 400
2005 2006 2007 2008 2009 2010 2011 2012 2013 2014 2015 2016 2017
TABLE 1: TRENDS IN THE PREVALENCE OF UNDERNOURISHMENT AND THE NUMBER OF
UNDERNOURISHED PEOPLE IN ASIA AND THE PACIFIC
PREVALENCE OF UNDERNOURISHMENT NUMBER OF UNDERNOURISHED PEOPLE
(PERCENT) (MILLION)
2005 2010 2015 2016 2017 2005 2010 2015 2016 2017
Asia and 17.7 13.8 11.6 11.5 11.4 667.1 550.2 486.8 486.5 486.1
the Pacific
East Asia 14.1 11.2 8.5 8.5 8.5 219.1 178.4 138.3 139.5 139.6
South Asia 21.5 17.2 15.6 15.1 14.8 339.8 293.1 284.3 278.1 277.2
Southeast Asia 18.1 12.3 9.3 9.9 9.8 101.7 73.7 59.2 63.6 63.7
Oceania 5.5 5.2 6.3 6.6 7.0 1.8 1.9 2.5 2.6 2.8
99
8PART 1:
FOOD SECURITY AND NUTRITION IN ASIA AND THE PACIFIC: AN UPDATE
©Shutterstock/clicksabhi
Although similar trends were signalled in the 2016 and Experience-based food security indicators
2017 reports, the numbers were small and it was not complement the existing suite of food security
clear if that marked the beginning of an upward trend indicators by better capturing the access dimension
or it was just a transitory uptick. Indeed, both East and of food security. People may be in a situation of food
Southeast Asia experienced rapid reductions in the insecurity yet still meet their dietary energy needs
number of undernourished people during 2005-2015. by consuming low-quality, energy-dense foods, for
However, both sub-regions have experienced rising example, or cutting back on other basic needs, with
hunger since 2015 (see Table 1). While hunger levels potentially negative consequences for their health
have continued to decline in South Asia, the rate of and general well-being.
reduction has slowed down considerably in recent
years. These trends are symptomatic of serious The indicators can also provide disaggregated
structural factors adversely affecting the agricultural information, such as the severity of food insecurity
sector, including the impact of climate and by place of living (e.g. rural and urban) and gender
weather-related extreme events. We return to a when data is collected through adequately
discussion on climate-related natural disasters and representative surveys. When available, data from
agriculture sector growth in Part II of the report. national household surveys, including a module on
Suffice it to say at this point that if the average annual food insecurity experiences that is compatible with
decline of PoU continues as it has been since the year the FIES, are used to calculate the prevalence of
2000, the region will surely miss the SDG 2 target of food insecurity.
zero hunger.
The updated estimates of Severe Food Insecurity
(FIsev) are presented in Figure 2. As can be seen,
Food insecurity as experienced
the trends over the last three years broadly mirror
by people
the trends in the PoU, reconfirming the worsening
While the PoU is strongly influenced by the trends in of hunger and food insecurity in the region. Relative
aggregate food availability derived from national-level to 2017, almost 20 million more people experienced
food balance sheets, FIES, a new source of additional severe food insecurity compared to 2016.3 The
evidence on the state of food security, is based on sub-regional trends also mirror the PoU trends.
direct responses regarding people’s access to This consistency is remarkable considering the
adequate food. FAO has been producing FIES methodological differences. At a more general level,
estimates since 2014 through data collected by the this reflects the continuing and increasing difficulties
Gallup World Poll in over 140 countries and territories.2 people are experiencing in accessing sufficient food.
2
Further details of FIES, including the details of the methodology, can be found at http://www.fao.org/in-action/voices-of-the-hungry/en/#.V8Zfkvl96V4
3
Severe food insecurity is measured by the deprivation of food, wherein people might have gone without eating for the whole day because they could not afford to buy
food due to a lack of money or other resources.
9REGIONAL OVERVIEW OF FOOD SECURITY AND NUTRITION ASIA AND THE PACIFIC 2018
FIGURE 2: PREVALENCE AND NUMBER OF
SEVERELY FOOD INSECURE BASED South Asia Southeast Asia
ON FIES, 2014 TO 2017 East Asia
Prevalence of severe food insecurity Number of severely food insecure people
16 250
Number of severely food insecure people (millions)
Prevalence of severe food insecurity (percent)
14
200
12
10
150
8
100
6
4
50
2
0 0
2014 2015 2016 2017 2014 2015 2016 2017
MALNUTRITION TRENDS A multiple burden of malnutrition where
undernutrition and overweight, and associated NCDs
SDG 2, Target 2.2, calls for an end to “all forms of coexist is a serious and growing concern in Asia and
malnutrition” by 2030. Malnutrition covers a broad the Pacific, with an increasing prevalence of both
spectrum ranging from severe undernutrition to undernutrition and overweight found in countries,
overweight and obesity. It affects populations households and even the same person.
throughout the lifecycle, from conception through
childhood and into adolescence, adulthood and older TRACKING MALNUTRITION
age. Undernutrition can be acute – resulting from an To track global progress on ending malnutrition,
immediate crisis in food access, inadequate nutrient several nutrition indicators are measured consistently
intake and/or infection – or chronic, with cumulative – three that form part of the SDG monitoring
deleterious effects over long periods. At the other framework, six that refer to global nutrition targets
end of the spectrum, overweight and obesity can be agreed by the WHA for 2025, and one from the WHO
attributed to an excessive intake of calories, and/or global voluntary NCD targets (WHO, 2013; WHO, 2014a)
limited energy expenditure resulting in increased (see Box 1).4 These indicators are described in the
body weight and fat accumulation, which may following section to highlight the multiple burdens
increase the risk of diet-related non-communicable of malnutrition that affect the region and progress
diseases (NCDs) and other health problems. towards achieving global targets.
4
The global nutrition targets have now been extended to 2030 (http://apps.who.int/gb/ebwha/pdf_files/WHA71/A71_22-en.pdf).
99
10PART 1:
FOOD SECURITY AND NUTRITION IN ASIA AND THE PACIFIC: AN UPDATE
BOX 1: WORLD HEALTH ASSEMBLY SIX GLOBAL NUTRITION TARGETS FOR 2025 FOR
MATERNAL, INFANT AND YOUNG CHILD NUTRITION AND ONE NCD TARGET
WHA targets
1. Stunting 40 percent reduction in the number of children under five who are stunted
2. Anaemia 50 percent reduction of anaemia in women of reproductive age
3. Low birth weight 30 percent reduction in low birth weight
4. Childhood No increase in childhood overweight
overweight
5. Breastfeeding Increase the rate of exclusive breastfeeding in the first six months up to at
least 50 percent
6. Wasting Reduce and maintain childhood wasting to less than 5 percent
NCD target
Adult obesity Halt the rise in obesity
Source: WHO, 2014a; FAO, 2018a.
factors affect a child’s future labour productivity,
Stunting among children under five
income earning potential and social skills later in
years of age
life with consequences beyond the individual level.
Stunting is a reflection of children failing to achieve If the prevalence of stunting is widespread, it can
their genetic potential for height, with stunted have dramatic consequences on a country’s human
children too short for their age. Stunting is the and economic development with an estimated cost
cumulative effect of the irreversible physical and benefit of USD 16 in economic return for every USD 1
cognitive damage caused by chronic undernutrition, invested in nutrition interventions (McGovern et al.,
repeated infections and inadequate child care and 2017; and Hoddinott et al., 2013).
feeding practices, which can be prevented by
improving nutrition for women and children in the In 2017, 79 million children under five years of age
first 1 000 days – from conception through the first were stunted in the Asia-Pacific region (UNICEF, WHO
two years of life. Children who are stunted before and World Bank Group, 2018a; Development Initiatives,
the age of two are at risk of failing to reach their 2017). While prevalence of stunting is very high in
developmental potential with higher risk of disease the Pacific, the largest number of stunted children is
and reduced cognitive and physical development in South Asia with 61 million children suffering from
that can affect their learning potential. Early stunting stunted growth (see Figure 3). China, Mongolia and
may also increase a child’s risk of being overweight Tonga have a low prevalence of stunting, while all
and developing NCDs during adolescence and other countries in the region have a medium to a very
adulthood (Victora et al., 2008). These combined high level of stunting as defined by WHO.5
5
Country prevalence of stunting was obtained from the UNICEF/WHO/World Bank Group Joint Child Malnutrition Estimates 2018 edition and updated for recent
published surveys from Mongolia, the Republic of the Marshall Islands and Lao PDR.
11REGIONAL OVERVIEW OF FOOD SECURITY AND NUTRITION ASIA AND THE PACIFIC 2018
FIGURE 3: PREVALENCE OF STUNTING IN
CHILDREN UNDER FIVE YEARS OF AGE ≥30% – WHO category: very high prevalence
IN ASIA AND THE PACIFIC 20-30% – WHO category: high prevalence
10-20% – WHO category: medium prevalence
60
Percent of under-five children
50
40
30
20
10
0
C ia ( sia
n (2 )
Th va (20 )
Sr ilan (20 )
M an (2 )
M ive (20 )
Vi ys (20 )
So Na (20 )
Ko th (2 6)
a st 5)
M an PR sia
So C m tu 12)
on bo 01 5)
Ph sla a ( 16)
( )
o s ( 5)
ut (2 )
al So (2 7)
an A )
Ba N ds sia
In ade l (2 7)
ne h ( 6)
In a (2 4)
( )
a ist ista an )
N an n ia
m in -2 )
-L a 3)
(2 )
3)
et ia 09
6
al s 16
sl th 0
pp s 14
te 10
5
Tu ga 013
a lu 12
i L d 07
Bh DR 015
pu k n ce 5
ia 013
Ti Gu 012 13
an 01
a 01
al ka 01
re ea 01
(2 1
La ine 201
na 01
si 201
u m 1
O 201
do s 01
or e 01
01
l I u 01
di 5-
ili nd 20
lo am ar (20
0
2 20
es (20
go st A
V D A
ng ep (2
P 2
hi 2
ya u (2
ew ( (
on Ea
l
d
n a
To
a
d
l
a
I
M
Pa P gh
sh
m
Af
a
ar
M
Source: Country prevalence of stunting obtained from the UNICEF, WHO and World Bank Group Joint Child Malnutrition
Estimates 2018 edition and updated for recent published surveys from Mongolia, the Republic of the Marshall Islands
and Lao PDR; regional estimates obtained from the Global Nutrition Report 2017 (Development Initiatives, 2017).
While the levels are high, the region has made good registered rapid economic growth in recent years also
progress in reducing stunting. The largest reduction observed, on average, more rapid declines in stunting
has been noted in East Asia with a 71 percent rates. Similar evidence is also available from some
reduction between 2000 and 2016 (UNICEF, WHO in-country studies. While it is understood that income
and World Bank Group, 2018a). On average, stunting growth is only one of the many factors that determine
has reduced by about 30 percent in both South and nutritional outcomes, it is evident from such analysis
Southeast Asia while no reduction was evident in the that along with increased coverage of targeted
Pacific. While progress varies in the region, only two nutrition interventions, household incomes have to
countries, Bangladesh and Mongolia, are currently on rise, especially in rural areas, to accelerate progress
track to meet the WHA 2025 target. Several countries, against undernutrition. As can be seen from Figure
such as Nepal, are making progress on stunting 4, countries such as Bangladesh, Mongolia, Nepal,
reduction. However, the current rate of reduction is Thailand and Viet Nam did better in reducing stunting
insufficient to meet the target. than what the average economic growth predicted,
whereas countries below the line performed worse
Over the long term, it is obvious that higher levels than was predicted by economic growth. Such
of per capita income may help to improve nutrition variability in performance means there is ample
outcomes via improvements in the composition of opportunity to build on the experiences within the
diets. As can be seen from Figure 4, countries that region to accelerate progress.
99
12PART 1:
FOOD SECURITY AND NUTRITION IN ASIA AND THE PACIFIC: AN UPDATE
FIGURE 4: ECONOMIC GROWTH AND PROGRESS IN
REDUCTION OF STUNTING RATES R2 = 0.3587
12
10
Mongolia
Average annual rate of reduction
in the prevalence of stunting
8
China
6
4 Viet Nam
Bhutan
Nepal Bangladesh Cambodia
Thailand Lao PDR Myanmar
2
Indonesia India
Philippines Timor-Leste
0 Malaysia Sri Lanka
Pakistan
Vanuatu
-2
Papua New Guinea
-4
0 1 2 3 4 5 6 7 8 9 10
Average annual growth in per capita income
Source: Based on the per capita income data from World Development Indicators and stunting data from
UNICEF/WHO/World Bank Group Joint Child Malnutrition Estimates database.
Beyond economic growth, the drivers of child Reducing child stunting in Asia and the Pacific
stunting vary from country to country and even within requires a multi-sectoral approach to deliver
countries. In an analysis of the major drivers of child interventions at critical periods during the first one
stunting in South Asia, Aguayo and Menon (2016) thousand days between a woman’s pregnancy and
found the key drivers of child stunting to be poor her child’s second birthday. Preventative actions to
dietary quality and quantity for children under two address child stunting include ensuring that pregnant
years, poor nutrition of women before and during and lactating mothers receive prenatal care and are
pregnancy, and poor sanitation and hygiene adequately nourished with a diverse diet, that infants
practices in households and communities. Further, receive exclusive breastfeeding during the first six
multi-country analysis in Afghanistan, Bangladesh, months of life, and that complementary foods are
India, Nepal and Pakistan confirmed the primary available, affordable and fed to children aged 6-23
importance of both good maternal nutrition and months in adequate quantities, quality and variety. To
appropriate child feeding practices with timely prevent infections and illnesses that can contribute
introduction of diverse complementary foods (Kim, to child stunting, interventions to improve access to
et al., 2017). Similar findings were observed in safe water are essential, as well as initiatives focused
Southeast Asia and the Pacific, with poor maternal on ending open defecation practices, encouraging
nutrition being a major driver of stunting in Myanmar the use of improved sanitation facilities and improving
and the Republic of the Marshall Islands, and poor basic hygiene practices. It is imperative to have
sanitation practices being a leading driver in specific policies and programmes in place to improve
Indonesia (Torlesse et al., 2016). While not addressed the availability and affordability of nutritious foods,
as a direct driver of stunting in these analyses, child feeding practices, women’s nutrition, and
household food security and access to affordable household and community sanitation and hygiene
nutritious foods remain a vital component of good (WHO, 2014d; FAO and WHO, 2014).
dietary quality for children and women.
13REGIONAL OVERVIEW OF FOOD SECURITY AND NUTRITION ASIA AND THE PACIFIC 2018
The Asia-Pacific region has the highest prevalence
Wasting among children under five
and burden of wasted children in the world, with
years of age
nearly one in ten children at an increased risk of death
Childhood wasting is a reflection of acute malnutrition due to wasting. The largest burden of wasting is found
in children, with wasted children being too thin for in South Asia where more than half of all wasted
their height. It occurs when children rapidly lose children in the world live. An estimated 15.4 percent
weight and is often the result of illness coupled with of children under five years of age in South Asia, 9.4
inadequate care and feeding practices with diets percent in the Pacific, 8.9 percent in Southeast Asia
that do not meet the child’s nutritional needs. and 1.9 percent in East Asia are wasted at any given
Wasting, particularly prolonged severe wasting, is a time (Prado and Dewey, 2014). This is equivalent to
life-threating condition that has serious adverse 67 percent (35 million) of the total number of wasted
effects on the growth and brain development of children globally. At the country level, the prevalence
children (UNICEF, WHO and World Bank Group, 2018a). of wasting is above the threshold of public health
As a global target in the SDGs and a key indicator in concern (>5 percent) in three out of every four
the WHA 2025 global nutrition targets, wasting has countries in the region (see Figure 5).
attracted growing calls for accelerated prevention and
treatment efforts. However, global progress towards
the WHA 2025 target to reduce and maintain wasting
to less than 5 percent has been slow or absent.
FIGURE 5: PREVALENCE OF WASTING IN
CHILDREN UNDER FIVE YEARS OF AGE ≥15% – WHO category: very high prevalence
IN ASIA AND THE PACIFIC 10-15% – WHO category: high prevalence
5-10% – WHO category: medium prevalence
25
20
15
Percent
10
5
0
6)
al va t A )
Ko sla (2 ia
a s 7)
nu R ( 17)
Th ng (20 )
ai a 15)
Vi uta (20 )
ya N (2 )
So P m m 10)
on pi 01 )
So lan (20 )
h (2 )
gh P t )
is (2 a
n 17)
bo Pa 13)
N a ic
ki ldi al ( 14)
m (2 (2 )
M Les -20 )
In ay (2 )
a ng es (20 )
ew d ( )
Sr ine (20 )
an (2 )
So (2 0)
In th 6)
a ia
5)
Is es -16
- 12 9
Ti an es 16
N la ia 16
i L a 14
Tu s 13
M et n 15
m ip (2 15
To tu 12
Bh nd 012
ut ds 15
Af La eas 015
al te 13
pu Ba on ia 13
G esh 013
an DR Asi
re nd 00
na 01
or 0 00
01
u 01
di cif
ka 01
lu s
di As
Va DP (20
ta 0
lo hil ar (20
Pa Ma ep (20
a 20
Ea (20
st v 20
0
d s 0
n a 0
n 5
hi 2
la (2
(2
(2
2
C ia (
g ol
o
u
on
am
lI
M
C
sh
ar
M
Pa
Source: Country prevalence of wasting obtained from the UNICEF, WHO and World Bank Group Joint Child Malnutrition
Estimates 2018 edition and updated for recent published surveys from Mongolia, the Republic of the Marshall Islands
and Lao PDR.
99
14PART 1:
FOOD SECURITY AND NUTRITION IN ASIA AND THE PACIFIC: AN UPDATE
In South Asia, a 68 percent reduction in the Maternal nutrition status before and during pregnancy
prevalence of wasting is needed to meet the is a key determinant for the healthy development of
respective WHA target, with every country in the a child. However, in many countries in Asia and the
region above the threshold of 5 percent. This Pacific, nutritional needs of women before, during and
reduction, equivalent to 19 million children, relies post-partum are not being met. Indicators of poor
heavily on the reduction of wasting in India, where maternal nutrition status include low pre-pregnancy
over 1 in 5 young children are wasted. body mass index (BMI), short maternal height,
inadequate gestational weight gain and anaemia.
In Southeast Asia, a 44 percent reduction in the These factors are, in turn, important contributors
prevalence of wasting, amounting to 2.3 million to intrauterine growth restriction (IUGR) and low
children, is needed to meet the respective WHA birth weight, both leading risk factors for stunting in
target. The majority of wasted children in this region children globally (Danaei et al., 2016).
are in Indonesia, accounting for 63 percent of all
wasted children in Southeast Asia. Poor maternal nutrition drives the intergenerational
cycle of undernutrition. In Asia and the Pacific,
The prevalence of wasting is highly variable in the pregnant women who are short, underweight or low
Pacific with very high rates in Papua New Guinea maternal weight during pregnancy are more likely to
(14 percent) and the Solomon Islands (8 percent), have children who are born too early, small or become
with comparatively low prevalence in the Marshall stunted and wasted in early childhood (Aguayo and
Islands, Tuvalu and Vanuatu. In the Pacific, an overall Menon, 2016). An estimated 32 percent of child
reduction of 47 percent or 47 000 wasted children is stunting and 30 percent of child wasting may be
needed to meet the WHA targets. attributed to IUGR during gestation (Black et al., 2013).
A meta-analysis of data from 54 countries identified
Severe wasting, known as severe acute malnutrition an inverse association between maternal height, as a
(SAM), is a disease that requires urgent treatment proxy for IUGR, and the prevalence of child stunting,
for children to survive and thrive. Of the 34 million with an increased risk for all mothers shorter than
children who are wasted in Asia and the Pacific, 160 cm (Ozaltin et al., 2010). This creates a vicious
11.7 million suffer from SAM. Children with SAM have cycle, with stunted children having an increased
drastically increased risk of death, with SAM risk of short stature and overweight as adults and,
attributing to an estimated 1-2 million child deaths therefore, an increased risk of having stunted
per year. Even if they survive, repeated cases of SAM children themselves.
can have adverse effects.
While maternal short stature and low pre-pregnancy
SAM is curable with early detection and treatment, BMI is associated with child stunting, these women
with children from the age of 6 months often able to may give birth to healthy infants if they are
be treated with ready-to-use therapeutic foods from well-nourished and receive appropriate care before
their own homes. However, despite the high burden pregnancy, and through pregnancy and delivery.
of SAM cases in the region and knowledge of Meeting the high-nutrient needs of pregnant and
well-established clinical protocols and effective lactating women in many countries in Asia and the
treatments for SAM, the Asia-Pacific region is lagging Pacific, however, is challenging because diets are
on access to treatment for SAM children. Only 1 in 20 dominated by staple foods with low nutrient density
children with SAM in Asia and the Pacific have and poor mineral bioavailability. Poor households
access to treatment. often struggle to afford to buy micronutrient-dense
foods, which tend to be more expensive (see Box 2).
Wasting and stunting share several common causes, Cultural taboos and misconceptions also drive food
including poor maternal nutrition before and during choices (Kavle and Landry, 2017), and women may
pregnancy, poor diets of young children, poor purposively reduce food intake due to traditional
personal hygiene, poor household sanitation, and beliefs that eating less ensures an easy, fast and
household poverty (Harding et al., 2017). inexpensive (natural) delivery.
15REGIONAL OVERVIEW OF FOOD SECURITY AND NUTRITION ASIA AND THE PACIFIC 2018
BOX 2: COST OF DIETS IN ASIA AND THE PACIFIC
Diversified healthy diets are often costly for lower-income households that bear the brunt of
malnutrition. To better understand the affordability of a diversified healthy diet, Save the Children UK
developed a method known as the ‘Cost of the Diet’ (CoD) that can model the cost of a simulated
diet (food basket) which satisfies all nutritional requirements of a household (of specific composition
of interest) at the minimal possible cost, based on availability, price and the nutrient content of
local foods. CoD applies linear optimization to hypothesized diets at the lowest cost possible with
a combination of foods that meet basic energy and nutrient requirements according to WHO/FAO
recommendations and local socio-economic data.
Recent national-level studies conducted by WFP in Cambodia, Indonesia, Lao PDR, Pakistan and
Sri Lanka have shown that the ability of populations to afford the cheapest staple-adjusted diversified
healthy diet is extremely low in the region, ranging from 21-68 percent (see Figure 6). Furthermore,
large inequalities exist within countries. For example, in Cambodia, 20 percent of the people in the
region of Battambang could not afford a diversified healthy diet, while the comparable figure in
Ratanak was more than three times as high (66 percent). These studies also illustrated how quantity
is less of a concern, whereas the quality and diversity of household diets are challenging.
By being able to measure the economic access of different groups to nutritious food, CoD provides
important guidance for policy and programme advice. For instance, by calculating the CoD with
different supplements, micronutrient powders or fortified foods providing these limiting nutrients, the
potential of decreasing the CoD, and therefore improving access to a diversified healthy diet, can be
modelled. For example, in Indonesia, an area like Timor Tengah Selatan, with extremely high stunting
prevalence and where only about 20 percent of households are able to afford a low-cost diet that
meets the average energy and recommended nutrient requirements, will require not only behaviour
change communication, but also specialized food transfers targeted at the most vulnerable groups
(Baldi et al., 2013). Context-specific integrated packages of nutrition interventions are necessary
to improve the affordability of a diversified healthy diet: e.g. food vouchers and iron/folic acid
supplementation, fortification, cash transfers, and social safety nets.
FIGURE 6: COST AND AFFORDABILITY
OF HEALTHY DIETS IN SELECTED Percentage of households that cannot afford CoD
COUNTRIES Average national household CoD
80 5
USD per houehold per day
4
60
Percent
3
40
2
20
1
0 0
Cambodia Pakistan Lao PDR Indonesia Sri Lanka
Source: WFP, 2015-2017; Cost of Diet and Fill the Nutrient Gap Studies.
99
16You can also read