RENEWABLE ENERGY MARKET ANALYSIS - THE GCC REGION - IRENA
←
→
Page content transcription
If your browser does not render page correctly, please read the page content below

RENEWABLE ENERGY
MARKET ANALYSIS
THE GCC REGION

© IRENA 2016          Material in this publication may be freely used, shared, copied, reproduced, printed and/or
                             stored, provided that all such material is clearly attributed to IRENA and bears a notation that
Unless otherwise stated,
                             it is subject to copyright (© IRENA 2016). Material contained in this publication attributed to
     this publication and
                             third parties may be subject to third-party copy-right and separate terms of use and restrictions,
material featured herein
     are the property of     including restrictions in relation to any commercial use.
 IRENA and are subject       This publication should be cited as: IRENA (2016), ‘Renewable Energy Market Analysis: The
 to copyright by IRENA.      GCC Region’. IRENA, Abu Dhabi.

    ABOUT IRENA
    The International Renewable Energy Agency (IRENA) is an intergovernmental organisation that supports coun-
    tries in their transition to a sustainable energy future, and serves as the principal platform for international
    co-operation, a centre of excellence, and a repository of policy, technology, resource and financial knowledge
    on renewable energy. IRENA promotes the widespread adoption and sustainable use of all forms of renewable
    energy, including bioenergy, geothermal, hydropower, ocean, solar and wind energy, in the pursuit of sustainable
    development, energy access, energy security and low-carbon economic growth and prosperity.
    www.irena.org

 ACKNOWLEDGEMENTS
 This report benefited from the support of: Henning Wuester, Ghislaine Kieffer, Salvatore Vinci, Andres Fernandez,
 Sakari Oksanen, Paul Komor, Alvaro Lopez-Peña, Mustapha Taoumi, Deger Saygin, Jasper Rigter (IRENA), Ahmed
 Al Sadhan (K.A. CARE, KSA), Giacomo Luciani (Science Po, France), Hannes Reinisch (Ministry of Foreign Affairs,
 UAE), Raed Bkayrat (First Solar, Middle East), Sashi Prakash (SC, Qatar), Salem Alhajraf (KISR, Kuwait) and Khalil Al-
 Zidi (PAEW, Oman).

 The resource and potential maps for solar and wind were provided by: Nicolas Fichaux, Jacinto Estima and
 Abdulmalik Oricha Ali (IRENA)
 EY Clean Energy & Sustainability Services supported IRENA in conducting and analysing a survey and interviews
 with the stakeholders in the energy sector.

 AUTHORS
 Rabia Ferroukhi, Arslan Khalid, Diala Hawila, Divyam Nagpal (IRENA), Laura El-Katiri, Vasilis Fthenakis and
 Aref Al-Fara (IRENA consultants)

 For further information or to provide feedback, please contact IRENA’s Policy Unit, P.O. Box 236, Abu Dhabi,
 United Arab Emirates; Email: info@irena.org

 DISCLAIMER
 The designations employed and the presentation of materials featured herein are provided on an “as is” basis, for
 informational purposes only, without any conditions, warranties or undertakings, either express or implied, from IRENA,
 its officials and agents, including but not limited to warranties of accuracy, completeness and fitness for a particular
 purpose or use of such content. The information contained herein does not necessarily represent the views of the
 Members of IRENA, nor is it an endorsement of any project, product or service provider. The designations employed
 and the presentation of material herein do not imply the expression of any opinion on the part of IRENA concerning the
 legal status of any region, country, territory, city or area or of its authorities, or concerning the delimitation of frontiers
 or boundaries.
F O R E WO R D

The transition towards renewable energy is creating a fundamental, long-term shift in the
global economy. This shift can be expected to have a significant impact on fossil-fuel pro-
ducers, including the oil- and gas-exporting countries of the Gulf Cooperation Council (GCC).
The landmark December 2015 Paris Agreement, backed up with detailed plans by countries
around the world to overhaul their energy sectors, could imply the eventual softening of
global demand for oil and gas, the main drivers of local economies. But it also presents an
exciting opportunity for economic diversification and entry to new markets.
For the last several years already, GCC countries have been fashioning a critical role for them-
selves in the global shift to renewable energy. They have done so as investors in major solar
and wind projects worldwide and also by adopting innovative and increasingly cost-compet-
itive technologies in their own domestic markets.
With the advent of lowest solar prices in the world, Gulf countries are set to capitalise on
their promising solar resources for power generation and water desalination. As the present        Adnan Z. Amin
market analysis finds, the GCC region can cut its annual water use by 16 per cent, save 400        Director-General
million barrels of oil, create close to 210,000 jobs and reduce its per capita carbon footprint    IRENA
by 8% in 2030 – all by achieving the renewable energy targets that national and sub-national
governments have already put in place.
These current targets are entirely within reach. A solar photovoltaic tender in Dubai last
year resulted in the record-low electricity price of USD 0.06 per kilowatt hour – cheaper
than domestically produced power from gas-fired generation. Indeed, for countries that use
a substantial share of their hydrocarbon production for power generation, solar power has
emerged as one of the quickest, least-risk investments to meet rapid demand growth for
electricity and even boost export capacity and revenues.
The economic and social rationale for the energy transition in the GCC has never been
stronger. By maintaining their leadership in the energy sector and embracing their region’s
abundance of renewable energy resources, GCC countries can ensure their own long-term
economic and social prosperity through a clean energy future.

                                                              A Renewable Energy Roadmap

                                                              RENEWABLE ENERGY
                                                              MARKET ANALYSIS
                                                              THE GCC REGION

CONTENTS
     Foreword      . . . . . . . . . . . . . . . . . . . . . . . . . . . . . . . . . . . . . . . . . . . . . . . . . . . . . . . . . . . . . . . . . . . . . . . . . . . . .    3
     Table of contents           . . . . . . . . . . . . . . . . . . . . . . . . . . . . . . . . . . . . . . . . . . . . . . . . . . . . . . . . . . . . . . . . . . . . . .    5
     Lists of figures, tables and boxes .                      . . . . . . . . . . . . . . . . . . . . . . . . . . . . . . . . . . . . . . . . . . . . . . . . . . . . . . .    6
     Abbreviations         . . . . . . . . . . . . . . . . . . . . . . . . . . . . . . . . . . . . . . . . . . . . . . . . . . . . . . . . . . . . . . . . . . . . . . . . .    9

     EXECUTIVE SUMMARY . . . . . . . . . . . . . . . . . . . . . . . . . . . . . . . . . . . . . . . . . . . . . . . . . . . . . . . . . 10

     BACKGROUND                                                                                                                                                                18
01
                                       . . . . . . . . . . . . . . . . . . . . . . . . . . . . . . . . . . . . . . . . . . . . . . . . . . . . . . . . . . . . . . . . . .

     1.1   Overview of GCC economies .                         . . . . . . . . . . . . . . . . . . . . . . . . . . . . . . . . . . . . . . . . . . . . . . . . . . . . . .     19
     1.2 Diversification of GCC economies .                            . . . . . . . . . . . . . . . . . . . . . . . . . . . . . . . . . . . . . . . . . . . . . . . . . .   20
     1.3 Impact of oil-price fluctuations on GCC economies .                                           . . . . . . . . . . . . . . . . . . . . . . . . . . . . . . . . . .     22

     GCC ENERGY MARKETS . . . . . . . . . . . . . . . . . . . . . . . . . . . . . . . . . . . . . . . . . . . . . . . . . . . . . . . 24
02   2.1 Energy supply .             . . . . . . . . . . . . . . . . . . . . . . . . . . . . . . . . . . . . . . . . . . . . . . . . . . . . . . . . . . . . . . . . . . .     26
     2.2 Energy demand                 . . . . . . . . . . . . . . . . . . . . . . . . . . . . . . . . . . . . . . . . . . . . . . . . . . . . . . . . . . . . . . . . . .   30
     2.3 Energy sector governance .                        . . . . . . . . . . . . . . . . . . . . . . . . . . . . . . . . . . . . . . . . . . . . . . . . . . . . . . . .     36

     RENEWABLE ENERGY IN THE GCC                                                                                                                                             40
03
                                                                                       . . . . . . . . . . . . . . . . . . . . . . . . . . . . . . . . . . . . . . . . . .

     3.1 Abundant renewable energy resources and potential .                                               . . . . . . . . . . . . . . . . . . . . . . . . . . . . . . . .     43
     3.2 Favourable economics for renewables                                   . . . . . . . . . . . . . . . . . . . . . . . . . . . . . . . . . . . . . . . . . . . . . .   46
     3.3 Evolving renewable energy policy frameworks .                                         . . . . . . . . . . . . . . . . . . . . . . . . . . . . . . . . . . . . . .     53
     3.4 Status and trends in deployment                             . . . . . . . . . . . . . . . . . . . . . . . . . . . . . . . . . . . . . . . . . . . . . . . . . . .     59
     3.5 Developments along the value chain .                                . . . . . . . . . . . . . . . . . . . . . . . . . . . . . . . . . . . . . . . . . . . . . . .     62
     3.6 The socio-economic benefits of a renewable energy transition in the GCC                                                               . . . . . . . . . . . . . .     66

     THE WAY FORWARD . . . . . . . . . . . . . . . . . . . . . . . . . . . . . . . . . . . . . . . . . . . . . . . . . . . . . . . . . . . . 72

     IN FOCUS: RENEWABLE ENERGY- BASED
     DESALINATION IN THE GCC . . . . . . . . . . . . . . . . . . . . . . . . . . . . . . . . . . . . . . . . . . . . . . . . . . 78
     Desalination in the GCC                 . . . . . . . . . . . . . . . . . . . . . . . . . . . . . . . . . . . . . . . . . . . . . . . . . . . . . . . . . . . . . . .     79
     Renewable energy in desalination                          . . . . . . . . . . . . . . . . . . . . . . . . . . . . . . . . . . . . . . . . . . . . . . . . . . . . . .     83
     Economics of renewable desalination .                             . . . . . . . . . . . . . . . . . . . . . . . . . . . . . . . . . . . . . . . . . . . . . . . . . .     85

     References        . . . . . . . . . . . . . . . . . . . . . . . . . . . . . . . . . . . . . . . . . . . . . . . . . . . . . . . . . . . . . . . . . . . . . . . . . .     88
     Annex 1: Model assumptions                      . . . . . . . . . . . . . . . . . . . . . . . . . . . . . . . . . . . . . . . . . . . . . . . . . . . . . . . . . . .     92
     Annex 2: Oil and gas reserves and production                                    . . . . . . . . . . . . . . . . . . . . . . . . . . . . . . . . . . . . . . . . . . .   94
     Annex 3: Survey and interviews                        . . . . . . . . . . . . . . . . . . . . . . . . . . . . . . . . . . . . . . . . . . . . . . . . . . . . . . . .     95

                                                                                                                                                                                    5
R E N E WA B L E E N E R G Y M A R K E T A N A LY S I S : T H E G CC R E G I O N

                LISTS OF FIGURES, TABLES AND BOXES
                LIST OF FIGURES
                Figure 1.1    External losses from lower oil prices                   Figure 3.4 Suitability scores for grid-connected
                              in 2015 and net oil exports . . . . . . . . . . 22                 solar PV up to 75 km from the grid. . . . . . 45

                Figure 2.1 The world’s crude oil reserves                             Figure 3.5 Projected daily power generation
                           by region in 2014 . . . . . . . . . . . . . . . . . 25                for the UAE in 2030 by technology . . . . . 46

                Figure 2.2 The world’s natural gas reserves                           Figure 3.6 LCOE of utility-scale electricity
                           by region in 2014 . . . . . . . . . . . . . . . . . 25                generation technologies in the GCC . . . . . 47

                Figure 2.3 The world’s ten largest oil producers                      Figure 3.7 Estimated LCOEs of distributed
                           in 2014 . . . . . . . . . . . . . . . . . . . . . . . 26              solar PV in Dubai in 2015 . . . . . . . . . . . . 51

                Figure 2.4 Global liquids exports                                     Figure 3.8 Cost of steam for different generation
                           by exporting region in 2013 . . . . . . . . . . 27                    technologies for enhanced oil recovery . . . 52

                Figure 2.5 The world’s ten largest natural gas                        Figure 3.9 GCC renewable energy investments
                           producers in 2014 . . . . . . . . . . . . . . . . 28                  from 2006 to 2015 . . . . . . . . . . . . . . . . 59

                Figure 2.6 Global natural gas exports                                 Figure 3.10 Renewable energy projects in the GCC . . . 61
                           by region in 2013 . . . . . . . . . . . . . . . . 29
                                                                                      Figure 3.11 The value chain and involved stakeholders
                Figure 2.7 The world’s ten largest oil consumers                                  of selected projects . . . . . . . . . . . . . . . 62
                           in 2014 . . . . . . . . . . . . . . . . . . . . . . . 30
                                                                                      Figure 3.12 Solar PV manufacturers in the GCC . . . . . 66
                Figure 2.8 Total primary energy use per capita
                           in 2012 . . . . . . . . . . . . . . . . . . . . . . . 31   Figure 3.13 The breakdown of direct jobs in the
                                                                                                  renewable energy sector in the region
                Figure 2.9 Total final energy consumption                                         by country in 2030 . . . . . . . . . . . . . . . 67
                           in the GCC by sector in 2013 . . . . . . . . . . 32
                                                                                      Figure 3.14 The breakdown of direct jobs in renewable
                Figure 2.10 Breakdown of energy consumption                                       energy in 2030 by technology . . . . . . . . 67
                            within GCC industries in 2013 . . . . . . . . . 32
                                                                                      Figure 3.15 Fossil fuel savings from GCC renewable
                Figure 2.11 Energy consumption in Saudi Arabia                                    energy targets by year and by country . . . 68
                            by industry in 2012 . . . . . . . . . . . . . . . 33
                                                                                      Figure 3.16 Emissions savings due to renewable
                Figure 2.12 Energy consumption in the transport sector                            energy deployment plans . . . . . . . . . . . 69
                            of the GCC and selected countries in 2013 . 33
                                                                                      Figure 3.17 Reduction in water withdrawal for power
                Figure 2.13 Electricity end-user profile for a typical                            generation in the region in 2030 . . . . . . . 70
                            building in Abu Dhabi in 2010 . . . . . . . . . 33
                                                                                      Figure A.1 Cumulative desalination capacity
                Figure 2.14 Annual electricity consumption growth                                in GCC countries; 2006-2020 . . . . . . . . . 80
                            by user group in the GCC and selected
                            countries, 2003 – 2013 . . . . . . . . . . . . . 34       Figure A.2 Fuel consumed in the power and water
                                                                                                 sectors for desalination . . . . . . . . . . . . . 83
                Figure 2.15 Total primary energy supply
                            in the GCC by source in 2013 . . . . . . . . . 35         Figure A.3 Cost competitiveness of solar desalination
                                                                                                 at different oil prices . . . . . . . . . . . . . . 84
                Figure 3.1 Sustainable energy plans and targets
                           in the Gulf Cooperation Council. . . . . . . . 42          Figure A.4 Levelised water production costs for
                                                                                                 grid-connected solar PV systems under
                Figure 3.2 Solar resources in the MENA . . . . . . . . . 43                      various LCOE assumptions . . . . . . . . . . . 86
                Figure 3.3 Suitability scores for grid-connected
                           wind up to 75 km from the grid . . . . . . . . 44

6
TA B L E S A N D B OX E S

LIST OF TABLES                                                         LIST OF SURVEY BOXES
Table 2.1   Institutions involved in policymaking                      Survey Box 2.1   Subsidies. . . . . . . . . . . . . . . . . . 39
            and planning in the GCC energy sector . . . 37
                                                                       Survey Box 3.1   Deployment in harsh weather . . . . . 45
Table 2.2   Regulatory bodies in the GCC
            energy sectors . . . . . . . . . . . . . . . . . . 38      Survey Box 3.2   Cost as the key driver . . . . . . . . . . 46

Table 3.1   Electricity consumption tariffs                            Survey Box 3.3   Human capital and R&D . . . . . . . . 56
            as of January 2016 . . . . . . . . . . . . . . . . 49
                                                                       Survey Box 3.4   Aspiration vs deployment . . . . . . . 58
Table 3.2   Installed renewable power capacity
                                                                       Survey Box 3.5   Local – international partnerships . . 62
            in the GCC electricity sector
            as of the end of 2014 . . . . . . . . . . . . . . 58       Survey Box 3.6   Bank financing . . . . . . . . . . . . . . 64
Table A.1   GCC desalination capacities and                            Survey Box 3.7   Opportunity cost. . . . . . . . . . . . . 69
            breakdown per technology . . . . . . . . . . 81

LIST OF BOXES
Box 1.1     Labour markets in the GCC . . . . . . . . . . 20

Box 1.2     National economic strategies of the GCC
            countries . . . . . . . . . . . . . . . . . . . . . . 21

Box 2.1     Ministries involved in energy-related
            planning and decision-making . . . . . . . . 36

Box 3.1     Solar technology is not new to the region . 41

Box 3.2     Regulations for net metering in Dubai . . . . 50

Box 3.3     Cost competitiveness of CSP in steam
            production for enhanced oil recovery . . . . 52

Box 3.4     Best practices from renewable energy
            auctions in Dubai. . . . . . . . . . . . . . . . . 54

Box 3.5     Future prospects for Shams Dubai . . . . . . 55

Box A.1     Overview of desalination technologies . . . 81

Box A.2     Development of more energy
            efficient desalination technologies:
            The case of Masdar . . . . . . . . . . . . . . . 87

                                                                                                                                                    7
R E N E WA B L E E N E R G Y M A R K E T A N A LY S I S : T H E G CC R E G I O N

8
A B B R E V I AT I O N S /AC R O N Y M S

ABBREVIATIONS
AER         Authority for Electricity Regulation       KISR     Kuwait Institute for Scientific Research
BAPCO       Bahrain Petroleum Company                  kWh      Kilowatt hour
bbl/d       Barrels of oil per day                     LCOE     Levelised Cost of Electricity
Btu         British thermal unit                       LNG      Liquefied Natural Gas
CCS         Carbon capture and storage                 LPG      Liquefied Petroleum gas
CEBC        Clean Energy Business Council              MED      Multiple-effect distillation
CO2         Carbon Dioxide                             MEI      Ministry of Energy and Industry
CSP         Concentrated Solar Power                   MENA     Middle East and North Africa
DECC        Directorate of Energy and climate Change   MESIA    Middle East Solar Industry Association
DEWA        Dubai Electricity and Water Authority      MOFA     Ministry of Foreign Affairs
DSCE        Dubai Supreme Council of Energy            MOG      Ministry of Oil and Gas
ECRA        Electricity and Cogeneration Authority     MOPM     Ministry of Petroleum and Mineral Resources
EIA         US Energy Information Agency               Mtoe     million tonnes of oil equivalent
EIB         European Investment Bank                   MW       Megawatt
EOR         Enhanced Oil Recovery                      NGL      Natural Gas Liquids
EPC         Engineering Procurement and Construction   NOC      National Oil company
EU          European Union                             NOGA     National Oil and Gas Authority
EWA         Electricity and Water Authority            OECD     Organisation for Economic Cooperation and
GCC         Gulf Cooperation Council                            Development

GCPA        Gulf Coast Power Association               OPEC     Organization of the Petroleum Exporting
                                                                Countries
GDP         Gross Domestic Product
                                                       PPA      Power Purchase Agreement
GW          Gigawatt
                                                       PV       Photovoltaic
IEA         International Energy Agency
                                                       RO       Reverse Osmosis
IFC         International Finance Corporation
                                                       RSB      Abu Dhabi Regulation and Supervision
IMF         International Monetary Fund                         Bureau
IPP         Independent Power Projects                 SPC      Supreme Petroleum Council
IRENA       International Renewable Energy Agency      tcm      Trillion cubic metres
IWPP        Independent Water and Power Project        UAE      United Arab Emirates
K.A.CARE    King Abdullah City for Atomic and          UNEP     United Nations Environmental Programme
            Renewable Energy
                                                       UNDP     United Nations Development Programme
KACST       King Abdul Aziz City for Science and
            Technology                                 UNFCCC   United Nations Framework Convention on
                                                                Climate Change
KAHRAMAA Qatar General Electricity and Water
         Corporation                                   UNIDO    United Nations Industrial Development
                                                                Organization
KAPSARC     King Abdullah Petroleum Studies and
            Research Center                            USD      United States Dollar

                                                                                                                                 9
EXECUTIVE
SUMMARY
E XECUTIVE SUMMARY

                                                                                                    ES

The Gulf Cooperation Council (GCC) region compris-         embedded in all countries’ visions and development
es some of the world’s largest hydrocarbon produc-         strategies.
ing countries. The six member countries, Bahrain,          This report examines the energy economies of the
Kuwait, Oman, Qatar, Saudi Arabia and the United           GCC countries. It discusses the opportunities and
Arab Emirates (UAE), hold almost a third of proven         barriers for renewable energy deployment, formulat-
crude-oil reserves, and approximately a fifth of global    ing recommendations for the greater integration of
gas reserves. The development of fossil fuel reserves      renewables into the regional energy mix. The report
and exports has underpinned impressive economic            provides insights on best practices in policy-making,
growth, which has brought widespread prosperity            project development and financing that are paving
and development. Hydrocarbon exports have been an          the way towards more sustainable energy systems.
engine of growth, but fossil fuels are increasingly used   It also analyses the broader socio-economic bene-
to meet the rising domestic energy demand.                 fits that can result from such a transition. Finally, the
Rapid industrialisation, population growth and in-         report discusses the potential for renewables-based
creasing water desalination are resulting in high en-      desalination.
ergy demand growth, impacting the ability of some
countries to maintain export levels over the long-
term. These dynamics have compelled governments            AN INTRINSIC LINK BETWEEN ENERGY
to embark on a diversification strategy to meet grow-      EXPORTS AND ECONOMIC GROWTH
ing energy demand and support continued economic           The economies of the GCC have experienced tre-
growth.                                                    mendous socio-economic development in recent
A systematic diversification of the region’s energy        decades, driven both by oil-and-gas revenues and
mix towards alternative sources, including renew-          by growth-oriented policies that have led to some of
ables, presents ample opportunities, as it would free      the world’s highest urbanisation rates and living stan-
up domestic energy production for export. Addition-        dards.
ally, a transition towards a more sustainable energy       Hydrocarbon exports, in the form of crude oil, petro-
future would reduce carbon-dioxide (CO2) emissions         leum products and other liquids and natural gas, have
and bring a wide array of other socio-economic ben-        been the main source of government budget revenues
efits. These include job creation along with increased     in the GCC, constituting almost 80% of total revenue
local economic diversification, an aspiration deeply       for the region’s governments in 2013. In that year, GCC

                                                                                                                         11
R E N E WA B L E E N E R G Y M A R K E T A N A LY S I S : T H E G CC R E G I O N
ES Figure ES.1 Sustainable energy plans and targets in the Gulf Cooperation Council
GCC sustainable energy plans
Bahrain 2020: 5% of capacity
Renewable Energy Targets
Energy Efficiency Targets
2030: 20% of capacity
Qatar (1800MW)
2020: 5% of generation 2017: 20% in per capita
2030: 15% of generation elecricity cons. and
CSP 5.7 GW, PV 4.6 GW, 35% in per capita
Wind 0.7 GW Kuwait water cons. over 2011
5% generation efficiency
10% energy cons. in buildings
2021: 24% clean energy
2020: (Abu Dhabi) 7% of capacity
2030: (Dubai) 5GW solar PV
UAE
2030: (Dubai) power cons.
by 30% vs business
as usual
2022: 9.5GW
2040: 54GW 41GW Solar,
9GW Wind,
3GW W2E**, 1GW Geo.
Saudi Oman
2020: Energy intensity = G7 Arabia
2021: 14% peak demand, 2015: 5% in average gas cons.
8% electricity per kWh of generation
consumption
* The Saudi Arabian renewable energy plan from the King Abdullah City for Atomic and Renewable Energy (K.A.CARE) was intended as
a scenario rather than an official target. It has been reported that the plan has been pushed back by eight years (BNEF, 2014).
Source: Based on (Lahn, Stevens and Preston, 2013); (RCREEE, 2015a) and others
12E XECUTIVE SUMMARY
countries exported roughly 13 million barrels per day ASPIRATIONS FOR A MORE SUSTAINABLE
(b/d) of crude oil.1 Saudi Arabia is the region’s largest ENERGY FUTURE
exporter of crude, with almost 19% of global exports In recent years, several GCC countries have an-
in 2013. Qatar is the largest exporter of natural gas, nounced plans and targets for conserving natural re-
with almost 12% of global exports in 2013. sources, improving energy efficiency, and deploying
With the recent fall in global oil prices, the contribu- renewable technologies (Figure ES 1). Solar energy
tion of hydrocarbon exports to the GCC economies has received particular attention, reflecting its high
is expected to fall. Also, GCC countries might not be suitability in terms of resource availability, cost-com-
able to sustain the same level of exports at the current petitiveness and matching regional demand patterns.
rate of growth in energy consumption.
THE ATTRACTIVENESS OF SOLAR ENERGY
A SURGE IN ENERGY CONSUMPTION IN THE GCC
GCC economies’ position in global energy markets The abundance of solar resource potential and the
over the past 40 years has been shaped by their falling cost of associated technologies, mainly pho-
role as oil and gas producers. Rapid socio-econom- tovoltaic (PV) modules are major factors influencing
ic growth over the past decade is positioning them the attractiveness of solar energy in the region. The
as one of the world’s highest growth markets. During GCC countries lie in the so-called Global Sunbelt2 and
the 2000s, regional energy consumption grew at an boast some of the highest solar irradiances in the
average of 5% per annum, faster than India, China world. Close to 60% of the GCC’s surface area is found
and Brazil. Saudi Arabia is now the world’s seventh to have excellent suitability for solar PV deployment
largest consumer of oil. In 2014, domestic consump- (Figure ES 2), and developing just 1% of this area could
tion amounted to about 28% of production, compared create almost 470 gigawatts (GW) of additional pow-
with 17% in 2000. Notably, with rising domestic de- er-generation capacity.
mand, some countries are turning to imports. The
UAE, for instance, is turning to gas imports due to the Figure ES.2 Suitability of grid connected solar PV
surge in demand, lag times for domestic production,
and export obligations through established long-term
contracts.
These trends have inspired countries in the region
to devise strategies for conserving natural resourc-
es, improving energy efficiency, and diversifying the
energy mix towards alternative sources, including re-
newables. In fact, countries in the GCC have already
started planning their transition towards a more sus-
tainable energy future.
Source: (IRENA, 2016) (http://irena.masdar.ac.ae/?map=2146)
Note: The potential for solar energy in the region has been analysed
using suitability factors such as solar irradiation, distance from the grid,
1. Based on IEA data. population density, topography, land cover and protected areas (IRENA,
2. A geographical region consisting of countries that are situated 2016a). The analysis indicates vast areas suitable for solar PV deployment
between 35°N and 35°S and generally characterized by high solar throughout the region. The map shows suitability scores between 70%
irradiation (EPIA and ERA, 2010). and 100% (from light yellow to dark red).
13R E N E WA B L E E N E R G Y M A R K E T A N A LY S I S : T H E G CC R E G I O N
ES
The resource abundance and its suitability coupled the long-term vision of Dubai to deploy 5 GW of solar
with the falling technology costs, strengthen the busi- energy by 2030 encouraged low bidding, as devel-
ness case for renewables in the GCC. Solar PV mod- opers sought to establish themselves in a promising
ules, for instance, cost three quarters less today than market.
in 2009 and will continue to decrease. Falling tech- Developments in the market attracted players from
nology costs are translating into record low genera- other segments of the value chain, such as manufac-
tion costs. The recent auction for the Mohammed Bin turing. Incentives for the establishment of local indus-
Rashid Al Maktoum Solar Park 2 in Dubai yielded pric- tries in the GCC typically include free zones, well-de-
es as low as 5.85 US cents per kilowatt-hour (kWh). veloped infrastructure, and the potential for synergies
This price is one of the lowest in the world and even with established industries such as glass, aluminium
competitive with oil and gas in the region. and steel. The region also has the potential to spread
expertise. For example, local project developers, such
THE ENABLING ENVIRONMENT FOR THE as ACWA Power and Masdar, are also developing proj-
DEVELOPMENT OF THE SOLAR ects in other countries in the Middle East and North
INDUSTRY Africa (MENA) region through partnerships and joint
The design of the Dubai auction succeeded in bring- ventures.
ing the price down mainly due to the creditworthiness Local companies have also benefited from partner-
of the off-taker, the Dubai Electricity and Water Au- ing with (or acquiring) well-established technology
thority (DEWA), and the long-term vision for solar de- providers and engineering, procurement and con-
ployment in the region. DEWA, the majority owner of struction (EPC) companies. They have enhanced local
the solar plant, is a reliable off-taker, which reduces capabilities, gained experience and strengthened the
the risk of non-payment and lowers financing costs. A GCC firms’ renewable energy portfolio. Examples in-
long loan tenor of 27 years, low interest rate of 4% and clude Masdar’s partnership with Abengoa and Sener,
high debt-to-equity ratio of 86% were instrumental in and Abdul Latif Jameel’s acquisition of leading solar
achieving the record-low electricity price. In addition, developer Fotowatio Renewable Ventures (Spain).
Figure ES.3 The breakdown of direct jobs in renewable energy in 2030 by technology (thousand jobs)
CSP PV (utility) PV (rooftop) Wind Waste to Energy
69 78 30 12 18
0 50 100 150 200 250
Thousand jobs
14E XECUTIVE SUMMARY
These factors have all contributed to creating an en- POTENTIAL FOR JOB CREATION
abling environment for the development of a local IRENA estimates that achieving the GCC renewable
renewable energy industry. If the GCC countries’ re- energy targets and plans could create an average of
newables objectives are met by 2030, the projected 140,000 direct jobs every year. In 2030 alone, close
80GW renewable energy capacity could bring to 210,000 people could be employed in renewables.
far-reaching socio-economic benefits, including job It is assumed that solar PV (small and large) and con-
creation and savings in fuel consumption, CO2 emis- centrating solar power (CSP) would account for 85%
sions and water withdrawal. of the region’s renewable energy jobs in 2030. Massive
Figure ES.4 Fossil fuel savings from GCC renewable energy targets by year and by country
Annual Fuel Saving Fuel saving in 2030
BBOE
0.4
0.40 Bahrain Kuwait
UAE
0.3
Oman
0.2
0.21 Qatar
Saudi Arabia
0.1
0.06
0.02
0
2015 2020 2025 2030 2030
Bahrain
Kuwait
Oman
GCC Countries Qatar
55-87
Saudi Arabia
UAE
billion USD
Discounted* Fuel Savings
2.5 billion BBOE
Cumulative
Fuel Savings
* Discount rate 5%; Low price scenario (Oil: USD 40/barrel; Gas: USD 8/MMBtu); High price scenario (Oil: USD 80/barrel; Gas: USD 11/MMBtu)
15R E N E WA B L E E N E R G Y M A R K E T A N A LY S I S : T H E G CC R E G I O N
ES
deployment of PV could create more than 100,000 SAVINGS IN FUEL CONSUMPTION,
jobs, making it the largest employing technology, fol- CO2 EMISSIONS AND WATER
lowed by CSP with 31% of the jobs. Waste-to-energy WITHDRAWAL
can be an important employer, with around 14% of the
Achieving renewable energy plans could result in cu-
jobs, according to conservative estimates that do not
mulative savings for the region of 2.5 billion barrels of
account for operational jobs in waste collection and
oil equivalent (2015-2030), leading to overall savings
processing (Figure ES 3). Wind energy could also con-
of USD 55 billion to USD 87 billion, depending on oil
tribute, especially in Saudi Arabia, Kuwait and Oman.
and gas prices.
Decreasing fuel consumption can also reduce regional
Figure ES.5 Emission savings due to renewable energy carbon footprints, in line with the countries’ Intended
deployment plans (MtCO2)
Nationally Determined Contributions (INDC) submis-
sions to the Paris climate conference (COP21). Carbon
emissions can be reduced by a cumulative total of
Emission savings around 1 gigatonne (Gt) by 2030, resulting in an 8%
reduction in the region’s per capita carbon footprint
1
MtCO2
200 (Figure ES 5).
GtCO2
155 In addition to saving CO2 emissions, realising renew-
able energy plans could result in an overall reduc-
150
tion of 16% in water withdrawal in the power sector 3,
equivalent to 11 trillion litres of water per year This
100
80 would have ecological benefits and reduce energy
consumption for water desalination.
50
23
6 WATER DESALINATION: THE OTHER
0 RENEWABLES APPLICATION
2015 2020 2025 2030
Desalination provides a large share of the region’s
fresh water needs, ranging from 27% in Oman to 87%
in Qatar. It also accounts for a substantial share of total
energy consumption in most GCC countries; as much
as 30% for Qatar and the UAE, for example. In Saudi
Arabia, thermal desalination accounts for around 10%
of domestic oil consumption. Desalination also draws
considerable volumes of natural gas, where available
(e.g. in Oman and Qatar).
A transition towards a greater use of renewables for
desalination, especially solar power, can reduce fossil
fuel consumption for exports or more economic uses.
3. The analysis considers water consumption for power generation
in all GCC countries and includes water use during fuel extraction Both grid connected and off-grid desalination can be
only for those countries using high shares of domestic oil cost-competitive. Ongoing research and deployment
resources for generation (Kuwait, Oman and Saudi Arabia).
Water consumption factors for different technologies are derived can enhance the business case. Large-scale renew-
primarily from NREL, (2011), using median values. Total water use
does not consider the sources of water due to lack of available
able energy-based desalination projects could further
data. reduce costs through economies of scale.
16E XECUTIVE SUMMARY
THE WAY FORWARD this purpose, auctions have been identified as an
effective policy for large-scale deployment. The
The development of fossil fuel reserves and exports
design of auctions is integral to their success in
in the GCC has underpinned impressive economic
achieving deployment in a well-planned and cost-
growth, bringing widespread prosperity and
efficient manner while also fulfilling development
development. Fossil fuel production is increasingly
objectives. Auctions can be implemented along
used to meet the fast-growing domestic energy
with other instruments, especially for small-scale
demand. Rapid industrialisation, high demography
projects, such as feed-in tariffs and net-metering.
and rising water desalination are the leading reasons
The success of net metering relies on conducive
for this growth and can have important implications
financing conditions to lower the upfront costs of
for GCC countries’ ability to maintain export levels
installing the systems and on electricity tariffs that
over the long-term. In fact, as discussed in this report,
are comparable to the current levelised cost of
some countries, have recently become, or are on the
solar photovoltaic. While deployment policies in the
verge of becoming, net importers of natural gas.
region to date focus on the power sector, they could
Governments are, therefore, compelled to embark
also support other renewable energy applications,
on energy diversification strategies to meet growing
such as heating/cooling and renewables-based
energy demand with energy supply options that are
desalination.
domestically available, secure, cost-effective and
environmentally-sustainable. Renewable energy is a In general, deployment policies need to be part of
key part of the solution. a broad range of cross-cutting policy instruments –
the “policy mix” – that supports the energy transition.
Despite potential benefits, the pace of renewables
Tailored to specific country conditions and the level
deployment has, to date, fallen short of its potential
of maturity of the sector, the policy mix should
in the region. This can be attributed to a range of
focus on building institutional and human capacity,
factors, including institutional inertia faced with
promoting research and development, strengthening
new markets, clarity in institutional roles and
domestic industry and creating an investment-
responsibilities, and lack of dedicated policies
friendly environment.
and regulations. In the recent past, efforts were
made to overcome existing barriers by setting up The GCC countries are endowed with hydrocarbon
specialised institutions, building adequate capacities resources that have fuelled development over the
and providing a vision for the sector’s development past decades. Blessed with abundant solar resources,
through renewable energy plans and targets. the region can fuel economic growth and provide
Government commitments can take the form of employment for future generations in a sustainable
credible, time-bound renewable energy targets, manner.
which serve to anchor investor confidence and set
out the trajectory for the development of the sector.
To be effective, targets must be backed by dedicated
policies and regulatory frameworks.
Renewable energy deployment policies are
essential market-creating measures, as they
trigger investments in the sector. They are most
effective when they foster stable and long-term
development for renewable energy in the different
market segments, while being continually adapted
to dynamic technological and market changes. For
17BACKGROUND
B AC KG R O U N D

The Gulf Cooperation Council (GCC) is comprised of        threats to the highly populated coastal communities
six countries: Bahrain, Kuwait, Oman, Qatar, Saudi        (Donat, 2014; Pachauri, 2014).
Arabia and the United Arab Emirates (UAE). These
countries have experienced high economic growth in        1.1 OVERVIEW OF GCC ECONOMIES
recent decades, due largely to the wealth generated       The economies in the GCC have grown substantially
from abundant hydrocarbon reserves. This growth has       in the last decade, with the countries boasting
also been accompanied by a globally unparalleled rise
                                                          some of the highest per capita gross domestic
in urbanisation, infrastructure development and over-
                                                          products (GDP) in the world. This growth has been
all socio-economic conditions. The region’s population
                                                          mostly fueled by the hydrocarbon sector. In 2014,
has grown by six-fold since 1970, with migrant workers
                                                          Saudi Arabia, represented 53% of the region’s GDP,
from Asian and other Middle East and North African
                                                          followed by the UAE at 20% and Kuwait and Qatar at
countries as key contributors (World Bank, 2015).
                                                          around 10% each (World Bank, 2015). This breakdown
As some of the world’s largest producers of oil, and      reflects the respective position of the GCC countries
to a lesser extent natural gas, the GCC countries form
                                                          as hydrocarbon producers and exporters. Saudi
a core group of global oil producers whose energy
                                                          Arabia, the UAE and Kuwait, are the second, sixth
policy actions have far-reaching consequences for
                                                          and ninth-largest oil producers globally, while Qatar
global energy market dynamics. Four of its member
                                                          is the fifth largest producer of gas worldwide.
states are members of the Organization of the
Petroleum Exporting Countries (OPEC): Saudi Arabia,       The economic growth in the region is primarily driven
the UAE, Kuwait and Qatar.                                by government spending and large state-owned
Despite the intrinsic link between fossil fuels and the   enterprises (IMF, 2015). The high economic growth
socio-economic development of the GCC states, the         witnessed in the region has been accompanied by a
region is highly vulnerable to the impacts of climate     high annual population growth rate of almost 7%. With
change. If global temperatures continue to rise, the      a growing population entering the labour force, there
region will experience an above average increase          is a risk of unemployment and underemployment
in temperatures and decrease in precipitation. This       among young nationals which raises concerns (Box
would mean a rise in demand for air conditioning and      1.1). This, among other factors, provides further
desalination, in a region that is one of the most wa-     justification for diversification into economic sectors,
ter-stressed in the world (Dziuban, 2011). In addition,   other than oil and gas.
climate change can lead to rising sea levels that pose

                                                                                                                             19
R E N E WA B L E E N E R G Y M A R K E T A N A LY S I S : T H E G CC R E G I O N
Box 1.1 Labour markets in the GCC
1.2 DIVERSIFICATION OF
The labour markets and populations of the
GCC ECONOMIES
GCC countries are unique for their very high While the oil and gas sectors remain major
ratio of expatriates, who constitute around contributors to the regional GDP, the national
30% of the total population in Saudi Arabia, economic policies and the articulated visions have
70% in Kuwait and 90% in the UAE and Qatar. increasingly aimed towards economic diversification.
Expatriate workers mostly fill blue collar jobs The push for diversification in the region is driven by
such as construction and manufacturing, and a number of factors. First, to reduce risk associated
many skilled and semi-skilled jobs in other with dependence on oil revenues (e.g. fluctuating oil
sectors such as services. Expatriates generally prices and changes in global oil market dynamics).
comprise the vast majority of employees in the Second, to create jobs through the establishment of
private sector. labour intensive industries. Third, to plan for the post-
oil era. As a result, GCC governments have developed
National populations are generally young
strategies to promote specific sectors as summarized
(more than 50% under 24 in Saudi Arabia
in the national strategies in Box 1.2.
and Kuwait, for example), representing a job-
creation challenge for the future. In addition to
unemployment, under-employment of young
nationals, a growing portion of whom are well- “In 50 years, when we might have the
educated, implies a need for more skilled jobs last barrel of oil, the question is: when
for future generations. it is shipped abroad, will we be sad? …
Policy responses by GCC governments have If we are investing today in the right
included encouraging national participation sectors, I can tell you we will celebrate
in the labour force by establishing quotas at at that moment.”
the company and sector levels. Other efforts
Sheikh Mohammed bin Zayed,
have focused on building local knowledge- Crown Prince Abu Dhabi
economies and promoting jobs in new (The National, 2015)
economic areas that attract educated nationals
without regulatory incentives. Renewable
energy, and the wider category of sustainable
While the share of the non-oil sector in total real GDP
energy is considered as an area that fits those
has increased from 58% in 2000 to 70% in 2013, the
criteria, and will be discussed later in this
strategies adopted by governments have had modest
report.
results. The rise in oil prices and resulting increase in
domestic spending for infrastructure and wages led
to the strong growth in sectors such as construction,
transport and retail (IMF, 2014). In Dubai, for instance,
the development of modern infrastructure, along with
a business-friendly environment have paved the way
for significant development in finance, transportation,
trade, tourism and manufacturing.
20B AC KG R O U N D
Box 1.2 National economic strategies of the GCC countries
Bahrain’s Economic Vision 2030 Kuwait’s Vision Plan 2035 and
calls for a ‘shift from an economy current 5-Year Development
built on oil wealth to a productive, Plan focus on economic diver-
globally competitive economy, shaped by the sification and aim to position the country as
government and driven by a pioneering private a regional trade and financial hub. The plan
sector’. Much emphasis is on attracting foreign focuses on infrastructure investment, including
direct investment to create jobs. By 2030, the transportation, a new port, and the develop-
strategy envisions financial services as the main ment of the business hub ‘Silk City’ in Subiyah.
pillar of the economy together with oil and gas,
complemented by tourism, business services,
manufacturing and logistics.
Oman’s Vision 2020 and Qatar’s National Vision 2030 and
successive 5 Year Development National Development Strategy
Plans aim for further diversifica- (2011 – 2016) foresee a dominant
tion from the oil sector and development of role for hydrocarbons in the future economy
human resources and infrastructure. Its In- but also provide a gradual and managed
country Value Strategy increases spending to diversification strategy with greater involvement
benefit business growth and human-resource of the private sector. National institutions are
development. Tourism is seen as a key economic developing strategies for investments in transport
sector for growth and employment creation for infrastructure, housing, and industrial activities to
nationals. More than half the budget of the past prepare for the FIFA World Cup in 2022.
development plan went toward improved airports
and roads.
The Saudi Arabian Long Term In the UAE’s Vision 2021 document
Strategy 2025, emphasises the and in individual development
challenges of the growing youth plans for Abu Dhabi and Dubai,
unemployment among nationals and of boosting continued economic diversification is emphasised
income in the country. Goals include reducing with a focus on growing sectors of tourism,
government reliance on oil revenues from 72% aviation, and financial services. The country is
of total exports to 37% between 2004 and 2024 positioning itself as regional hub of research and
and doubling national income in this time period. innovation and sustainable energy. The Dubai
The associated Ninth Development Plan aims for Expo 2020 is expected to attract more than
increased participation by the private sector in 25 million visits and have a positive impact on
the economy. tourism, travel and real estate.
Source: (Hvidt, 2013)
21R E N E WA B L E E N E R G Y M A R K E T A N A LY S I S : T H E G CC R E G I O N
1.3 IMPACT OF OIL-PRICE FLUCTUA- The duration of the current low-oil price environment
TIONS ON GCC ECONOMIES is still uncertain, as are the implications of falling oil
The collapse in oil prices since mid-2014 from over prices on government investment in alternative energy
USD 100 per barrel in the first half of 2014 to around plans. Nevertheless, the long-term economics of
USD 35 by January 2016 has meant lower exports and renewables in the GCC remain positive, given that solar
government revenue in the GCC. Export losses are PV power in the region is comparable to the Levelised
estimated to be around USD 287 billion for 2015 (21% Cost of Electricity (LCOE) from oil priced at USD 20 per
of GDP in the region) (IMF, 2015). Figure 1.1 shows that barrel (see Chapter 3). In a “low-price” environment of
losses in Kuwait, Qatar, Oman and Saudi Arabia, are around USD 35 per barrel in January 2016, this cost
estimated at more than 20% of GDP. advantage still offers plenty of economic opportunity
for renewable energy deployment. Whether the GCC
As a result, a number of GCC countries have pledged
states will exploit this potential depends to a large
fiscal consolidation and economic reform programmes
extent on long-term policy planning and the creation
for 2016, including changes to the region’s long-
of a stable and transparent regulatory and investment
established subsidy systems (Gulf News, 2015). As
climate to support early deployment.
their development plans hinge on the assumption
of strong economic growth, governments are likely The ongoing reform in the energy pricing structures
to further consider spending on non-asset creating and the inclusion of renewables in the energy mix
expenditures, diversifying government revenues (e.g. can present an opportunity of further reducing the
through income tax or value added tax), and pursuing reliance of the region’s economy and energy sector on
further economic diversification strategies in the oil and gas. Chapter 2 provides more detailed insight
medium to long term (IMF, 2015). on the role of hydrocarbons in the regional energy
sector landscape.
Figure 1.1 External losses from lower oil prices in 2015 (% of GDP) and net oil exports (% of total exports)
External Losses from Lower Oil Prices (% of GDP) Net Oil Exports (% of total exports)
40 100
35
80
30
25 60
20
15 40
10
20
5
0 0
it
r
q
an
ya
ia
an
E
ria
tan
ain
an
n
n
ta
Ira
me
UA
Ira
wa
rab
Lib
aij
ist
Om
ge
Qa
hr
hs
Ye
Ku
erb
en
Al
Ba
iA
ak
km
z
ud
Az
Ka
r
Sa
Tu
Sources: (IMF, 2014)
Notes: External losses are calculated as the projected difference in the US dollar value of net oil exports in 2015, using the 2015 oil price
assumptions in the May 2015 and October 2014 World Economic Outlooks of the IMF, and the volume of net oil exports in the latter, with
adjustments for country-specific factors.
22B AC KG R O U N D
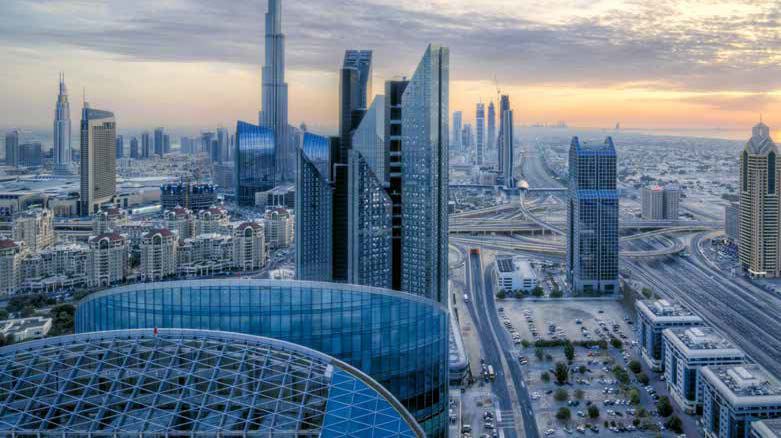
Dubai, United Arab Emirates
23GCC ENERGY MARKETS
G CC E N E R G Y M A R K E T S

The GCC countries comprise the world’s largest hydrocarbon producing region, with around
30% of proven crude oil reserves (Figure 2.1), and around 22% of global gas reserves (Figure
2.2). Saudi Arabia, with currently around 270 billion barrels, has the world’s second largest oil
reserves after Venezuela and is able to produce for at least another 75 years at current rates.
Saudi Arabia also holds the world’s sixth largest natural gas reserves, largest in the region save
for those of Qatar, whose estimated proven gas reserves of around 25 trillion cubic meters              r

(tcm) make it the world’s third-largest holder.

Figure 2.1 The world’s crude oil reserves by region, 2014 (%)

      Global total: around 1,700 billion barrels                                  GCC reserves by country

     8%                                                      3%
      Africa                                           Asia Pacific

     9%                                                                                                            1.8%
                                                                                                                    Others
      Eurasia

     14%
      North
                                                                  29%                                              5.8%
                                                                                                                      UAE

      America                                                               GCC
                                                                                                                  6.0%
                                                                                                                    Kuwait
     18%
      Middle East
      excl. GCC
                                                           19%                                                   15.7%
                                                                                                               Saudi Arabia
                                                        South and
                                                   Central America

Source: (BP, 2015)

Figure 2.2 The world’s natural gas reserves by region, 2014 (%)

     Global total: around 190 trillion cubic metres                                 GCC reserves by country

     31%
     Europe and
     Eurasia
                                                                                                                   1.4%
                                                                                                                    Others

     21%
     Middle East
                                                                  22%                                              3.2%
                                                                                                                      UAE

     excl. GCC                                                              GCC
                                                                                                                   4.3%
                                                                                                               Saudi Arabia

     8%
     Asia Pacific                                                     4%
                                                          S. & C. America
                                                                                                                 12.9%
     8%                                                                                                              Qatar

     Africa
                                                                      6%
                                                          North America

Source: (BP, 2015)

                                                                                                                                         25
R E N E WA B L E E N E R G Y M A R K E T A N A LY S I S : T H E G CC R E G I O N
2.1 ENERGY SUPPLY production capacity.1 It is estimated that the effective
The abundance of hydrocarbon resources in the GCC spare capacity held in the region in 2014 amounted
makes it a premier producer and exporter of crude oil, to around 3.52 million b/d (IEA, 2014).2 More than
petroleum products and natural gas. 90% of spare capacity is held by Saudi Arabia, with
the remainder by Kuwait and the UAE. This means
Oil and petroleum products production Saudi Arabia has considerable influence over global
and trade oil-market dynamics.
Production of crude oil Production of petroleum products
The GCC accounts for around a quarter of global In addition to crude oil, the GCC is also a large
crude oil production and stands out for having the producer of petroleum products3. Saudi Arabia is the
second, sixth and ninth-largest global producers: region’s largest product refiner with eight operating
Saudi Arabia, the UAE and Kuwait, respectively refineries and a capacity of well over 2.2 million
(Figure 2.3). The majority of GCC oil production is b/d, followed by Kuwait and the UAE (EIA, 2015).
exported to international markets given the relatively The region’s refineries produce a range of products
small domestic market (Table 6 in Annex 2). In for both the domestic and the international market.
addition to the scale of reserves and production, the A large project pipeline for new refining capacity in
GCC’s importance to global crude markets also lies in several GCC countries means the region will no longer
the fact that it has virtually all of the world’s spare be seen as just a production centre, but as one for
Figure 2.3 The world’s 10 largest oil producers in 2014
(production in million barrel/day; reserves in billion barrels)
Production (million b/d) Reserves (bbl)
12 300
10 250
8 200
6 150
4 100
2 50
0 0
US
ab di
ra ian
a
ina
E
n
q
t
o
i
ad
Ira
xic
UA
Ira
wa
ia
n
Ar Sau
de uss
Ch
tio
n
Me
Ku
Ca
Fe R
Source: BP (2015)
1. The technical capacity to raise production at short notice for a sustained period of time.
2. By the IEA’s definition, effective spare capacity captures the difference between nominal capacity and the fraction of that capacity actually
available to markets.
3. This includes gasoline and diesel, kerosene, jet fuel, liquefied petroleum gas (LPG), propylene and naphtha, among several other products.
26G CC E N E R G Y M A R K E T S
Figure 2.4 Global liquids exports by exporting region in 2013 (% in energy terms)
Global total: around 2,200 Mtoe
16% 32%
Africa GCC
8%
Asia
16% 8%
Eurasia Middle East
excl. GCC
8% 12%
North America South America
Note: Liquids includes crude oil, NGL and feedstocks as per IEA definition.
Source: Based on IEA data
refining as well. Saudi Arabia is currently finalising to Asian markets, particularly, China, India, Japan
plans to increase the country’s refinery capacity by and Korea. The trend is similar for refined products.
nearly 60% to reach 3.4 million b/d by 2017/18. This More than 60% of Qatar’s refined-product exports, for
is part of its long-term strategy of diversifying energy instance, go to Japan (EIA, 2014c).
outputs (Krane, 2015).
Trade of crude oil and petroleum products Natural gas production and trade
The GCC accounts for more than 80% of the Middle Production of natural gas
East’s total liquids exports (crude oil and petroleum Natural gas production has increased substantially
products) of roughly 19 million b/d (2,200 Mtoe) since the 1980s in the GCC following its rise as a cov-
(Figure 2.4). In addition to exporting crude oil, GCC eted fuel for domestic power generation, for inputs
countries also export a range of petroleum products, in intermediate industries such as petrochemicals, as
particularly liquid petroleum gas (LPG), naphtha well as for exports. Qatar is by far the region’s largest
(a key source of feedstock fuel in petrochemicals producer and exporter of liquefied natural gas (LNG)
production), diesel and fuel oil. Saudi Arabia, with as well as the world’s third largest producer of dry gas
a total of 62 million tonnes of oil equivalent (Mtoe), (Figure 2.5).
is by far the largest exporter of refined products in The region’s overall share in global gas production
the GCC, followed by Kuwait (32 Mtoe) and Qatar stands at 10%, despite accounting for around a fifth of
(22 Mtoe) (IEA, 2015). Total net exports of refined global reserves. With the notable exception of Qatar,
products amounted to 2.57 million b/d in 2012, nearly production of natural gas has lagged in all other GCC
half of which were from Saudi Arabia. countries. This is due to a variety of factors, includ-
GCC crude oil exports to Asian countries have been ing comparably late development of non-associated
growing over the past decade. More than two-thirds gas resources and the historic focus on oil as the re-
of Saudi Arabia’s and Kuwait’s crude oil exports, and gion’s primary revenue source. Slower domestic gas
over 95% of that of Qatar, Oman and the UAE are sent development, coupled with the predominance of sour
27R E N E WA B L E E N E R G Y M A R K E T A N A LY S I S : T H E G CC R E G I O N
gas reserves among the region’s non-associated gas The region’s other two exporters, the UAE and Oman,
resources and rapidly increasingly domestic demand are small-scale LNG exporters, selling to Asian mar-
have further contributed to a situation where several kets, primarily Japan. In 2013, the UAE exported
GCC members have recently turned to gas imports, some 8 bcm (EIA, 2014). Oman has export capacity
including via regional supplies from Qatar. for around 14 bcm of LNG per year (EIA, 2014c). The
lagging pace of development of new gas resourc-
Trade of natural gas
es across the GCC, and the likelihood that any finds
Although the GCC countries have significant natural
would be consumed domestically, means the region,
gas reserves, the role of gas as a tradable commodity
as a whole, is not expected to be a major gas exporter
overall does not match the role played by crude oil in
in the future. In fact, several GCC members are turning
the region (Figure 2.6). Qatar, as the exception, ex-
to natural gas imports due to the surge in demand for
ports around 85% of its natural gas production, with
electricity production, lag times for new non-associ-
an export capacity of some 77 million tonnes per year
ated gas production, and established long-term con-
(around 104 bcm) of LNG. In addition, around 60 mil-
tracts for LNG exports. The UAE and Oman, both with
lion cubic metres (MMcm) per day of dry gas is
existing LNG export commitments in place well into
mar-keted regionally through the Dolphin pipeline this decade, are now importing – the UAE regularly
project (EIA, 2014c). and Oman occasionally – to avoid shortfalls during
the peak summer months for electricity consumption.
Since 2008, both countries have imported from Qatar
through the Dolphin pipeline. The UAE and Kuwait are
also importers of LNG (El-Katiri, 2013).
Figure 2.5 The world’s ten largest natural gas producers in 2014 (production in bcm, reserves in tcm)
Production (bcm) Reserves (tcm)
800 35
700 30
600
25
500
20
400
15
300
10
200
100 5
0 0
US
tio n
r
n
da
a
ay
a
ia
ia
a
in
bi
ra sia
Ira
er
s
at
rw
n
na
ne
Ch
ra
g
de us
Q
No
Ca
Al
do
iA
Fe R
In
ud
Sa
Source: (BP, 2015)
28G CC E N E R G Y M A R K E T S
The GCC regional grid veats, such as Saudi Arabia operating on a different
The GCC countries have moved a step closer towards frequency than the others, also adds to the challenges
more electricity trade by interconnecting their elec- in scaling up electricity trade between Saudi Arabia
tricity sectors through the GCC region grid in 2011. The and the rest of the GCC (El-Katiri, 2011).
interconnection currently maintains a relatively small
capacity of 2.4 gigawatts (GW), primarily because it
was designed in the 1990s when demand was low-
er. For now, the capacity appears to be sufficient, as
the interconnection’s primary function is to act as an
emergency backup system that allows ad hoc trans-
fers between GCC members. Usage has so far been
reportedly minimal given the purpose (El-Katiri, 2011;
MEES, 2014).
A larger-scale application of the grid, extending its
capacity and creating a wholesale market similar to
those of several European systems and Latin America,
is technically possible but unlikely given the absence
of competitive markets for electricity, price controls in
each of the GCC countries and similarities in demand
profiles across each electricity system. Technical ca-
Figure 2.6 Global natural gas exports by region in 2013 (% in Mtoe)
Total natural gas export is around 900 Mtoe
40%
Europe and
Eurasia
2%
Middle East
excl. GCC
14%
GCC
4%
South
America
12%
North America
20% 9%
Asia Pacific Africa
Source: Based on IEA data
29R E N E WA B L E E N E R G Y M A R K E T A N A LY S I S : T H E G CC R E G I O N
2.2 ENERGY DEMAND together the GCC countries have overtaken major
consumers such as China, India and Brazil in terms of
GCC economies have traditionally not been major
consumption growth, thereby reducing the share of
consumers of energy, and their position in global
production that can be exported. Saudi Arabia, for
energy markets over the past forty years has been
instance, domestically consumed nearly a third of its
shaped by their role as producers, exporting the
oil production in 2014 making it the seventh largest
majority of domestically produced oil and gas.
consumer of oil (Figure 2.7).
Against this background, hydrocarbons have formed
an integral part of the region’s energy focus, with the
perception of a natural abundance of these resources
relative to the region’s own energy needs. However,
rising domestic energy demand, driven by rapid
industrialisation, growing population and increasing
water desalination, has stressed the region’s
resources. This section explores the basic dynamics in
energy consumption over the last decade.
Overall trends in energy consumption
The GCC is experiencing an extraordinary surge in
energy consumption, rising on average some 5%
per annum during the 2000s4. In the last few years,
Figure 2.7 The world’s ten largest oil consumers in 2014 (million barrels per day)
million b/d
20
15
10
5
0
US China Japan India Brazil Russia Saudi Republic Germany Canada
Arabia of Korea
Source: (BP, 2015)
4. According to EIA statistics, the six GCC economies consumed a total of 4.57 million b/d in 2014. IRENA calculations of 10-year CAGR (2000 –
2009) based on EIA data.
30You can also read