Delivering on Achieving Climate Progress in 2020 - Bloomberg Professional ...
←
→
Page content transcription
If your browser does not render page correctly, please read the page content below
Delivering on Achieving Climate Progress in 2020
Copyright © 2020 Bloomberg Philanthropies Support LLC
All Rights Reserved
For more information, see www.americaspledge.com
Images courtesy of iStockphoto.com
Delivering on

Achieving Climate Progress
in 2020

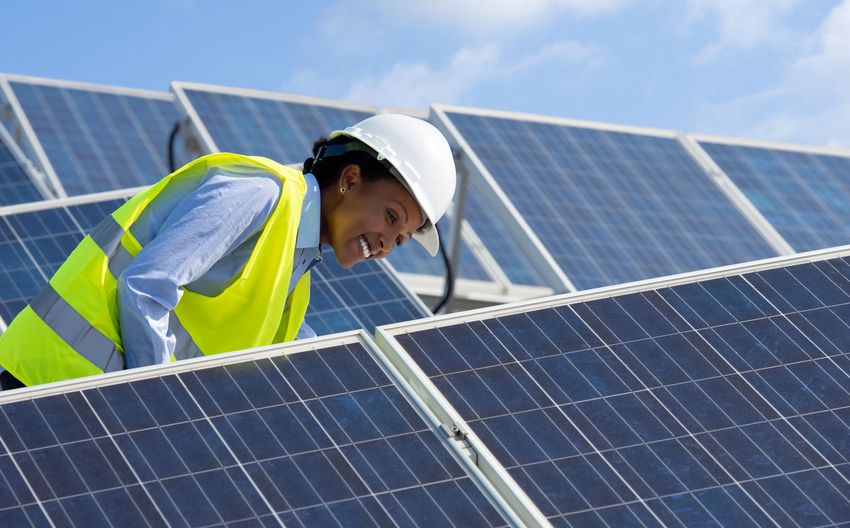
About America’s Pledge
                      An unprecedented coalition of US states, cities, businesses, communities
                      of faith, universities, health care and cultural institutions, and other
                      organizations is now acting to fulfill America’s climate pledge to the
                      world. This commitment is reflected in the large number of American
                      actors continuing to back the Paris Agreement, including members of the
                      We Are Still In network, US Climate Alliance, Climate Mayors, We Mean
                      Business, and many others.

                      In July 2017, United Nations Secretary-        America’s Pledge, providing at that point the
                      General’s Special Envoy for Climate Action     most comprehensive and robust assessment
                      and three-term Mayor of New York City          of the impact of action by US states, cities,
                      Michael R. Bloomberg and California            businesses, and others. In December 2019,
                      Governor Edmund G. Brown, Jr., launched        at the 25th Conference of Parties in Madrid,
                      an initiative, known as America’s Pledge, to   America’s Pledge released Accelerating
                      analyze, catalyze, and showcase climate        America’s Pledge, updating the assessment
                      action leadership by US governors, mayors,     of impact and looking ahead toward 2030 to
                      business leaders, and others. America’s        assess what can be delivered with an “All-In”
                      Pledge serves these efforts as a voice of US   comprehensive American climate approach
                      action to the international community—and      that first expands actions by states, cities,
                      also to our domestic actors to better          businesses, and citizens and then layers on
                      understand the signi icant impact that their   a robust, complementary, and ambitious
                      actions are achieving as activity broadens     federal policy program after 2020.
                      and deepens across the country.
                                                                     With this report, released September 2020
                      In November 2017, at the 23rd Conference       at the Bloomberg Green Virtual Festival,
                      of the Parties to the United Nations           America’s Pledge assesses how states,
                      Framework Convention on Climate Change         cities, and businesses are continuing to
                      (COP-23), America’s Pledge released a          drive climate progress despite the events
                      comprehensive survey of US climate action      of 2020—including the COVID-19 pandemic
                      led by states, cities, and businesses and      and economic recession—and increasing our
                      other non-Federal actors. At the Global        confidence in the country’s ability to achieve
                      Climate Action Summit in San Francisco in      the 2030 emissions reductions modeled in
                      2018, America’s Pledge released Fulfilling     Accelerating America’s Pledge.

2 | Delivering on America’s Pledge
Acknowledgments
   America’s Pledge is co-chaired by Michael Bloomberg and Edmund G. Brown. The America’s
   Pledge Vice-Chairs are Carl Pope, former Executive Director of the Sierra Club, and Mary
   Nichols, Chair of the California Air Resources Board. The America’s Pledge report is the product
   of a collaborative effort between the leadership of the America’s Pledge initiative and a core
   project team. The America’s Pledge project team responsible for this report is co-led by the
   University of Maryland Center for Global Sustainability and Rocky Mountain Institute. Significant
   contributions to this year’s report were also made by the World Resources Institute. Support
   for America’s Pledge is provided by Bloomberg Philanthropies. Special thanks to significant
   and sustained input and helpful comments from Carl Pope, Co-Vice-Chair of America’s Pledge.
   America’s Pledge would also like to thank the numerous stakeholders and reviewers that made
   suggestions to improve the framing and analysis of this report.

   Suggested Citation: The America’s Pledge Initiative on Climate Change (2020) Delivering on America’s
   Pledge: Achieving Climate Progress in 2020. W. Jaglom, C. Frisch, K. Kennedy, L. Clarke, N. Hultman, T. Cyrs,
   J. Lund, D. Saha, J. Feldmann, C. Bowman, J. O’Neill, M. Campton, M. Herbert, L. Calle, A. Light, P. Bodnar.
   Published by Bloomberg Philanthropies with Rocky Mountain Institute, University of Maryland Center for Global
   Sustainability, and World Resources Institute. New York. Available at: americaspledge.com/reports

                                                                                   Achieving Climate Progress in 2020 | 3
Introduction Letter from America’s
     Pledge Leadership
                      Over the past three years, America’s Pledge has tracked, encouraged, and reported on the
                      progress o one o the most dynamic eorts to fight climate change in history—a coalition o
                      US states, cities, businesses, and local leaders working to fill the void created by the Trump
                      administration’s shortsighted decision to walk away from America’s climate obligations.

                      We launched America’s Pledge in July 2017, after the Trump administration announced its
                      intent to pull out of the historic Paris Agreement. Coalitions of local leaders, including We Are
                      Still In and the US Climate Alliance, quickly emerged to announce their continued commitment
                      to upholding the goals of the Paris Agreement in their own communities. In the three years
                      since, even in the face of rollbacks from the federal government and, more recently, the global
                      pandemic, we have made a great deal of progress together.

                      This is our fourth report measuring the progress of this movement. The focus of this year’s report
                      is the long-term impact of the COVID-19 pandemic. This unprecedented economic and public
                      health crisis has uprooted our way of life. It has led many to believe that the stresses it has put on
                      our institutions would drive the US back into increased dependence on fossil fuels, and away from
                      current efforts to reduce emissions and transition to a 100% clean energy economy.

                      Thankfully, that has not been the case. In fact, by every outcome we could measure, the data
                      tells a very different story. Thanks to a groundswell of bottom-up climate leadership across the
                      country, America’s commitment to ulfilling its climate goals appears unshakeable.

                      There is no doubt we need a leadership change in Washington. To fight climate change with the
                      urgency that scientists call for will require bold leadership from the White House—here at home
                      and on the world stage. But we’ve found that that the American people and our state, local,
                      and business leaders are already committed to this work—and together we’re building a more
                      equitable and sustainable future.

                      Michael R. Bloomberg
                      Founder, Bloomberg LP & Bloomberg Philanthropies and three-term Mayor of New York City

                      Edmund G. Brown Jr.
                      Former Governor of California

                      Mary D. Nichols
                      Chair of the California Air Resources Board

                      Carl Pope
                      Former Executive Director of the Sierra Club

4 | Delivering on America’s Pledge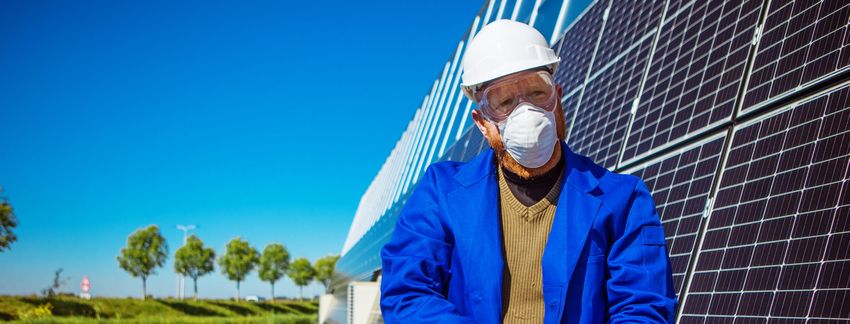
Contents

   Executive Summary                            6    03 Methane                                  42
   Introduction                                 16   Trends Assessment                         43
                                                      • Prospects for Growth in US Oil and Gas 45
                                                        Production Are Dimming
   01 Electricity                               20
                                                     • Methane Leaks from Existing                 46
   Trends Assessment                            21     Infrastructure Are Rising

    • Coal Generation Has Declined Sharply, 22       • Regulatory Landscape Continues              48
      and Coal Retirements Have Accelerated            to Shift

    • Long-term Drivers of Renewable            23   Job Trends and Stimulus Opportunities         49
      Energy Investment Remain Strong

    • Economics of Gas Generation Face          25   04 Buildings                                50
      Headwinds, and Gas Buildout
      Holds Steady                                   Trends Assessment                             51

    • Progress on State, City, and Business     26    • Trends in Efficiency Programs Are Mixed 53
      Clean Electricity Is Mixed
                                                      • Efforts to Electrify Are Progressing       54
   Job Trends and Stimulus Opportunities        27      Despite Growing Signs of Opposition

                                                     Job Trends and Stimulus Opportunities         56
   02 Transportation
   Trends Assessment                            31   05 HFCs                                     58
    • People Are Driving Less                   33   Trends Assessment                             59

    • Public Transit Is Facing an Existential   35    • State HFC Action Is Expanding              60
      Budget Shortfall
                                                      • Federal Regulatory Rollback Is             62
    • Electric Vehicle Prospects Appear Steady 36       Countering State-Level Action

    • Political Will Is Growing to Address      38   Job Trends and Stimulus Opportunities         63
      Emissions from Heavy-Duty
      Transportation                                 Conclusion                                  64
   Job Trends and Stimulus Opportunities        40
                                                     Endnotes                                    67
                                                                      Achieving Climate Progress in 2020 | 5
Executive Summary

                      Highlights
                      Our US sector-by-sector assessment              Demand for clean technologies has
                      increases our confidence that bottom-up         proven resilient, suggesting that we may
                      action is driving climate and clean energy      have passed a tipping point in the energy
                      ambition, despite the challenges posed          transition. Leadership from diverse states,
                      by COVID-19. Increased and lower-cost           cities, and businesses, combined with
                      emissions reduction opportunities are           strong clean energy market fundamentals
                      laying the foundation for an “all in” climate   and supportive public opinion point toward
                      strategy that includes ambitious federal        powerful winds of change across America’s
                      re-engagement. Accelerated market               energy landscape.
                      transformation and increasing social and
                      political mobilization will be key to enable    Climate initiatives can be more rapidly and
                      the comprehensive strategy that can put         reliably achieved with the aid of federal
                      the country onto a 1.5°C-aligned emissions      stimulus programs that include ambitious
                      reduction pathway.                              clean energy investments and policies.
                                                                      Support for grid modernization, electric
                      States, cities, and businesses are leading      transit, zero-emissions buildings, end-of-life
                      America to a climate-friendlier future even     refrigerant disposal, cleanup of the legacy of
                      in the face of the enormous economic and        fossil fuel mining and drilling, and investment
                      public health crisis caused by COVID-19.        in low-income and impacted communities
                      Despite immense challenges, states, cities,     can strengthen the economy, create jobs,
                      and businesses have accelerated climate and     improve public health, reduce air and water
                      clean energy progress in four out of five key   pollution, promote equity, and address
                      sectors. Economic support for state and local   climate change.
                      governments will likely be key to the needed
                      speed of progress in the years ahead.

                      In 2019, our report Accelerating America’s      Since the 2019 report, the COVID-19
                      Pledge illustrated how states, cities,          pandemic and subsequent economic
                      businesses, and others across the United        recession have had wide-ranging and
                      States could achieve 37% emissions              destructive impacts on lives, employment,
                      reductions below 2005 levels by 2030 with       and economic security across the United
                      significantly expanded action (the “Bottom-     States and the world. At the same time,
                      Up” scenario). It also plotted out how to       widespread protests have increased
                      achieve 49% emissions reductions below          attention from the public, governments,
                      2005 levels by 2030 with aggressive federal     and businesses on the need for racial
                      reengagement starting in 2021 (the “All In”     and social justice. In this new analysis, we
                      scenario). This All In scenario would put the   assess how recent trends have affected
                      United States on a pathway to a net-zero        climate progress driven by states, cities,
                      emissions economy by mid-century.               and businesses. Specifically, we look at

6 | Delivering on America’s Pledge
Executive Summary

how recent trends may have altered our             we modeled in our 2019 report; negative
confidence in the country’s ability to achieve     trends are those likely to lead to higher
the 2030 emissions reductions modeled in           emissions in 2030 than we modeled.
Accelerating America’s Pledge.
                                                   For each sector, after considering the key
To measure these prospects, we examine             drivers individually, we evaluate how these
key drivers in the five sectors that offered the   drivers add up relative to the ambitious levels
greatest opportunities for 2030 emissions          of bottom-up climate action modeled in
reductions in the Bottom-Up scenario from          Accelerating America’s Pledge. In this 2020
Accelerating America’s Pledge: electricity,        report, we do not conduct a new economy-
transportation, methane, buildings, and            wide analysis of emissions for 2030. Rather,
hydrofluorocarbons (HFCs). Methane and             we evaluate whether recent trends have
HFCs are subsets of the industrial sector; we      undercut the clean energy transition taking
broke them out separately to discuss specific      hold across the country, and whether
recent developments. Together these                the changed circumstances of 2020 have
sectors provide almost 95% of the economy-         affected our confidence in achieving the
wide total avoided emissions in 2030 in the        Bottom-Up scenario from 2019.
Bottom-Up scenario, building toward further
emissions reduction post-2030.

Across sectors, we separate trends that will
have long-lasting effects (e.g., investments
in new infrastructure) from the immediate
social and economic changes that dominate
2020 but are likely to prove more ephemeral
(e.g., many temporary market and behavior
changes). Similarly, we consider how quickly
economic stimulus measures and other
policies could reinforce the positive trends or
mitigate the risks. Positive trends are those
likely to lead to lower emissions in 2030 than

Terminology for US Entities Acting on Climate Change
As shorthand, this report refers to the many US entities taking action on climate change
outside the federal government as states, cities, and businesses. However, these are not the
only important actors. Tribes, counties, regional associations, investors, faith-based groups,
healthcare institutions, cultural institutions, universities, citizen groups, and others are all
also making efforts to address climate change. In other reports and in the context of the
Paris Agreement and the United Nations Framework Convention on Climate Change, such
groups are sometimes called non-state actors, subnational actors, non-federal actors, or
non-party stakeholders.

                                                                    Achieving Climate Progress in 2020 | 7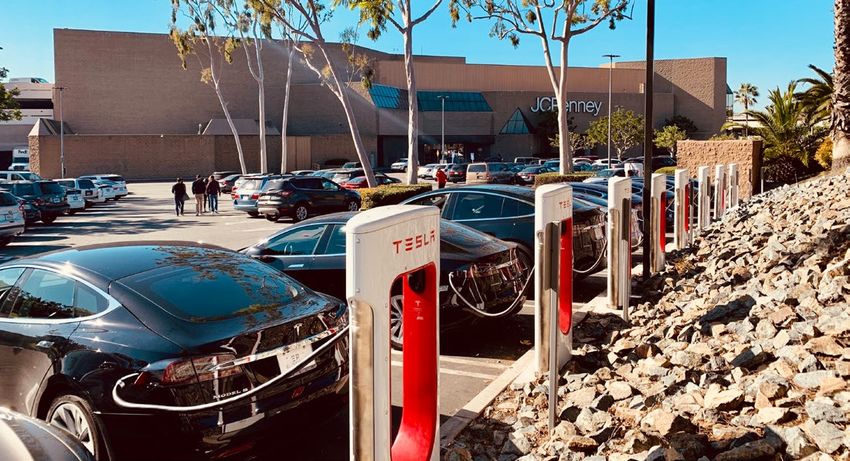
Executive Summary

                       Trends Assessment
                       As described in our key findings that follow,    Devastating as it has been, the COVID-19
                       our sector-level assessments range from          pandemic has not shaken the climate
                       substantially increased confidence to            commitment of US states, cities, and
                       unchanged confidence. For four of the five       businesses. In the midst of a public health
                       sectors our confidence increased while in the    and economic crisis, they have continued
                       fifth it was unchanged, despite the pandemic     to drive ahead—in many cases with even
                       and the recession. The pace and number of        greater resolve—toward a fully decarbonized
                       increased emissions reductions opportunities     economy by mid-century. Stimulus relief
                       are exceeding new risks and barriers.            could help put states and cities in a position
                                                                        to continue this trend.

     Exhibit 1 Overall Confidence in Ability to Achieve 2030 Emissions Reductions

                          CONFIDENCE LEVEL BY SECTOR
                                                                                             OVERALL
         Electricity      Transportation    Methane         Buildings       HFCs

         Increased          Modestly        Modestly       Unchanged      Increased
                            Increased       Increased                                             Modestly
                                                                                                  Increased

     Despite the challenges posed by the events of 2020, our sector-by-sector assessment
     modestly increases our confidence that bottom-up action can achieve the emissions
     reductions modeled in Accelerating America’s Pledge (2019).

8 | Delivering on America’s Pledge
Executive Summary
Exhibit 2
Since the last America's Pledge report in December 2019, states,
Selected Examples of Subnational cities, and businesses have continued to take significant climate
and clean energy actions. These are some highlights of successes
Climate and Clean Energy Successes that have occurred through August 2020.
DEC
2019 JAN FEB MAR APR
Colorado adopts New York state EPA reports that ALDI Washington state NRDC wins legal battle,
updated and announces $2 billion in installed climate-friendly adopts zero-emission forcing EPA to reinstate
strengthened utility efficiency and refrigerants in 110 vehicle (ZEV) program limits on HFC use
controls on electrification programs, additional stores in 2019
US Senate holds socially
emissions from oil including $434 million for
distanced hearing on HFC
and gas industry heat pumps legislation
California issues $45
million for heat pump
water heater incentives,
including $4 million for
low-income customers
Virginia commits to 100%
MAY JUN JUL zero-carbon electricity
Houston commits to 100%
renewable energy to power
all municipal operations
Kansas City commits to Lyft commits to achieve 15 states and DC commit to
AUG
carbon neutrality by 2040 100% electric vehicles (EVs) 100% zero-emission
on its platform by 2030 medium- and heavy-duty
vehicles by mid-century
Electrify America completes
the first cross-country EV New York launches $701
charging route million EV charging
infrastructure program Membership in ONE Future
Pennsylvania releases draft California passes Advanced coalition committed to
rules to reduce emissions Clean Trucks (ACT) rule industry-wide methane
from existing oil and gas
emissions reduction
infrastructure
increases to 27 companies
New Mexico releases draft
rules to reduce emissions
Xcel proposes $3 billion in from oil and gas industry
new efficiency programs and
Colorado and Virginia enact rebates North Dakota begins using
policies to phase out CARES Act funding to plug California finalizes clean car
super-polluting HFCs abandoned oil and gas wells agreements with six major
automakers
City of Jacksonville Electric
Authority and Florida Power
New Mexico approves 100%
& Light Company agree to Maryland Department of the
renewables and storage to
close one unit of largest US Environment proposes HFC
replace retiring coal capacity
coal plant regulations
Wisconsin-based WEC
Energy Group announces
carbon neutral electric 9
generation by 2050 targetExecutive Summary
Change in Confidence:
Increased
Modestly Increased
Unchanged
Exhibit 3 Change in Confidence by Driver
Decreased
ELECTRICTY
Coal Generation Has Declined Sharply, and Coal Retirements Have Accelerated
Long-term Drivers of Renewable Energy Investment Remain Strong
Economics of Gas Generation Face Headwinds, and Gas Buildout Holds Steady
Progress on State, City, and Business Clean Electricity is Mixed
T R A N S P O R TAT I O N
People Are Driving Less
Public Transit Is Facing an Existential Budget Shortfall
Electric Vehicle Prospects Appear Steady
Political Will Is Growing to Address Emissions from Heavy-Duty Transportation
METHANE
Prospects for Growth in US Oil and Gas Production Are Dimming
Methane Leaks from Existing Infrastructure Are Rising
Regulatory Landscape Continues to Shift
BUILDINGS
Trends in Efficiency Programs Are Mixed
Efforts to Electrify Are Progressing Despite Growing Signs of Opposition
HFCs
State HFC Action Is Expanding
Federal Regulatory Rollback Is Countering State-Level Action
10Executive Summary
Below we summarize our findings across all five sectors.
Electricity
The strong economic fundamentals of clean increased by more than 13 GW, with more
energy increase our confidence in continued utilities announcing plans to go coal-free
clean energy expansion consistent with our since then; EIA’s data show an 11.8 GW net
modeling in Accelerating America’s Pledge. increase in permitted utility-scale wind and
solar projects over the same few months.1
Electricity generation is continuing
to shift away from coal and towards While the pandemic and economic
renewables, indicating that we have passed downturn have slowed some renewables
a tipping point in the energy transition. projects and clean energy legislation, state
Between January and June 2020, the US clean electricity targets and voluntary clean
Department of Energy—Energy Information energy purchases by cities and businesses
Administration’s (EIA) monthly tally of are likely to continue to drive additions over
planned coal retirements beginning in 2021 the next decade.
Transportation
Accelerated progress on medium- and Meanwhile, light-duty emissions rules, zero-
heavy-duty electric vehicles and the potential emission vehicle standards, and electric
for long-term reductions in miles driven are vehicle sales are proving to be about on
expected to outweigh currently negative par with the Bottom-Up scenario, though
public transit trends. This modestly increases their impact may be slightly delayed due to
our confidence in the country’s ability to shift a temporary reduction in auto sales. Public
to electric vehicles and reduce vehicle miles transit agencies, which are projecting a $40
travelled (VMT) consistent with our modeling billion budget shortfall this year, will need
in Accelerating America’s Pledge significant support in upcoming economic
recovery and stimulus packages to restore
The United States will likely adjust to a and maintain service while protecting riders
“new normal” following the pandemic, and drivers.4
which may include enduring changes in
behavior around remote working and We expect the short-term increase in
e-commerce. Such changes could lead to a emissions from reduced transit commuting
permanent drop in VMT of as much as 10%.2 to be outweighed by the overall, enduring
Furthermore, states have announced goals reduction in VMT. The long-term trends in
that would reduce emissions from medium- this sector will depend on the extent and
and heavy-duty vehicles almost twice as durability of behavioral change around
fast as modeled in Accelerating America’s commuting and transit, as well as the pace
Pledge’s Bottom-Up scenario.3 of electrification.
Achieving Climate Progress in 2020 | 11Executive Summary
Methane
The oil and gas industry faces pressure in assets, and industry growth projections
from recent price shocks and reduced are lower through 2030 than we modeled
long-term demand expectations, including in 2019. These trends are already reducing
from accelerated global policy and industry infrastructure buildout and rig counts. If
support for electric light- and heavy-duty continued, these trends would substantially
vehicles. This pressure modestly increases reduce the potential for methane emissions
our confidence in the country’s ability to from new sources.
reduce methane emissions from oil and gas
systems consistent with our modeling in Key risk factors and uncertainties remain
Accelerating America’s Pledge. as regulatory trends continue to be
patchwork in nature and emissions from
Demand, production, and investment existing sources, particularly from idle and
have declined significantly as a result of abandoned wells, appear to be on the
near-term price shocks, and the long-term rise. However, we expect these risks to be
market outlook has weakened amid global outweighed by a diminished industry growth
oversupply and gathering policy and industry outlook and long-term policy trends.
support for vehicle electrification. In the first
quarter of 2020 alone, publicly traded US oil
producers wrote down at least $48 billion
Buildings
Recent trends are unlikely to have significant stalled program implementation, financial
long-term impacts, leaving our confidence investments, and policy enactment in other
largely unchanged in the country’s ability to jurisdictions. For example, Missouri, Ohio,
move toward continued efficiency increases and New Jersey regulators have proposed
and all-electric new buildings and appliances diverting funding from utility energy efficiency
consistent with our modeling in Accelerating programs into bill payment assistance funds.
America’s Pledge. Efforts to electrify new and existing buildings
have continued to grow, though electrification
Some jurisdictions are increasing investments policies have met with political resistance in
in efficiency to address the economic some states.
hardships brought on by the pandemic.
For example, Michigan and New York have
bolstered low-income efficiency programs
and energy assistance as a means of
helping ease high energy bills. However,
COVID-19 and the economic downturn have
12 | Delivering on America’s PledgeExecutive Summary
HFCs
Significant momentum in state-level HFC and air conditioning solutions, and industry
policies and the push for federal legislation is pushing for federal legislation requiring
outweigh federal regulatory rollbacks. phasedowns of high-global warming potential
This increases our confidence in the HFCs, in line with the Kigali Amendment.
country’s ability to phase down HFC use and These trends are likely to outweigh the
improve reclamation from existing systems negative impact of recent regulatory
consistent with our modeling in Accelerating rollbacks at the federal level and result
America’s Pledge. in HFC emissions reductions that exceed
expectations from our ambitious Bottom-Up
Most notably, 16 states have now passed scenario detailed in last year’s report.
or proposed HFC policies, businesses are
investing in climate-friendly refrigeration
In four of the five sectors—electricity, risks and barriers. Together these five sectors
transportation, methane, and HFCs—recent were responsible for over 75% of US GHG
trends are increasing confidence in the ability emissions in 2018 and provided nearly 95%
to achieve the modeled 2030 emissions of the economy-wide 2030 total avoided
reductions by states, cities, and businesses. emissions modeled in the Bottom-Up scenario
In the only remaining sector assessed— in Accelerating America’s Pledge.
buildings—prospects for emissions reductions
appear substantially unchanged from our
previous ambitious analysis. Overall, the
pace and number of increased emissions
reduction opportunities are exceeding new
Achieving Climate Progress in 2020 | 13Executive Summary
Stimulus and Recovery Opportunities
Accelerating America’s Pledge emphasized • Methane: programs to address idle and
that achieving those ambitious levels of abandoned wells and other infrastructure,
emissions reductions will require accelerated advanced monitoring and efficiency, and
market transformation and significant social support for state and local governments
and political mobilization around climate and at-risk communities
action. A massive, accelerated effort is still
needed from both the federal government • Buildings: zero-emissions buildings
and states, cities, and businesses to deploy and appliance incentives, weatherization
clean energy and other solutions at the speed and efficiency retrofits, and prioritizing
and scale envisioned in the scenarios from the low-income housing for efficiency
2019 report. and electrification
Federal economic recovery and stimulus • HFCs: heating, ventilation, and air-
packages provide a critical opportunity to conditioning (HVAC) industry and
maintain momentum and further spur needed consumer incentives for climate-friendly
climate action. Importantly, policies aimed conversions and end-of-life HFC disposal
at keeping state and local governments
solvent are likely to be key to continued Finally, the robustness of public attitudes and
momentum in the years ahead—without institutional commitments to clean energy,
this infusion, progress could slow, resulting even in the face of this great challenge, are
in an inability to achieve the needed 2030 strong validators of increasing demand for
emissions reductions. As we evaluate the key and political salience of a rapid clean energy
drivers in each sector, we identify key stimulus transition. Polling in June found that 71% of
opportunities that could accelerate progress Americans surveyed supported the goal of
toward needed 2030 emissions reductions a 100% clean energy economy by 2050. And
and help address risks to that progress. from 2015 to 2020, the community that feels
Investments in public transit and methane climate change is extremely important to
leak reduction are particularly critical to them personally has nearly doubled from 13%
avoid recent threats to modeled emissions to 25%.5
reductions. Key opportunities across the
sectors include: Continued leadership by diverse businesses
and cities across the political and geographic
• Electricity: renewable energy and storage spectrum, and a broad array of states,
financial incentives, grid modernization, combined with strong public opinion in favor
and just transition support of clean energy, demonstrate powerful,
resilient winds of change sweeping America’s
• Transportation: support for public energy landscape.
transit, electric vehicle manufacturing,
and charging infrastructure; purchase
incentives; workforce training; and
complete streets
14 | Delivering on America’s PledgeExecutive Summary
Exhibit 4 Potential Stimulus and Recovery Policies
Electricity
• Financial incentives for renewable energy and storage
• Investment in grid modernization
• Support for a just transition
Transportation
• Funding for public transit
• EV funding (manufacturing, purchase incentives, charging)
• Workforce training
• Complete streets
• Clean up idle and abandoned infrastructure
Methane
• Advanced monitoring and efficiency
• Funding support for local jurisdictions and at-risk
communities
Buildings
• Zero-emissions buildings and appliance incentives
• Expansion of weatherization and efficiency retrofitting
• Efficiency and electrification for low-income housing
• Tax credits for HVAC installers
HFCs
• Consumer efficiency incentives
• End-of-life HFC disposal
Achieving Climate Progress in 2020 | 15Introduction
America’s Pledge was established in 2017 Since the 2019 report, the COVID-19
to understand and communicate the pandemic and subsequent economic
collective impact of climate leadership by recession has had a wide-ranging and
US states, cities, and businesses. Our 2019 devastating impact on public health,
report, Accelerating America’s Pledge, employment, and economic security across
demonstrated the power and potential of the United States and the world. Individuals
these actors to drive US greenhouse gas and communities are suffering from loss
(GHG) emissions reductions by accelerating of life and income, disruptions to work,
the shift toward 100% clean energy; school, and childcare, and restrictions on
decarbonizing transportation, buildings, and daily activity that largely confine people to
industry; and enhancing the carbon storage their homes. At the same time, widespread
potential of natural and working lands. protests have increased attention from the
public, governments, and businesses on the
The 2019 analysis showed that ambitious need for racial and social justice.
and rapidly expanded bottom-up action
by states, cities, and businesses could States, cities, and businesses are facing
reduce US GHG emissions up to 37% unprecedented challenges and are working
below 2005 levels by 2030, even without to protect the health and well-being of
federal leadership. It found that an all- residents, employees, and customers
in, comprehensive strategy combining while facing major revenue losses from the
aggressive federal reengagement starting in economic downturn. As entities across the
2021 with expanded state, city, and business United States struggle to manage the public
efforts could reduce US GHG emissions 49% health crisis along with a rise in social unrest,
below 2005 levels by 2030. This would put increased unemployment, and significant
the United States on a pathway consistent financial challenges, they are being forced
with a net-zero carbon economy by 2050. to cut budgets, realign priorities, delay
16 | Delivering on America’s PledgeIntroduction
or cancel projects, and lay off or furlough To answer these questions, we focused
workers. For example, about 1.5 million jobs on five sectors—electricity, transportation,
were lost in state and local government from methane, buildings, and HFCs—which
March to early June.6 together provide almost 95% of the 2030
economy-wide total avoided emissions in
Although these challenges have disrupted the Bottom-Up scenario of Accelerating
legislative sessions, interrupted regulatory America’s Pledge.i For each, we identified
agendas, and delayed many energy projects, the key drivers affecting emissions
states, cities, and businesses continue to since the last report (whether explicitly
lead and often to accelerate climate action. COVID-related or not), characterized the
At the same time, the recession is changing direction and extent of recent trends, and
the market forces affecting the energy assessed their potential to affect emissions
transition, creating some dynamics that help reductions in 2030.
clean technologies and others that hinder
the transition. Together, these trends have
called into question whether the trajectory of
climate progress has improved, worsened, or
remained relatively unchanged.
In this report, we seek to answer:
• How have changes since the 2019
report, including COVID-19 and the
economic recession, affected bottom-up
climate progress?
• Have recent events increased or decreased
our confidence in the ability to achieve the
2030 emissions reductions modeled in
Accelerating America’s Pledge?
• How can COVID-related stimulus policies
be used to accelerate climate progress?
i
Electricity corresponds directly with Climate Action Principle 1 (Accelerate Toward 100% Clean Energy)
of Accelerating America’s Pledge. Transportation and buildings correspond directly with two of the
sectors within Principle 2 (Decarbonize End-Uses). Methane and HFCs are key parts of the industry
sector (also part of Principle 2) where we have seen a lot of movement over the last several months. Given
their cross-cutting nature, we chose to address methane and HFCs by gas instead of end use. Although
methane and HFCs are types of greenhouse gases, not economic sectors, we use the term “sectors” for
simplicity in this report to describe the industrial processes and infrastructure leading to emissions of
those gases.
Achieving Climate Progress in 2020 | 17Introduction
Exhibit 5 2018 GHG Emissions and 2030 Accelerating America’s Pledge
Emissions Reductions Potential by Sector
Emissions by Sector (Gross) in 2018 and 2030: Sectoral Share of Total
Bottom-Up Scenario Avoided Emissions
6.9%
7,000 3.0%
9.4%
6,000
3.6%
5,000
10.7% 66.4%
4,000
MMTCO2e
3,000
Avoided emissions
2,000 Other*
HFCs
1,000
Methane
Buildings
0
2018 2030 Transportation
Electricity
Source: EPA GHG Inventory, Accelerating America’s Pledge (2019)
* This graph focuses on the five sectors assessed in this 2020 analysis. “Other” is the sum of all remaining
sources of emissions, including CO2 emissions from the rest of industry and additional sources of non-CO2
emissions such as N2O emissions from agriculture. Sources of emissions and sinks from Land Use, Land Use
Change, and Forestry (LULUCF) are excluded from these totals. Due to stock and flow constraints, sectors with
smaller 2030 emissions reductions ramp up reductions significantly after 2030.
Across sectors, we separated trends that will include temporary behavior changes forced
have long-lasting effects from the immediate by shutdowns and market blips like the briefly
social and economic impacts that dominate negative oil prices in the spring. Similarly, we
2020 but are likely to prove more ephemeral. considered how quickly economic stimulus
Trends with long-lasting effects include measures and other policies could reinforce
investments in new infrastructure, while the positive trends or mitigate the risks.
immediate social and economic impacts
18 | Delivering on America’s PledgeIntroduction
Although we have assessed in depth the The report’s chapters are organized by
prospects for bottom-up climate action in sector, ordered based on their contribution
the United States—in light of the major social to modeled 2030 emissions reductions in
and economic disruptions of 2020—we have the Bottom-Up scenario from Accelerating
not updated the emissions scenario results in America’s Pledge. Importantly, some sectors
Accelerating America’s Pledge. The unknown will have greater contributions to emissions
course of the current recession and recovery reductions after 2030 because stock and flow
casts uncertainty on the rate of economic turnover takes time. In each chapter, we:
growth over the next decade. Any attempt
to offer an updated emissions assessment • Identify the emissions drivers
for 2030 would have a similarly wide range of
uncertainty. For example, the Rhodium Group • Describe each driver’s impact to date and
attempted to calculate the likely pathway to its likelihood to have a long-term impact
recovery and concluded that 2030 emissions
were likely to be from 2%–12% below its • Identify stimulus actions that can
previous estimate.7 accelerate climate progress while creating
jobs and stimulating the economy
We chose not to try to incorporate such a
wide range of economic pathways in this • Assess the net impact of all drivers in
report. While it is important to understand the sector
those uncertainties, our purpose here is to
evaluate whether the accelerated market We conclude by discussing the net impact of
transformation and significant social and trends across all sectors and summarizing the
political mobilization that we modeled in 2019 highest priority stimulus actions.
remains viable in the wake of COVID-19. We
conclude that it is.
Achieving Climate Progress in 2020 | 1901 Electricity
In 2018, electricity production generated Up scenario, while coal and gas without
27% of US greenhouse gas emissions, carbon capture, utilization, and storage
primarily from coal- and gas-fired electric would decrease their share of electricity
generators.8 Accelerating America’s Pledge generation from 24% and 37% to 7% and
found that changes in the electricity sector 32%, respectively.
would account for 1,226 MMTCO2e of
avoided emissions in 2030 in our Bottom-Up Whereas the electricity generation mix can
scenario—approximately two-thirds of the shift rapidly among existing power plants
economy-wide total avoided emissions in based on current market conditions, long-
2030. The report modeled that renewable term trends are driven by the deployment,
electricity market share would increase from retirement, and turnover of long-lived
17% in 2019 to 40% by 2030 in the Bottom- infrastructure and assets.
20 | Delivering on America’s PledgeElectricity
Trends Assessment
The following are major drivers of emissions • Nuclear generation: The prospects for
with potential long-term impacts: nuclear energy in the nation’s electricity
mix in the coming decade remain largely
• Coal generation has declined sharply, and unchanged from what we anticipated
coal retirements have accelerated, not only in 2019.
leading to emissions reductions in the
short term but also potentially speeding Overall, recent trends are reinforcing
progress toward deeper power sector the longer-term shift to clean electricity,
emissions reductions. increasing confidence in continued clean
energy expansion consistent with our
• Long-term drivers of renewable energy modeling in Accelerating America’s Pledge.
investment remain strong and, despite Reduced electricity demand has increased
any near-term disruptions to the industry, economic pressure on coal generation,
renewables’ role in the power sector will pushing it closer to a breaking point. The
continue to expand. This will enable the increasing contribution of renewables is
country to meet the bottom-up ambition largely market-driven and likely to prove
of Accelerating America’s Pledge. durable as states continue to increase their
clean electricity commitments.
• The economics of gas generation face
headwinds, and gas buildout holds steady, Stimulus and recovery packages targeting
suggesting that the pace of new gas plant renewable energy, grid modernization,
construction may not reach projected and transition opportunities for fossil fuel
high levels going forward. workers and local communities can help
accelerate progress toward needed 2030
• Progress on state, city, and business clean emissions reductions while creating jobs
electricity is mixed, with some actors and promoting equity. In contrast, a stimulus
continuing and others stalling action. package that ramps up fossil fuel use would
lock in decades of high-carbon, polluting,
Note that we do not discuss electricity and inefficient infrastructure.
demand or nuclear generation as separate
drivers for the following reasons:
Overall Change in Confidence for
• Electricity demand: The near-term
reduction in electricity demand is likely ELECTRICITY
to be temporary. We do discuss the
implications of reduced demand for
the economics of coal generation, as INCREASED
changing economic dynamics could have
a long-term emissions impact.
Achieving Climate Progress in 2020 | 21Electricity
Key Driver #1
Coal Generation Has Declined
Increased Sharply, and Coal Retirements
Have Accelerated
Coal is the only generation source with a
meaningful decline in generation in March,
April, and May 2020, compared to the same
period in 2019.9 The EIA forecasts that coal’s
share of electricity generation will fall from
24% in 2019 to 18% in 2020 and then will
rebound to 22% in 2021.10 Moody’s forecasts
that coal’s share will fall to 17% or below this
year and will not rebound in 2021, based on
its expectations of additional shutdowns
of coal-fired plants and persistently low
gas prices.11 • Arizona Public Service plans to obtain
100% clean power by 2050, with an
The combination of reduced power demand interim target of 65% by 2030.16
during the pandemic, reduced access to
capital for US coal companies, and increasing • Alliant Energy, which owns eight coal-fired
climate concerns could trigger new closure power plants across Iowa and Wisconsin,
announcements in the next couple of years.12 plans to reduce carbon emissions 50%
Monthly data on the status of generating below 2005 levels by 2030 and eliminate
units suggests this is already happening. In all coal-fired generation by 2040.17
January, generators reported 28.7 gigawatts
(GW) of planned coal retirements beginning • Wisconsin-based WEC Energy Group
in 2021; in June, reports showed 42.1 GW.13 plans to reduce emissions 70% below
Additional utilities have announced plans to 2005 levels by 2030 and to be carbon
go coal-free that are not captured in the June neutral by 2050.18
EIA report:
These pressures could speed progress
• Jacksonville municipal utility JEA and toward the deep power sector emissions
Florida Power & Light plan to retire reductions modeled in Accelerating
the 860 megawatt (MW) Unit 4 at Plant America’s Pledge, which projected in the
Scherer, the largest coal-fired power plant Bottom-Up scenario that 144 GW and 77 GW
in the country.14 of coal capacity would remain in operation
by 2025 and 2030, respectively. While our
• Tucson Electric Power plans to close its Bottom-Up scenario already expects much
remaining coal plants by 2032 and achieve of the coal capacity to be retired by 2030,
70% renewables by 2035.15 faster coal retirements can deliver emissions
reduction earlier in the decade, reducing
cumulative emissions.
22 | Delivering on America’s PledgeElectricity
Key Driver #2
Increased Long-Term Drivers of Renewable Energy Investment Remain Strong
The renewable energy industry appears to deepest period of the lockdown, 4 GW of
be weathering the pandemic relatively well, utility-scale solar and wind capacity were
despite pandemic-related disruptions to added, compared to 1.9 GW during the same
supply chains, labor, and project construction. period in the past year.20 This surge in 2020
installations is due to projects that began
Utility-scale solar and wind capacity is faring construction in previous years and need to
particularly well. In the first quarter of 2020, be operational by year-end to qualify for the
1.8 GW of utility-scale solar capacity was full Production Tax Credit and Investment Tax
added, which is 62% higher than in the first Credit under safe harbor rules.21
quarter of 2019.19 In April–June 2020, the
Exhibit 6 Utility-Scale Wind and Solar Capacity Additions
Wind Solar
4,500
4,000
3,500
3,000
Megawatts
2,500
2,000
1,500
1,000
500
0
Q1 Q2 Q1 Q2
2019 2020
Source: Energy Information Administration, Preliminary Monthly Electric Generator Inventory, June 2020.
Utility-scale wind and solar capacity additions have been higher in Q1 and Q2 of 2020
than in the corresponding periods of 2019.
Achieving Climate Progress in 2020 | 23Electricity
Notably, the EIA’s short-term outlook for projects from the January inventory which
2020 utility-scale wind and solar capacity commenced operation from February 2020,
installations increased from 31.7 GW in its this represents a net increase of 11.8 GW of
January outlook to 36 GW in its August wind and solar projects.
outlook (after an initial decrease). This
indicates that utility-scale renewable State, city, and business action supports
capacity installations are increasing despite this growth. For example, in May 2020, the
the pandemic. 22 In fact, EIA projects New Mexico Public Regulation Commission
renewables to produce more electricity approved two El Paso Electric solar power
than coal for all of 2020, whereas there were purchase agreement projects that will
only 38 days in 2019 renewables produced add a total 200 MW of solar and 50 MW
more electricity than coal. 23 That being said, of dispatchable battery storage. 27 States,
future renewable capacity additions could cities, and businesses are also advancing
be negatively affected if the economic battery storage to match increased
downturn is prolonged. renewable production. For example,
Southern California Edison signed seven
The impact of COVID-19 is more acute for contracts for 770 MW of battery-based
distributed solar, as the recession reduces energy storage to replace aging gas plants
consumer and business appetites for large in May 2020. 28
investments. The EIA’s non-utility solar
installation forecast for 2020 was revised Institutional investors remain positive
downward from 5.1 GW in the January about renewables’ long-term prospects
outlook to 3.3 GW in the August outlook. 24 and are increasing the capital they
However, this does not appear to reflect any allocate to renewables to hedge climate
long-term weaknesses for this market. State change exposure. 29 A survey of renewable
policies, such as California’s requirement energy investors reveals that, despite
that all new home construction must have the pandemic’s impact on the industry,
rooftop solar panels beginning this year, will investors remain as confident in renewable
help support the growth in the distributed energy growth over the next three years as
solar segment. 25 they were in 2018–2019.30 Rapidly declining
renewable energy costs, combined
There is no indication that COVID-19 has with maturation of energy storage, will
slowed down the planned construction continue to increase the competitiveness of
of renewable projects, though that might renewables.31 Overall, we expect renewable
change if economic recovery from the energy’s continued growth trajectory to
pandemic is sluggish. While the EIA’s remain strong and advance progress toward
January electric generator inventory had the bottom-up ambition of Accelerating
36.4 GW of utility-scale wind and solar America’s Pledge.
projects that had received regulatory
approval and commenced construction,
June’s inventory includes 41.9 GW of similar
planned projects. 26 Given that the June
data excludes 6.3 GW of wind and solar
24 | Delivering on America’s PledgeElectricity
Key Driver #3
Modestly Economics of Gas Generation Face Headwinds, and Gas Buildout
Increased Holds Steady
The EIA’s August short-term outlook Although New Mexico’s legislation was
projects gas-fired generation to increase to included in the Accelerating America’s
40% in 2020, which is higher than the 38% Pledge Bottom-Up scenario, the state’s
projection from the beginning of the year recent move indicates greater confidence
and the 2019 level of 37%. This reflects a among utilities and policymakers that the
1.3% increase in gas generation and a 3.9% grid does not need fossil fuels for reliability.
decrease in total generation. In fact, 68% of all customer accounts in the
United States are now served by utilities with
Nevertheless, as discussed further in the carbon reduction goals, including 27 utilities
methane chapter, the gas industry faces with goals to be carbon-free or net-zero
numerous challenges that could slow emission by 2050.38
the build-out of gas power plants. These
challenges are financial pressures on oil and EIA data also reflects that gas buildout has
gas companies, investor skepticism about more or less remained steady in the past
the long-term prospects of fossil fuels, few months. EIA’s January electric generator
and opposition to pipeline projects.32 The inventory reported 21.5 GW of planned
cancellation of the Atlantic Coast Pipeline, gas projects that had received regulatory
which would have transported fracked gas approval and/or commenced operation.39
from West Virginia to customers in Virginia Of this, more than 6.3 GW had come online
and the Carolinas, has raised questions by June. The June inventory reported 18.8
about the future role of gas in the US energy GW of planned gas projects, meaning that
mix.33 Duke Energy recently announced that between January and June 2020 3.6 GW of
it would shift its investment strategy toward new gas projects were added to the queue of
“low-cost, smaller-scale projects such as solar projects most likely to become operational.
and battery storage” to fill the investment
hole left by the canceled pipeline project.34 Taken together, the combination of economic
challenges facing the gas industry and the
In particular, the falling costs and increasing data showing that the pace of gas buildout
deployment of renewable energy is in the past few months has held steady
undermining the economic case for suggests that new gas projects may not
gas.35 Utilities in Arizona, Colorado, and reach levels anticipated at the end of 2019.
Florida have recently decided to close For instance, S&P Global estimated that 200
coal plants and replace them entirely with gas projects, totaling 70 GW capacity, were
renewables, without building new gas-fired planned or in development in December
plants.36 Similarly, New Mexico regulators 2019.40 Stimulus policies targeted towards
approved a plan to replace the San Juan renewable projects can help reinforce
coal capacity with 100% renewables and this trend and enable the United States to
storage, supporting the state’s 2019 Energy continue making progress towards a low-
Transition Act.37 carbon future.
Achieving Climate Progress in 2020 | 25Electricity
Key Driver #4
Unchanged Progress on State, City, and Business Clean Electricity Is Mixed
In recent months, many states, cities, and • The city and county of Honolulu required
businesses have taken action to reaffirm all new construction to be solar-ready.44
support for clean electricity policy.
For example: • Houston signed a contract and Chicago
took steps to power municipal operations
• Virginia enacted the Clean Economy Act, with 100% renewable energy by 2025.45
requiring the state to transition to 100% These are two of the largest municipal
carbon-free or renewable energy by 2050. renewable energy deals in US history, with
Virginia is now the eighth state in the a combined capacity of ~1 GW.
nation and the first in the South to require
100% clean electricity.41 • Houston and Dallas adopted ambitious
climate action plans with goals for carbon
• New York adopted legislation to neutrality by 2050.46
streamline renewable energy siting.42
• Wells Fargo announced a plan to buy 62.7
• Cincinnati announced that it is building MW of solar electricity, representing 8% of
the largest municipal solar array with its global energy needs.47
100 MW of installed capacity, which will
power all city facilities and serve the • Facebook signed contracts to buy 806
city’s residents.43 MW of additional solar and wind power to
support its operations.48
Interpreting Continued State, City, and Business Action
In this report, we have identified numerous able to continue their foundational work
actions that states, cities, and businesses for future policies and actions, given the
have taken during the pandemic that support economic challenges they currently face.
the clean energy transition. These actions
provide evidence that the COVID-19 crisis This year’s continued momentum could
has not dampened the desire to act or halted begin to fade as the economic crisis
action on the climate crisis. However, some continues and undercuts ongoing and future
caution is needed in interpreting these efforts. Economic recovery and stimulus
actions. Many of these recent actions, such as policies by the federal government aimed at
Virginia’s Clean Economy Act, resulted from keeping state and local governments solvent
significant efforts before the pandemic. is likely to be key to continued momentum
in the years ahead. The need for relief and
Similar announcements may continue in the prospect of stimulus is not just a “nice to
2020 based on the momentum of previous have,” it could be a “need to have” for cities,
groundwork. However, it is not clear to what counties and states.
extent states, cities, and businesses will be
26 | Delivering on America’s PledgeElectricity
However, action has slowed elsewhere. necessary to get onto a 1.5°C-aligned
Legislative sessions were shut down in emissions reduction pathway.
many states, stalling efforts in Minnesota
on a bill to prioritize carbon-free energy Jobs Trends and Stimulus
and strengthen the state’s energy efficiency Opportunities
standard, and in Illinois on a 100% In 2019, zero-emissions electricity sources
renewable energy bill.49 Other states are like solar and wind accounted for about
focusing on economic recovery and budget 544,000 jobs, more than twice as many as
challenges instead of clean energy. The the 214,000 jobs in fossil fuel generation.52
pandemic is also expected to temporarily In addition, another 800,000 American
slow corporate and public renewables workers were employed in electricity
procurement. According to Bloomberg transmission, distribution, and storage.
New Energy Finance, renewable energy Growth in clean energy jobs was projected
purchases by corporations and public to continue in 2020, but the economic fallout
institutions stood at 4.3 GW through July from COVID-19 has led to significant loss of
2020, compared to 6 GW during the same employment in the clean energy industry,
period in the past year.50 However, over including in renewable energy. At the end of
the long-term COVID-19 is not expected to July, renewable electric power generation
affect corporations’ decarbonization goals.51 lost 81,840 jobs, accounting for a 14%
drop in employment in the sector.53 Clean
As noted in Accelerating America’s Pledge, transmission, distribution, and storage jobs
significant social and political mobilization have also declined 15% from pre-pandemic
is still needed to deploy clean energy and employment levels.54
other solutions at the speed and scale
26Electricity
As part of stimulus and recovery, the jobs, $5.3 billion in total earnings, and $7.2
following investment opportunities could billion overall added value to the national
accelerate progress toward the emissions economy each year for five years.59 Texas’
reductions discussed above, while creating Competitive Renewable Energy Zones—
jobs and promoting equity. designated areas identifying routes for
construction of new transmission lines—led
Renewable energy financial incentives: to the construction of 3,600 miles of new
Extending the phasedown period for the transmission network and enabled Texas to
Production and Investment Tax Credits, add more than 18 GW of wind generation
expanding the list of eligible technologies capacity to the state’s power system while
to include storage and load management, cutting utility bills by billions of dollars.60
and creating direct pay options to address
industry concerns about liquidity could Just transition support: Support for fossil
stimulate growth and private investment fuel workers and communities should
in renewable energy.55 Phasing out or include covering income, training, and
eliminating fossil fuel subsidies with a strong relocation for workers facing job loss, as
emphasis on ensuring a just transition for well as transition programs to help diversify
workers in these industries can also accelerate economic activity in communities currently
progress towards a clean energy future.56 reliant on fossil fuels.61 The proposed
Environmental Justice for All Act calls for
One recent analysis found that extending the creation of a Federal Energy Transition
the Production and Investment Tax Credits Economic Development Assistance Fund
for five years and the Section §1603 Grant to support workers and communities as the
Program for two years while investing in country transitions away from fossil fuel.62
port infrastructure to advance offshore wind
could help create 497,800 direct, indirect,
and induced jobs per year for five years.
These actions would also generate $7.6
billion in added value each year and $1
billion in tax revenue.57
Grid modernization: Investment in
smart grid, storage, load management,
other distributed energy technologies, and
long-distance high voltage transmission
infrastructure would allow for better
integration of low-cost renewable energy and
a more resilient, efficient grid, while creating
jobs and sustained, economy-wide benefits.58
For instance, $25.4 billion in stimulus
spending for grid modernization would
create 73,100 direct, indirect, and induced
28 | Delivering on America’s PledgeYou can also read