Understanding each other's models: an introduction and a standard representation of 16 global water models to support intercomparison ...
←
→
Page content transcription
If your browser does not render page correctly, please read the page content below
Geosci. Model Dev., 14, 3843–3878, 2021
https://doi.org/10.5194/gmd-14-3843-2021
© Author(s) 2021. This work is distributed under
the Creative Commons Attribution 4.0 License.

Understanding each other’s models: an introduction and a standard
representation of 16 global water models to support
intercomparison, improvement, and communication
Camelia-Eliza Telteu1 , Hannes Müller Schmied1,2 , Wim Thiery3 , Guoyong Leng4 , Peter Burek5 , Xingcai Liu4 ,
Julien Eric Stanislas Boulange6 , Lauren Seaby Andersen7 , Manolis Grillakis8 , Simon Newland Gosling9 ,
Yusuke Satoh10 , Oldrich Rakovec11,12 , Tobias Stacke13 , Jinfeng Chang14,15 , Niko Wanders16 ,
Harsh Lovekumar Shah17 , Tim Trautmann1 , Ganquan Mao18 , Naota Hanasaki6 , Aristeidis Koutroulis19 ,
Yadu Pokhrel20 , Luis Samaniego11 , Yoshihide Wada21 , Vimal Mishra17 , Junguo Liu18 , Petra Döll1,2 , Fang Zhao22,23 ,
Anne Gädeke24 , Sam S. Rabin25 , and Florian Herz1
1 Institute of Physical Geography, Johann Wolfgang Goethe University Frankfurt, 60438 Frankfurt am Main, Germany
2 Senckenberg    Leibniz Biodiversity and Climate Research Centre (SBiK-F), 60325 Frankfurt am Main, Germany
3 Department of Hydrology and Hydraulic Engineering, Vrije Universiteit Brussel, Brussels, 1050, Belgium
4 Key Laboratory of Water Cycle and Related Land Surface Processes, Institute of Geographic Sciences and Natural

Resources Research, Chinese Academy of Sciences, Beijing 100101, China
5 Water Security Research Group, Biodiversity and Natural Resources Program, International Institute for Applied Systems

Analysis, Laxenburg, 2361, Austria
6 Center for Climate Change Adaptation (Climate Change Impacts Assessment Research Section), National Institute for

Environmental Studies, Tsukuba, 3058506, Japan
7 Earth System Analysis, Potsdam Institute for Climate Impact Research, 14473 Potsdam, Germany
8 Institute for Mediterranean Studies, Foundation for Research and Technology-Hellas, Rethymno, 74100, Greece
9 School of Geography, University of Nottingham, Nottingham, NG7 2RD, United Kingdom of Great Britain

and Northern Ireland
10 Earth System Division (Earth System Risk Analysis Section), National Institute for Environmental Studies,

Tsukuba, 3058506, Japan
11 Department Computational Hydrosystems, UFZ-Helmholtz Centre for Environmental Research, 04318 Leipzig, Germany
12 Faculty of Environmental Sciences, Czech University of Life Sciences Prague, Prague, 16500, Czech Republic
13 Institute of Coastal Research, Helmholtz-Zentrum Hereon, 21502 Geesthacht, Germany
14 College of Environmental and Resource Sciences, Zhejiang University, Hangzhou, 310058, China
15 Laboratoire des Sciences du Climat et de l’Environnement, CEA-CNRS-UVSQ/IPSL, Université Paris Saclay,

Gif-sur-Yvette, 91191, France
16 Department of Physical Geography, Utrecht University, Utrecht, 3508, the Netherlands
17 Indian Institute of Technology Gandhinagar, Palaj, Gandhinagar, 382355, India
18 School of Environmental Science and Engineering, Southern University of Science and Technology,

Shenzhen, 518055, China
19 School of Environmental Engineering, Technical University of Crete, Chania, 73100, Greece
20 Department of Civil and Environmental Engineering, Michigan State University, East Lansing, Michigan 48824, USA
21 Biodiversity and Natural Resources Program (BNR), International Institute for Applied Systems Analysis,

Laxenburg, 2361, Austria
22 Key Laboratory of Geographic Information Science (Ministry of Education), School of Geographic Sciences,

East China Normal University, Shanghai, 200241, China
23 Transformation Pathways, Potsdam Institute for Climate Impact Research, 14473 Potsdam, Germany
24 Climate Resilience, Potsdam Institute for Climate Impact Research, 14473 Potsdam, Germany

Published by Copernicus Publications on behalf of the European Geosciences Union.
3844 C.-E. Telteu et al.: Understanding each other’s models
25 Karlsruhe
Institute of Technology, Institute of Meteorology and Climate Research Atmospheric Environmental Research,
82467 Garmisch-Partenkirchen, Germany
Correspondence: Camelia-Eliza Telteu (camelia.telteu@gmail.com, telteu@em.uni-frankfurt.de)
Received: 2 November 2020 – Discussion started: 8 January 2021
Revised: 5 May 2021 – Accepted: 12 May 2021 – Published: 24 June 2021
Abstract. Global water models (GWMs) simulate the terres- tunity to inter-compare models for an improved understand-
trial water cycle on the global scale and are used to assess ing of process representation and inter-model differences as
the impacts of climate change on freshwater systems. GWMs well as for model improvement. Some MIPs examples in-
are developed within different modelling frameworks and clude FireMIP for the fire regime and its drivers (Rabin et
consider different underlying hydrological processes, leading al., 2017); CMIP for past, present, and future climate changes
to varied model structures. Furthermore, the equations used and their drivers (Eyring et al., 2016; Kageyama et al., 2018);
to describe various processes take different forms and are LakeMIP for physical and biogeochemical processes of lakes
generally accessible only from within the individual model (Stepanenko et al., 2010; Thiery et al., 2014); AgMIP for
codes. These factors have hindered a holistic and detailed crop growth (Rosenzweig et al., 2013); and WaterMIP or
understanding of how different models operate, yet such an ISIMIP for the water cycle (Haddeland et al., 2011; Frieler
understanding is crucial for explaining the results of model et al., 2017).
evaluation studies, understanding inter-model differences in MIPs have encountered many challenges as to how to
their simulations, and identifying areas for future model de- inter-compare models and interpret various model results
velopment. This study provides a comprehensive overview (von Lampe et al., 2014), realize the standardization of data
of how 16 state-of-the-art GWMs are designed. We anal- and scenarios and integrate transdisciplinary knowledge in
yse water storage compartments, water flows, and human modelling (Rosenzweig et al., 2013), and identify and reduce
water use sectors included in models that provide simula- uncertainties (Sitch et al., 2008). They have been affected by
tions for the Inter-Sectoral Impact Model Intercomparison scientific complexity, input data quality, technical infrastruc-
Project phase 2b (ISIMIP2b). We develop a standard writing ture, and even cultural and organizational challenges (Eyring
style for the model equations to enhance model intercompar- et al., 2016). Hence, they have evaluated model performance
ison, improvement, and communication. In this study, Wa- in the past and have focused on inter-model agreement for
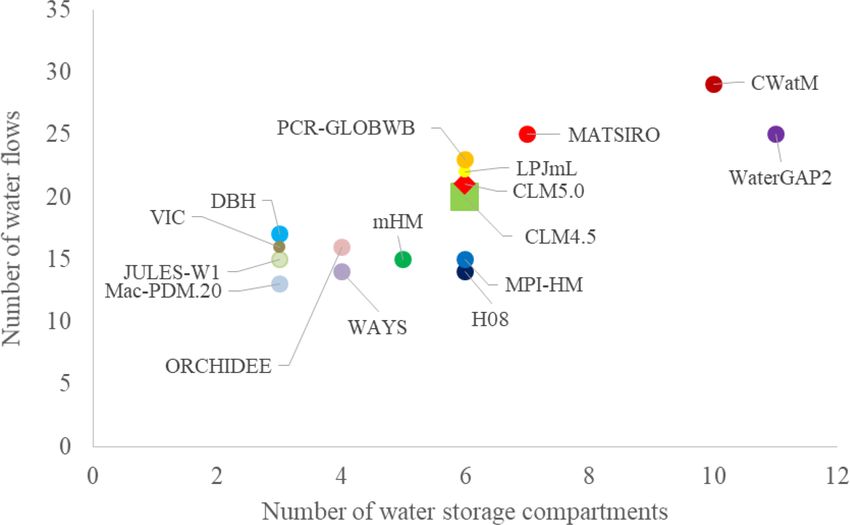
terGAP2 used the highest number of water storage compart- the future. Ultimately, MIPs and their multi-model ensem-
ments, 11, and CWatM used 10 compartments. Six models bles have been blocked from interpreting inter-model dif-
used six compartments, while four models (DBH, JULES- ferences because of model complexity, missing information
W1, Mac-PDM.20, and VIC) used the lowest number, three about other models, incomplete or missing information about
compartments. WaterGAP2 simulates five human water use heterogeneity, and dynamism of natural systems (M. P. Clark
sectors, while four models (CLM4.5, CLM5.0, LPJmL, and et al., 2011).
MPI-HM) simulate only water for the irrigation sector. We Nevertheless, MIPs have underlined the need to go beyond
conclude that, even though hydrological processes are often good overall model performance and to improve process rep-
based on similar equations for various processes, in the end resentation in the models (Guseva et al., 2020), integrate
these equations have been adjusted or models have used dif- missing processes (Friend et al., 2014), and reduce uncertain-
ferent values for specific parameters or specific variables. ties (Warszawski et al., 2014). MIPs showed that robust sim-
The similarities and differences found among the models ilarities exist among models, and as a result models are not
analysed in this study are expected to enable us to reduce strictly independent of each other given previous and legacy
the uncertainty in multi-model ensembles, improve existing versions, and there are existing links among modelling com-
hydrological processes, and integrate new processes. munities who indirectly transfer some models’ strengths and
weaknesses by sharing their ideas and codes (Masson and
Knutti, 2011; Knutti et al., 2013). It has been demonstrated
that there is no perfect model (Essery et al., 2013; Ullrich et
1 Introduction al., 2017) and that there is a need to understand better how
different models work.
Many multi-model intercomparison projects (MIPs) have
Thereby, the modelling communities are still testing and
been designed to provide insights into various Earth system
learning how to improve modelling and how to realize multi-
processes. They provide many multi-model ensembles con-
model inter-comparison studies. However, few studies have
sisting of multiple models driven by the output of multiple
undertaken model experiments on process representation and
other models. These multi-model ensembles offer the oppor-
Geosci. Model Dev., 14, 3843–3878, 2021 https://doi.org/10.5194/gmd-14-3843-2021
C.-E. Telteu et al.: Understanding each other’s models                                                                      3845

evaluated the models for specific events or characteristics       global freshwater system. We present the modelling ap-
specifically on the catchment scale (de Boer-Euser et al.,        proaches and terminology used in global water modelling
2017; Duethmann et al., 2020; Bouaziz et al., 2021). Further-     in Sect. 2. In Sect. 3, we present key characteristics of the
more, some studies have tested how model equations com-           models analysed in the present study. In Sect. 4, we describe
bined in different configurations and using different parame-     our standard writing style of model equations. In Sect. 5, we
ter values influence the simulations, e.g. Essery et al. (2013)   present similarities and differences among models. In Sect. 6,
(testing 1701 snow model configurations), Niu et al. (2011)       we present the number of water flows, water storage com-
(Noah-MP model), Pomeroy et al. (2007) (Cold Regions Hy-          partments, and human water use sectors included in the 16
drologic Model, CRHM), and Kuppel et al. (2018) (Ecohy-           GWMs. In Sect. 7, we discuss potential future research in
drologic model, EcH2 O). In summary, they found that some         global water modelling. Finally, in Sect. 8, we present recom-
model configurations provide consistently good results, oth-      mendations for future multi-model intercomparison projects
ers provide consistently poor results, and many configura-        and extended assessments.
tions provide good results in some cases and poor results in
others (Essery et al., 2013).
   In this complex scientific context, the present study rep-     2     Modelling approaches and terminology used in
resents a step forward toward advancing the understanding               global water modelling
of process representation and inter-model differences within
one large MIP, specifically, ISMIP – the Inter-Sectoral Im-       2.1    Differences in modelling approaches
pact Model Intercomparison Project (Frieler et al., 2017). We
assessed the equations applied by 16 state-of-the-art global      On global scale, the terrestrial water cycle is simulated by
water models (GWMs) to simulate the vertical and lateral          three different communities that have developed three types
water balance and human water use sectors on the global           of models: (i) the climate community that has developed
scale. We created a standard writing style for these equa-        land surface models (LSMs), (ii) the global hydrological
tions to identify similarities and differences among models.      community that has developed global hydrological models
Our goal is to provide the global water community with an         (GHMs), and (iii) the vegetation community that has devel-
overview of the model structures and the basis required to        oped dynamic global vegetation models (DGVMs). In this
interpret various model results and to design future experi-      study, the land surface models are CLM4.5, CLM5.0, DBH,
ments on how model equations, model configurations, and           JULES-W1, MATSIRO, and ORCHIDEE. The global hydro-
model parameter values influence the model outputs.               logic models are CWatM, H08, Mac-PD20, mHM, MPI-HM,
   The three main objectives of the study are as follows:         PCR-GLOBWB, VIC, WaterGAP2, and WAYS. One model
                                                                  (LPJmL) is a dynamic global vegetation model.
  – to provide a better understanding of how 16 state-of-the-
                                                                     However, these three communities focus on specific hy-
    art global water models are designed;
                                                                  drological and atmospheric processes, as well as anthro-
  – to show similarities and differences among them, based        pogenic impacts. These key aspects are important for their
    on their equations;                                           specific research, leading to different modelling approaches,
                                                                  specific evaluation studies of model performance (Archfield
  – to underline future research potential in global water
                                                                  et al., 2015), and different field-specific meanings of termi-
    modelling.
                                                                  nology used (Beven and Young, 2013). Thus, combining the
Essentially, this study supports intercomparison, improve-        expertise in their key aspects would create a strong synergy
ment, and communication among 16 modelling teams.                 and improve the models of these communities, but for this
It also provides the basis for (i) further water model            goal they have to interact with each other, identify their sim-
(inter-)comparison studies, including model outputs, (ii) se-     ilarities and differences, and share experiences. They need to
lecting the right model(s) for a given application, and (iii)     undertake joint experiments, share and discuss their results,
identifying data needs for a given analysis and application.      and discuss how they influence and depend on each other and
We believe that two considerations are useful in the interpre-    how water modelling can be improved (Cucchi et al., 2020).
tation of model results: (i) knowing model structures and (ii)       The global hydrological community focuses primarily on
identifying the effect of model structures on model results.      surface water and groundwater availability, its human inter-
The present study is focused only on the first consideration      ference, and the changes of the water cycle. GHMs simulate
because understanding model configurations is needed to in-       the water cycle with its water flows, water compartments,
terpret various model results.                                    and human water use sectors. These models simulate water
   Our target audience includes students, junior and senior       abstracted for the irrigation, domestic use, livestock, indus-
scientists, and modellers (or people who want to become           try (manufacturing and electricity), and desalination sectors.
modellers). Furthermore, this study could be used by stake-       Furthermore, reservoir management and its streamflow alter-
holders or other people who want to understand the back-          ation are included. One of their main foci is streamflow simu-
ground of global water models and how they simulate the           lation and their ability to reproduce historical observations of

https://doi.org/10.5194/gmd-14-3843-2021                                            Geosci. Model Dev., 14, 3843–3878, 2021
3846 C.-E. Telteu et al.: Understanding each other’s models
this variable. They focus on lateral and vertical flows, com- 2.2 Definitions used in global water modelling
prehensively simulating the following surface water bodies:
(i) lakes, (ii) wetlands, (iii) rivers. A global water model describes the dynamic behaviour of a
The climate community focuses on simulating climate and hydrological system that includes input variables, state vari-
its change over decades and centuries using global climate ables, parameters, constants, and output variables (Bierkens
models (GCMs) and Earth system models (ESMs). A funda- and van Geer, 2007). State variables define how much wa-
mental component of these are the LSMs, which simulate the ter is in a compartment or storage at the beginning of the
water and energy exchanges between the land surface and the simulation and can change in space and time, for example,
atmosphere, specifically focusing on vertical flow exchanges. soil water storage. Their variation is caused by a variation
Therefore, these models simulate the energy cycle, the wa- of the input variables, for example, precipitation. State vari-
ter cycle, the carbon and nitrogen cycles, and vegetation and ables are related to the input variables and output variables
crop responses to temperature, precipitation, and CO2 con- through parameters, for example, infiltration capacity of the
centrations. Further, they represent the soil with a higher ver- soil. Parameters and coefficients represent numbers that de-
tical resolution and evapotranspiration and snow dynamics in scribe a particular characteristic of reality, of the model, or
a more physical manner than the global hydrological models of the catchment area or flow domain. Some examples are
(GHMs; Döll et al., 2016; Pokhrel et al., 2016; Wada et al., soil porosity, hydraulic conductivity of different soil hori-
2017). zons, maximum soil water storage, maximum canopy wa-
The vegetation community focuses on vegetation distribu- ter storage, mean residence time in the saturated zone, sur-
tion and growth in an area and over a time interval and is face roughness, and vegetation properties (Beven, 2012). A
primarily interested in the global carbon cycle. DGVMs sim- model also uses physical and mathematical constants mean-
ulate shifting vegetation, driven by biogeochemistry, hydrol- ing characteristics of the model that do not change in space
ogy, and anthropogenic influences. These models simulate and time such as catchment area. Physical constants are phys-
the vegetation composition and distribution as well as com- ical quantities that can be measured and have a constant value
partments and flows of carbon and water, for both natural and in time, for example, the density of water at 0 ◦ C, i.e. the den-
agricultural ecosystems. Specifically, they model the active sity of ice. Mathematical constants cannot be measured but
response of vegetation to changes in air temperature, precip- can be calculated and have a fixed numerical value, for ex-
itation, and CO2 concentrations. ample, e = 2.718. . . , π = 3.142. Ultimately, output variables
The different viewpoints of these communities are readily are results of the simulation and vary in space and time, for
visible in very basic concepts such as the solar energy. This example, streamflow in a river catchment.
is the main driver that connects the processes of terrestrial Thus, a global water model includes many equations writ-
water cycle simulated by these communities. It specifically ten with a programming language in a model code to simu-
links the water and energy budgets with vegetation processes. late freshwater systems. During simulations, many parame-
This link can be exemplified by the latent heat flux of evapo- ters receive specific values because they cannot be measured
ration that describes the heat or the energy required to change everywhere, therefore, they are calibrated or tuned or esti-
the liquid water into water vapour. This heat or energy is mated from auxiliary data that can be measured (such as
locked in the humid air as water vapour and is released when lookup tables for vegetation properties based on remote sens-
the humid air touches cold air and water vapour condensa- ing observations) to attain the best match between simulated
tion starts. Therefore, continental evaporation is considered and observed data. The final step of a simulation is to val-
to be water loss by the global hydrological and vegetation idate (evaluate) simulated model output with observed data
modelling communities but a water source (for cloud for- through analysis and visualization.
mation) by the climate community (those that simulate the
atmosphere), with implications for agriculture and ecosys-
tems (Abbott et al., 2019). Additionally, transpiration repre- 3 Key characteristics of 16 global water models
sents a water source for the vegetation community, necessary included in the study
for photosynthesis and plant growth, and water loss for the
global hydrological community. In this study, we analyse 16 state-of-the-art global water
Overall, these three communities have developed three models included in the global water sector of the Inter-
types of models to simulate the terrestrial water cycle on the Sectoral Impact Model Intercomparison Project phase 2b
global scale despite fundamental differences in model struc- (ISIMIP2b: Frieler et al., 2017). GWMs include six land
ture, model equations, and output variables. Hence, we de- surface models (LSMs), nine global hydrologic models
cided to include the three types of models in one group and (GHMs), and one dynamic global vegetation model (DGVM:
call them global water models (GWMs). LPJmL, Tables 6 and 12). These models, as applied within
the ISIMIP2b framework, are suitable for application over a
catchment size of at least four grid cells (Döll et al., 2003;
Hunger and Döll, 2008). For smaller catchments, the results
Geosci. Model Dev., 14, 3843–3878, 2021 https://doi.org/10.5194/gmd-14-3843-2021C.-E. Telteu et al.: Understanding each other’s models 3847
are often not reasonable (e.g. Beck et al., 2016) and require 2000). Five models (DBH, JULES-W1, Mac-PDM.20, VIC,
corrections due to inaccurate input data, spatial heterogene- and WAYS) do not use any river-routing scheme for the
ity, and the missing representation of some hydrological pro- ISIMIP2b because they do not compute streamflow.
cesses (Döll et al., 2003; Hunger and Döll, 2008).
3.4 Calibration approaches for ISIMIP2b
3.1 General setup
Three GWMs perform calibration of their hydrological com-
These models contribute to an experiment setup designed to ponents, using different approaches, for ISIMIP2b (Table 6).
assess the impact of historical and future warming under the WaterGAP2 uses a basin-specific approach to match long-
Paris Agreement (Frieler et al., 2017). They are driven by term mean annual observed streamflow at the outlet of 1319
the same climate input datasets under representative con- river basins. It considers runoff as a nonlinear function of
centration pathways (RCPs) and socioeconomic scenarios soil moisture and uses a runoff coefficient plus up to two ad-
(SSPs). The time span of the simulations is divided into pre- ditional factors for calibration (Müller Schmied et al., 2014,
industrial (1661–1860), historical (1861–2005), and future 2021). In mHM, calibration of global model parameters is
(RCP2.6, RCP6.0, and RCP8.5, 2006–2099 (2299)). These performed against the daily observed streamflow, along with
models simulate the terrestrial water cycle on the global land gridded global fields of FLUXNET evaporation (Jung et al.,
area (except Antarctica) and quantify water flows, water stor- 2011) and a GRACE terrestrial water storage anomaly, us-
age compartments, and human water use under the given cli- ing the ERA5 climate forcing (Landerer and Swenson, 2012).
matic and socioeconomic conditions. They do not simulate WAYS is calibrated against data from the International Satel-
the ocean component of the global water cycle or water qual- lite Land Surface Climatology Project (ISLSCP) Initiative II
ity. Some of these models also consider reservoir operations. of the University of New Hampshire and GRDC compos-
ite monthly runoff data (Fekete et al., 2011) from 1986 to
3.2 Temporal and spatial characteristics 1995 at a 0.5◦ spatial resolution. Seven models (CLM4.5,
CWatM, DBH, JULES-W1, MATSIRO, ORCHIDEE, and
A total of 12 models have a daily temporal resolution (Ta- PCR-GLOBWB) adjust some parameters according to vege-
ble 6), while 2 models have a 6-hourly resolution (CLM4.5 tation or soil properties, but they have no hydrologic calibra-
and CLM5.0). MATSIRO has an hourly resolution, and OR- tion. LPJmL does not calibrate hydrology, although it cali-
CHIDEE has 30 min temporal resolution. The 15 models run brates crop yield.
with a spatial resolution of 0.5◦ . ORCHIDEE runs with a spa-
tial resolution of 1.0◦ and has its outputs converted to 0.5◦
spatial resolution. Some models include subgrids for some 4 Creating the standard writing style of model
components: CLM4.5 and CLM5.0 for vegetation, surface equations
runoff, and evapotranspiration; H08 and CWatM for land
cover; MPI-HM for surface runoff and evapotranspiration; In this study, the rationale in finding similarities and differ-
PCR-GLOBWB for vegetation and land cover; WaterGAP2, ences among 16 GWMs is based on how models simulate the
CWatM, and MATSIRO for snow; and VIC for vegetation terrestrial water cycle. We created a standard writing style for
and elevation. Furthermore, MATSIRO divides a subgrid cell model equations and used the same symbols to write those
into snow-covered and snow-free portions with flows and equations, following seven steps to achieve our main goal.
storages resolved separately for these portions both for land
and canopy surfaces. 4.1 Investigation of 16 global water models
3.3 River networks used Generally, the models have different style in describing their
structure, defining their variables, and writing their equa-
Nine models (CLM4.5, CLM5.0, CWatM, H08, LPJmL, tions. Furthermore, a unique equation can be implemented
MATSIRO, MPI-HM, PCR-GLOBWB, WaterGAP2) use the in various ways (e.g. discrete vs. analytical form, focusing
30 min global drainage direction map DDM30 (Döll and on flows or water compartments) or can use different model
Lehner, 2002), a raster map with a spatial resolution of parameter values. Therefore, we started our study with a liter-
0.5◦ × 0.5◦ (∼ 50 km × 50 km), to outline the drainage di- ature review on the 16 GWMs analysed in the present study.
rections of surface water collected by creeks, rivulets, and We analysed the nomenclature of each model to identify a
rivers. In this map, 67 420 discrete grid cells are character- good way of writing the model equations and habits that ex-
ized by their specific drainage direction and are organized ist in global water modelling. Another aim was to familiarize
into drainage basins that drain from the Earth’s land sur- ourselves with model equations.
face into the ocean or inland sinks. The mHM uses a river
network (0.5◦ × 0.5◦ ) upscaled from HydroSHEDS (Lehner,
2019). ORCHIDEE uses the river network from the Sim-
ulated Topological Networks (STN-30p: Vörösmarty et al.,
https://doi.org/10.5194/gmd-14-3843-2021 Geosci. Model Dev., 14, 3843–3878, 20213848 C.-E. Telteu et al.: Understanding each other’s models
4.2 Generation of the lists with water storage computed by MPI-HM was submitted as sub-surface runoff,
compartments, flows, and human water use sectors but considering that this baseflow storage acts similarly to a
included in 16 global water models groundwater storage, drainage could be used as groundwa-
ter recharge in ISIMIP3a/b. Consequently, its outflow could
In the next step, we assembled a list with water storage be submitted as groundwater runoff. However, the purpose
compartments and human water use sectors included in the of this baseflow storage, for MPI-HM, is predominantly to
models to simulate the terrestrial water cycle. We decided cause a delay in river discharge and not to simulate ground-
to describe 16 GWMs based on the equations implemented water in detail.
for eight water storage compartments and six human water We decided to define “groundwater recharge” as the
use sectors. The analysed water storage compartments are amount of water that reaches the groundwater storage, be-
canopy, snow, soil, groundwater, lake, wetland, reservoir, and cause of its hydrological meaning. However, we found out
river. The human water use sectors are irrigation, domestic that the words “drainage” (MPI-HM), “aquifer recharge”
(households), livestock, manufacturing, and electricity. Thus, (CLM4.5), and groundwater recharge (GHMs) are used syn-
the present model intercomparison study is based on the lists onymously among 16 GWMs. ISIMIP2b relates “seepage”
presented in Tables 1 to 5. with groundwater recharge for the models that do not include
a groundwater storage, supposing that this water would reach
4.3 Creation of glossary with variable definitions groundwater storage if it would exist.
Another discovery was that “throughfall” and “drip” in
We decided upon clear definitions of the analysed variables. some models were considered synonyms and that they were
However, we encountered many ambiguities and challenges used to describe precipitation that falls to the ground through
in defining the analysed variables and labelling processes as canopy spaces (CLM4.5, CLM5.0, MATSIRO). In this case,
being similar or different among them. Some examples are we decided to separate these words and to define throughfall
presented in the following lines. We present other definitions as being precipitation that falls to the ground through canopy
of water storage compartments, flows, and human water use spaces and drip as being precipitation that leaks at the edge
sectors used in this paper in the Supplement (Table S84). of canopy.
We decided to use the expression “input data” for climate In this study, we define streamflow as the volumetric flow
variables of the 16 GWMs to avoid confusion among readers. rate of water through a river cross section. Therefore, the
We define “parameterization” as changes of model parameter streamflow is the water transfer that is routed through a chan-
values (Samaniego et al., 2010). nel towards the ocean or towards an inland sink. We define
We use “active vegetation” to highlight if models include the total runoff as the (not routed) total amount of water that
the photosynthesis scheme in their structure and if they have runs off the grid cell, either over the soil surface or from the
the ability to simulate active changes in vegetation in an area sub-surface (lateral flow). In some studies, the streamflow is
because of changes in the CO2 concentration, air tempera- converted to runoff by dividing the streamflow values with
ture, and precipitation. We use “dynamic vegetation” to de- the area upstream of the gauging station (for example, the
fine changes in vegetation from one geographical area to an- area upstream of station according to the DDM30 river net-
other because of competitive and biogeographical processes work; see Döll and Lehner, 2002).
determined by climate change (geographical distribution of In summary, in global water modelling, we need to be
plants) or human activities. We decided to use “sub-surface aware of differences in vocabulary. A widely accepted list
runoff” synonymously with “interflow” and to define it as the of definitions would avoid confusion and facilitate success-
amount of water that leaves the soil layer laterally. ful interaction and collaboration. Furthermore, we need to
We define “baseflow” as the low part of the streamflow that clarify hydrological terms for peers from other disciplines,
is supplied by groundwater, drainage from lakes, wetlands, stakeholders, and a general audience (Brunner et al., 2018)
glaciers, and interflow during long periods when no precipi- to facilitate easier communication, understanding, and anal-
tation or snowmelt occurs. Ultimately, we have excluded the ysis.
variable baseflow from the analysis because it is not simu-
lated by 16 GWMs in ISIMIP2b. 4.4 Variable naming
We discovered that “groundwater runoff” and baseflow are
used synonymously and define the water that leaves ground- We notated each variable of model equations. We used mul-
water storage. We also found that baseflow and sub-surface tiple subscripts and superscripts to properly identify water
runoff are used synonymously, and define the amount of wa- storage compartments, flows, and human water use sectors
ter estimated for the third soil layer (VIC). We noticed that because of the large number of storage compartments in-
MPI-HM includes additional storage, called “baseflow stor- cluded in the model structures. We selected “S” to describe
age”, that collects the drainage leaving through the bottom water storage, “P ” to describe everything connected to pre-
of the soil storage and applies a substantial time lag before cipitation, “E” for everything related to evaporation, “R” for
passing it on to the river storage. In ISIMIP2b, the drainage everything related to runoff, “Q” for everything related to
Geosci. Model Dev., 14, 3843–3878, 2021 https://doi.org/10.5194/gmd-14-3843-2021C.-E. Telteu et al.: Understanding each other’s models 3849
Table 1. Canopy compartment and its water flows included in ISIMIP2b global water models.
Canopy water storage (Sca ) (Table S3): CLM4.5, CLM5.0, CWatM, DBH, JULES-W1, LPJmL, mHM, MATSIRO,
ORCHIDEE, PCR-GLOBWB, VIC, WaterGAP2, WAYS.
Inflows.
– total precipitation (Ptot ) (sum of rainfall and snowfall, as input data): CWatM, DBH, JULES-W, LPJmL, mHM,
ORCHIDEE, PCR-GLOBWB, VIC, WaterGAP2, WAYS.
– precipitation intercepted by canopy storage (Pint ): CLM4.5, CLM5.0, MATSIRO.
Outflows.
– evaporation of the water intercepted by canopy or interception loss or canopy evaporation (Eca ): CLM4.5, CLM5.0,
CWatM, DBH, JULES-W1, LPJmL, mHM, MATSIRO, ORCHIDEE, PCR-GLOBWB, VIC, WaterGAP2, WAYS.
– throughfall (Pth ): CLM4.5, CLM5.0, CWatM, DBH, JULES-W1, LPJmL, MATSIRO, mHM, ORCHIDEE,
PCR-GLOBWB, VIC, WaterGAP2, WAYS.
Table 2. Snow and soil compartments and their water flows included in ISIMIP2b global water models.
Snow storage (Ssn ) (Table S8): CLM4.5, CLM5.0, CWatM, DBH, H08, JULES-W1, LPJmL, Mac-PDM.20, mHM,
MATSIRO, MPI-HM, ORCHIDEE, PCR-GLOBWB, VIC, WaterGAP2, WAYS.
– snow held on the canopy (Ssoc ): CLM5.0, DBH, JULES-W1, MATSIRO, VIC.
– snow under the canopy (Ssuc ): CLM4.5, CLM5.0, DBH, JULES-W1, MATSIRO, ORCHIDEE, VIC.
Inflows.
– total precipitation (Ptot ): CWatM, DBH, JULES-W1, WaterGAP2.
– snowfall (Psn ): CLM4.5, CLM5.0, H08, Mac-PDM.20, MATSIRO, mHM, MPI-HM, PCR-GLOBWB, WAYS.
– throughfall (Pth ): LPJmL.
– snowfall and rainfall: ORCHIDEE, VIC.
Outflows.
– sublimation (Esn ): CLM4.5, CLM5.0, CWatM, DBH, H08, JULES-W1, LPJmL, MATSIRO, ORCHIDEE,
WaterGAP2.
– snowmelt (M): CLM4.5, CLM5.0, CWatM, H08, JULES-W1, LPJmL, Mac-PDM.20, mHM, MATSIRO, MPI-HM,
ORCHIDEE, PCR-GLOBWB, WaterGAP2, WAYS.
Soil storage (Sso ) (Table S14): CLM4.5, CLM5.0, CWatM, DBH, H08, JULES-W1, LPJmL, Mac-PDM.20, mHM,
MATSIRO, MPI-HM, ORCHIDEE, PCR-GLOBWB, VIC, WaterGAP2, WAYS.
Inflows.
– total precipitation (Ptot ): Mac-PDM.20
– infiltration (Rin ): CWatM, DBH, H08, LPJmL, mHM, MPI-HM, ORCHIDEE, PCR-GLOBWB, VIC, WaterGAP2.
– throughfall (Pth ): H08, JULES-W1, WAYS.
– snowmelt (M): H08, JULES-W1, Mac-PDM.20, WAYS.
– capillary rise (Rcr ): CWatM.
Outflows.
– transpiration (T ): CLM4.5, CLM5.0, CWatM, DBH, LPJmL, MPI-HM, PCR-GLOBWB, VIC.
– evaporation from soil (Eso ): CWatM, DBH, H08, JULES-W1, LPJmL, Mac-PDM.20, mHM, MPI-HM, ORCHIDEE,
PCR-GLOBWB, VIC, WaterGAP2, WAYS.
– surface runoff (Rsu ): LPJmL, JULES-W1, Mac-PDM.20, ORCHIDEE.
– total runoff (Rtot ): WaterGAP2, WAYS.
– interflow (Rif ): CWatM, JULES-W1, LPJmL, PCR-GLOBWB.
– percolation (Rpe ): MPI-HM.
– groundwater recharge (Rgwr ):CWatM, DBH, LPJmL, PCR-GLOBWB.
– groundwater runoff (Rgw ): VIC.
streamflow and outflow, and “A” for water abstractions. We letter of each word in the case of compounds words such as
used two letters for subscripts and superscripts, ideally, the groundwater (“gw”) or surface water (“sw”). We separated
first two letters of the word, for example, “ca” for canopy, subscripts and superscripts from one another using comma.
“sn” for snow, “so” for soil, and so on (see the list of sym- We did not write full words for subscripts and superscripts
bols and glossary in the Supplement), while we used the first because equations became too long and difficult to read and
https://doi.org/10.5194/gmd-14-3843-2021 Geosci. Model Dev., 14, 3843–3878, 20213850 C.-E. Telteu et al.: Understanding each other’s models
Table 3. Groundwater, lake, reservoir, and wetland compartments and their water flows included in ISIMIP2b global water models.
Groundwater storage (Sgw ) (Table S26): CLM4.5, CLM5.0, CWatM, H08, Mac-PDM.20, mHM, MATSIRO, MPI-HM,
PCR-GLOBWB, WaterGAP2, WAYS.
Inflows.
– groundwater recharge (Rgwr ): CLM4.5, CLM5.0, H08, Mac-PDM.20, mHM, MPI-HM, WaterGAP2, WAYS.
– percolation (Rpe ): CWatM, PCR-GLOBWB.
– preferential flow (Qpf ): CWatM.
Outflows.
– capillary rise (Rcr ): CWatM, PCR-GLOBWB.
– groundwater runoff (Rgw ): CLM4.5, CLM5.0, CWatM, H08, Mac-PDM.20, mHM, MPI-HM, PCR-GLOBWB,
WaterGAP2, WAYS.
– groundwater withdrawal for human water use (Agw ): CWatM, PCR-GLOBWB, WaterGAP2.
– total human water abstraction (Atot ): H08.
Lake (Sla ) (Table S29): CLM4.5, CLM5.0, CWatM, LPJmL, PCR-GLOBWB, WaterGAP2.
Inflows.
– precipitation (Ptot ): LPJmL, WaterGAP2
– inflow from upstream surface water bodies (Qiu ): LPJmL, WaterGAP2
– groundwater runoff (Rgw ): WaterGAP2
– return flow from human water use (Arf ): WaterGAP2
– water abstraction for human purposes (A): LPJmL
Outflows.
– evaporation from lake (Ela ): LPJmL, PCR-GLOBWB, WaterGAP2
– outflow from lake (Qla ): CWatM, LPJmL, PCR-GLOBWB, WaterGAP2
– groundwater recharge (Rgwr ): WaterGAP2
– water abstraction for human water use from lake (Ala ): WaterGAP2, LPJmL
Reservoir storage (Sre ) (Table S32): DBH, H08, LPJmL, MATSIRO, PCR-GLOBWB, WaterGAP2.
Inflows.
– precipitation (Ptot ): WaterGAP2, LPJmL
– inflow from upstream surface water bodies (Qiu ): CWatM, PCR-GLOBWB, WaterGAP2.
– total runoff (Rtot ): H08, MATSIRO
– groundwater recharge below surface water bodies (Rgwr swb ): WaterGAP2
– return flow from human water use (Arf ): LPJmL, MATSIRO, PCR-GLOBWB, WaterGAP2
Outflows.
– evaporation from reservoir (Ere ): WaterGAP2, CLM4.5, CLM5.0, LPJmL, VIC.
– outflow from reservoir (Qre ): DBH, H08, LPJmL, MATSIRO, PCR-GLOBWB, WaterGAP2.
– groundwater recharge (Rgwr ): WaterGAP2.
– water abstraction for human water use from reservoir (Are ): LPJmL, H08, MATSIRO, PCR-GLOBWB, WaterGAP2.
Wetland storage (Swe ) (Table S36): MPI-HM, WaterGAP2.
Inflows.
– precipitation (P ): MPI-HM, WaterGAP2
– inflow from upstream surface water bodies (Qiu ): MPI-HM, WaterGAP2
Outflows.
– groundwater recharge (Rgwr ): WaterGAP2
– evaporation from wetland (Ewe ): MPI-HM, WaterGAP2
– outflow from wetland (Qwe ): MPI-HM, WaterGAP2
understand. Some of these decisions correspond with some 4.5 Collection of the equations from the modelling
habits that exist in the hydrological community (e.g. gw and teams
sw), and we decided to keep them to make a comfortable and
easy workflow for modellers and readers.
In the next step, modelling teams created and provided the
model equations used to provide simulations for ISIMIP2b
according to the generated lists. Each modelling team in-
Geosci. Model Dev., 14, 3843–3878, 2021 https://doi.org/10.5194/gmd-14-3843-2021C.-E. Telteu et al.: Understanding each other’s models 3851
Table 4. River compartment and its water flows included in the ISIMIP2b global water models.
River storage (Sri ) (Table S40): CLM4.5, CLM5.0, CWatM, DBH, H08, LPJmL, mHM, MATSIRO, MPI-HM, OR-
CHIDEE, PCR-GLOBWB, WaterGAP2, WAYS.
Inflows.
– inflow from upstream surface water bodies (Qiu ): CLM4.5, CLM5.0, CWatM, H08, LPJmL, mHM, MATSIRO,
PCR-GLOBWB, WaterGAP2.
– total runoff (Rtot ): mHM
– surface runoff or overland flow or fast runoff (Rsu ): CLM4.5, CLM5.0, CWatM, ORCHIDEE, PCR-GLOBWB,
WaterGAP2.
– interflow (Rif ): CWatM, PCR-GLOBWB
– groundwater runoff (Rgw ): CLM4.5, CLM5.0, CWatM, H08, mHM, MATSIRO, MPI-HM, ORCHIDEE,
PCR-GLOBWB, WaterGAP2.
– return flow from human water use (Arf ): WaterGAP2.
– streamflow (Qri ): H08, MPI-HM
Outflows.
– streamflow or outflow or river discharge (Qri ): CLM4.5, CLM5.0, LPJmL, mHM, MPI-HM, WaterGAP2
– inflow upstream of a grid cell (Qiu ): H08
– mean total annual inflow in a lake (Qiu,la ): LPJmL
– outflow downstream of a grid cell (Qod ): CWatM, PCR-GLOBWB
– water abstraction for irrigation (Airr ): LPJmL,
– water abstraction for irrigation from surface water bodies (Airr swb ): CWatM, PCR-GLOBWB
– water abstraction for domestic sector from surface water bodies (Adom swb ): CWatM, PCR-GLOBWB
– water abstraction for livestock from surface water bodies (Aliv swb ): CWatM, PCR-GLOBWB
– water abstraction for manufacturing from surface water bodies (Aman swb ): CWatM, PCR-GLOBWB
– water abstraction for human water use from river (Ari ): WaterGAP2, H08, MATSIRO
– water abstraction for irrigation sector (Airr ): LPJmL
Table 5. Human water use sectors estimated by ISIMIP2b GWMs.
Human water use sectors (A) (Tables S40–S80):
Irrigation (Airr ): CLM4.5, CLM5.0, CWatM, H08, LPJmL, MATSIRO, MPI-HM, PCR-GLOBWB, WaterGAP2.
Domestic (Adom ): MATSIRO, PCR-GLOBWB, WaterGAP2, CWatM
Manufacturing (Aman ): MATSIRO, PCR-GLOBWB, WaterGAP2, CWatM
Electricity (Aele ): PCR-GLOBWB, WaterGAP2, CWatM
Livestock (Aliv ): CWatM, PCR-GLOBWB, WaterGAP2.
volved in this study internally checked and reviewed its correction of model equations many times, and saving a lot
model, based on the model code and peer-reviewed articles of time in all this process. Therefore, the Supplement pro-
mentioned in Table 11 or only on the peer-reviewed articles vides an overview of the 16 GWMs, analysed in this study,
on model description mentioned in Table 11. In some cases, and enables readers to understand similarities and differences
modelling teams provided the equations using our standard among these models and identify included water compart-
writing style and symbols presented in Sect. 4.4, while in ments and human water use sectors and their flows. Ulti-
other cases they used their specific writing style. Therefore, mately, the readers get an overview of hydrological knowl-
the modelling teams checked the model equations on their edge complexity behind these models (Tables S1–S97).
correctness.
4.7 Evaluation of collected information
4.6 Homogenization of the model equations
In the final step, we re-evaluated the collected and ho-
We homogenized all variables and standardized variables’ mogenized model equations for their consistency with the
units in Tables S1–S83. We used the Overleaf platform, an model code. We found similarities and differences among
online LaTeX editor, with its glossaries package, to homog- 16 GWMs analysed in this study. We analysed the model
enize all model equations of 16 GWMs, write some model equations to find the models that simulate the same wa-
equations, and rewrite other model equations using our sym- ter flow (e.g. evaporation), the same water storage com-
bols. This online LaTeX editor enabled online collaboration, partment (e.g. canopy storage), the same human water use
https://doi.org/10.5194/gmd-14-3843-2021 Geosci. Model Dev., 14, 3843–3878, 20213852 C.-E. Telteu et al.: Understanding each other’s models
Table 6. Key characteristics of the global water models.
Model Model Temporal Discretization type Calibration for ISIMIP2b / ability to calibrate for Human water use sectors
type resolution other studies / details
CLM4.5 LSM 6h grid, subgrid for vegetation, no / no, adjustment of some parameters according to sim Airr
surface runoff, and evapo- vegetation or soil properties / not available
transpiration
CLM5.0 LSM 6h grid, subgrid for vegetation, no / yes / calibration performed in a Bayesian frame- sim Airr
surface runoff, and evapo- work based on sequential Monte Carlo
transpiration
CWatM GHM 1d grid, subgrid for land cover, no / monthly or daily discharge / hydrological calibra- sim: Airr , Adom , Aind , Aliv
snow tion uses DEAP (Burek et al., 2020)
DBH LSM 1d grid no / no hydrological calibration, adjustment of some not included
parameters according to vegetation or soil properties /
most parameters derived from satellite data.
H08 GHM 1d grid no / can be calibrated but generally done at the regional sim Airr and Aocean , Adom ,
scale / the model can be applied at the global or regional Aind
scale
JULES-W1 LSM 1d grid biophysical processes are calibrated / no hydrological not included
calibration / ×
LPJmL DGVM 1d grid yield calibration to match FAO stats / no hydrological sim Airr , ISIMIP2b prescribed
calibration Adom and Aind
Mac-PDM.20 GHM 1d grid no / yes / calibration uses a 100 000 GLUE ensemble not included
with WATCH Forcing Data (Smith, 2016)
MATSIRO LSM 1h grid no / yes / adjustment of some parameters according to sim Airr , ISIMIP2b prescribed
vegetation or soil properties, no calibration capability in Adom and Aind
TRIP model for routing discharge.
mHM GHM 1d grid yes / yes / calibration is performed against observed not included
daily discharge GRDC stations, gridded fields of ter-
restrial water storage (TWS) and gridded ET (evapo-
transpiration) from FLUXNET with the ERA5 climate
forcing
MPI-HM GHM 1d grid, subgrid for surface no / × / × sim Airr
runoff and evapotranspira-
tion
ORCHIDEE LSM 30 min grid no / yes / adjustment of some parameters not included
PCR-GLOBWB GHM 1d grid, subgrid for vegetation, no / yes / adjustment of some parameters sim: Airr , Adom , Aind ,
land cover Aliv
VIC GHM 1d grid, subgrid for vegetation no calibration for ISIMIP2b not included
and elevation
WaterGAP2 GHM 1d grid, subgrid for snow yes / mean annual discharge / beta function, 1319 sim: Airr , Adom , Aman , Aelec ,
GRDC stations Aliv
WAYS GHM 1d grid yes / yes / calibrated against the ISLSCP, Initiative II not included
UNH or GRDC composite monthly runoff data (Fekete
et al., 2011) from 1986 to 1995 at a 0.5◦ resolution
×: no details; DEAP: Distributed Evolutionary Algorithms in Python; DGVM: dynamic global vegetation model; EB: energy balance; GHM: global hydrological model; GRDC: Global Runoff Data Centre; ISLSCP:
International Satellite Land Surface Climatology Project; LSM: land surface model; sim: simulated by the model; UNH: University of New Hampshire; Airr : water abstractions for irrigation; Adom : water abstractions for
domestic; Aman : water abstractions for manufacturing; Aele : water abstractions for cooling of thermal power plants; Aind : water abstractions for industry (sum of Aman and Aele ); Aliv : water abstractions for livestock;
TRIP: Total Runoff Integrating Pathways. Bold font indicates LSMs, italic font indicates GHMs, and underlined font indicates DGVMs.
sector (e.g. irrigation sector). For example, five models models by taking into account the precipitation intercepted
(CWatM, JULES-W1, MATSIRO, MPI-HM, and WAYS) use by canopy storage and liquid and solid throughfall, in ad-
the same equation to compute potential evapotranspiration in dition to canopy evaporation (Table S3). We also conclude
Table S2. A total of 10 models (CWatM, DBH, JULES-W1, that 12 models compute canopy evaporation (Tables S3, S7).
LPJmL, mHM, ORCHIDEE, PCR-GLOBWB, VIC, Water- Therefore, in the next section (Sect. 5), we present our results
GAP2, and WAYS) compute changes in canopy water stor- according to two main parts of the terrestrial water cycle:
age taking into account the same variables such as total pre- the hydrological part and water use part. The hydrological
cipitation, throughfall, and canopy evaporation. The other part includes the eight water storage compartments and their
three models (CLM4.5, CLM5.0, and MATSIRO) compute flows, while the water use part includes five human water use
changes in canopy water storage differently than the nine sectors and their flows.
Geosci. Model Dev., 14, 3843–3878, 2021 https://doi.org/10.5194/gmd-14-3843-2021C.-E. Telteu et al.: Understanding each other’s models 3853
5 Similarities and differences among 16 global water reaches the ground (throughfall), and precipitation that falls
models directly on the ground (Tables S4–S6). Therefore, these mod-
els distinguish between rainfall and snowfall. Further, they
Several studies highlighted the need to understand better also divide throughfall into liquid and solid phases.
modelling approaches, model structures, model equations, Two models compute an interception scheme based on a
and similarities and differences among models (Zhao et al., leaf and stem area index, while seven models use only a leaf
2017; Veldkamp et al., 2018; Schewe et al., 2019). There- area index (Tables 7 and 8). A total of 10 models compute
fore, in this section, we present some similarities and dif- this considering vegetation type (a plant functional type sys-
ferences among 16 GWMs in simulating the terrestrial wa- tem) (Tables 7 and 8). MPI-HM uses prescribed data taken
ter cycle. This information enables us to interpret the dif- from Land Surface Parameter dataset version 2 (Hagemann,
ferent model results found in some model comparison and 2002). PCR-GLOBWB uses the HYDE3.2 (Klein Gold-
ensemble studies (Zaherpour et al., 2018; Wartenburger et ewijk, 2017), MIRCA (Portmann et al., 2010), and Glob-
al., 2018; Scanlon et al., 2019), as well as those by Gud- Cover datasets (Bicheron et al., 2011). Generally, prescribed
mundsson et al. (2021), Reinecke et al. (2021), and Pokhrel vegetation ignores the decisive interaction between vege-
et al. (2021). This information also strengthens our under- tation and runoff and interactions between the atmosphere
standing of how these models work. Briefly, the 16 analysed and Earth’s surface (Gerten et al., 2004; McPherson, 2007;
GWMs include similar hydrological processes in their struc- Nicholson, 2000). In the ISIMIP2b, the word “prescribed”
ture, but they have different model structures. has two meanings: (i) data which are simulated by other
models and provided by the ISIMIP2b framework as input
5.1 Similarities and differences in simulating eight (for example, https://www.isimip.org/gettingstarted/details/
water storage compartments 38/, last access: 8 June 2021) and (ii) data obtained from
satellite observations, other datasets, or maps. Prescribed
5.1.1 Canopy water storage data highlight some limitations of the models or underline
the lack of some processes that were intentionally or uninten-
The changes in canopy water storage depend on how much tionally removed from the model structure, according to the
water evaporates (canopy evaporation) and how much water purpose of the model development or other priorities such as
is intercepted by canopy. Three models do not compute po- time.
tential evapotranspiration (Tables S2, 7, and 8). Seven mod- Throughfall is estimated by 13 models (Table S5) de-
els apply the Penman–Monteith method to compute poten- pending on (1) total precipitation and relative canopy wa-
tial evapotranspiration (PET). PCR-GLOBWB applies the ter content (JULES-W1); (2) difference between total pre-
Hamon method to simulate PET, while mHM applies the cipitation and canopy storage deficit (mHM, WaterGAP2,
Hargreaves–Samani method. ORCHIDEE applies a simpli- WAYS); (3) ratio between rainfall or snowfall and total pre-
fied Penman–Monteith equation (Monteith, 1965) with a cor- cipitation (CLM4.5, CLM5.0, MATSIRO); (4) total precip-
rection term developed by Chris Milly (1992). WaterGAP2 itation and minimum value of potential evapotranspiration
and LPJmL apply the Priestley–Taylor equation, while H08 (PET) or canopy storage (LPJmL); (5) canopy water content
and MATSIRO apply the Bulk method. (PCR-GLOBWB); (6) a function of LAI then weighted by
A total of 13 models include canopy water storage in their the canopy fraction in the grid cell (DBH and ORCHIDEE);
structure, while 3 other models do not include it (H08, Mac- (7) canopy water content and grid cell average precipita-
PDM.20, and MPI-HM: Table S3, Fig. 1). A total of 10 mod- tion (VIC); and (8) total precipitation, canopy water content,
els compute canopy water storage by subtracting the through- and canopy evaporation (CWatM). Three models (H08, Mac-
fall amount and canopy evaporation from the total precipita- PDM.20, MPI-HM) do not estimate throughfall.
tion. The other 3 models (CLM4.5, CLM5.0, and MATSIRO) Four models (CLM4.5, CLM5.0, LPJmL, and OR-
compute change in canopy water storage by subtracting the CHIDEE; Tables 7 and 8) account for the CO2 fertiliza-
liquid or solid throughfall and canopy evaporation from the tion effect, in the LAI estimation, by using a photosynthesis
precipitation intercepted by the canopy storage. MATSIRO is scheme (active vegetation, mentioned in Sect. 4.3), and they
the only model that has two canopy water compartments: one have the ability to simulate the CO2 effect on plant func-
for rainfall interception and one for snowfall interception. It tioning. Sitch et al. (2008) found that simulations on CO2
also computes in detail how much water is intercepted by fertilization effect depend on the number of plant functional
canopies in stormy areas with high wind speeds and in calm types (PFTs) prescribed or defined in the model and on the
areas with low wind speeds. In these areas, precipitation de- processes used to estimate plants’ ability to adapt, acclimate,
pends mainly on leaf area index (LAI) and water deficit in and grow in new environmental conditions.
the canopy storage.
Three land surface models (CLM4.5, CLM5.0, and MAT-
SIRO) divide total precipitation into precipitation intercepted
by canopy, precipitation that penetrates the canopy and then
https://doi.org/10.5194/gmd-14-3843-2021 Geosci. Model Dev., 14, 3843–3878, 2021C.-E. Telteu et al.: Understanding each other’s models
https://doi.org/10.5194/gmd-14-3843-2021
Table 7. Representation of the water storage compartments and water flows included in the global water models (part i).
Model Interception Vegetation scheme (Potential) Number of Soil scheme TSD Snow scheme Snowacc
scheme partition / evapotranspiration soil layers soil layer depth (SLD) [m] snow accumulation and
photosynthesis scheme scheme [m] snowmelt
CLM4.5 f (LAI, SAI) tile approach with 24 PFTs Monin–Obukhov simi- 15 depth at layer interface: 0.0175, 0.0451, 42.1 physically based / 5 layers
(including 10 crop types) / ×; larity theory computes 0.0906, 0.1655, 0.2891, 0.4929, 0.8289, mechanistic snow
CO2 only AET 1.3828, 2.2961, 3.8019, 6.2845, module
10.3775, 17.1259, 28.2520, 42.1032.
CLM5.0 f (LAI, SAI) naturally vegetated surfaces are Monin–Obukhov simi- 25, depth at layer interface: 0.020; 0.060; 49.6 physically based snow maximum
comprised of up to 14 possible larity theory computes f (depth to 0.120; 0.200; 0.320; 0.480; 0.680; module 12 layers,
plant functional types (PFTs) / only AET bedrock) 0.920; 1.200; 1.520; 1.880; 2.280; depends on
dynamic global vegetation 2.720; 3.260; 3.900; 4.640; 5.480; snow depth
model (DGVM); CO2 6.420; 7.460; 8.600; 10.990; 15.666;
23.301; 34.441; 49.556.
CWatM f (veg) subgrid Penman–Monteith 3 0.05, 0.05–0.3, 0.3–1.7 2.0 Degree-day method 7 layers
depends on HWSD data
DBH f (LAI) prescribed, 10 vegetation types Energy balance model 3 from 1.5 to 3.5 m; 3.5 Energy balance 1 layer
(PFTs) with fixed vegetation with Monin–Obukhov top layer = 0.020 m; method
characteristics / × similarity theory root layer = 1.0 to 1.5 m.
computes only AET
H08 × tile approach / × Bulk, Bulk transfer co- 1 / RCZ 1 1 Energy balance 1
efficient set to 0.003 method
JULES-W1 f (LAI) 5 static vegetation types (PFTs) Penman–Monteith 4 0.10; 0.25; 0.65; 2.00 3.0 Energy balance zero-layer
with fixed plant characteristic / method scheme
×
LPJmL f (LAI) 9 PFTs f (L, W, S) / DVPNV; Priestley–Taylor modi- 5+1 0.20; 0.30; 0.50; 1; 1 m. 13 Degree-day method 1 layer
Geosci. Model Dev., 14, 3843–3878, 2021
CO2 fied for transpiration 1 thermally active soil of 10 m with precipitation
factor
Mac-PDM.20 f (veg) prescribed, 16 PFTs with fixed Penman–Monteith 1 none none Degree-day method 1 layer
vegetation characteristics / ×
MATSIRO f (LAI) 11 static vegetation types with Monin–Obukhov simi- 13 0.05; 0.2; 0.75; 1; 1; 1; 1; 1; 1; 1; 1; 1; 100 Energy balance 3 layers
fixed characteristics (PFTs) / × larity theory to compute 90 m. method
only actual evapotran-
spiration
AET: actual evapotranspiration; CO2 : CO2 fertilization effect; DGVM: dynamic global vegetation model; DVPNV: dynamic vegetation composition on potential natural vegetation areas; f (LAI): function of leaf area index; f (LAI, SAI): function of leaf area index
(LAI) and stem area index (SAI); f (veg): function of vegetation type; HWSD: Harmonized World Soil Database (FAO/IIASA/ISRIC/ISSCAS/JRC (2012): Harmonized World Soil Database (version 1.2), FAO, Rome, Italy and IIASA, Laxenburg, Austria, available at:
http://www.fao.org/soils-portal/soil-survey/soil-maps-and-databases/harmonized-world-soil-database-v12/en/, last access: 10 June 2021); L: light; PFTs: plant functional types; RCZ: runoff properties varies with climate zones; SLD: soil layers depth from top to
bottom; TSD: total soil layer depth; Snowacc : snow accumulation; S : space; W : water; ×: not included in the model. Bold font indicates LSMs, italic font indicates GHMs, and underlined font indicates DGVMs.
3854You can also read