WORLD WATER QUALITY ASSESSMENT - First Global Display of a Water Quality Baseline - Communities of ...
←
→
Page content transcription
If your browser does not render page correctly, please read the page content below
WORLD WATER QUALITY
          ASSESSMENT
First Global Display of a Water Quality Baseline
Contributors
Résumé
Ilona Bärlund6, Martina Flörke13, Nynke Hofstra20

Chapter 1
Ilona Bärlund6, Dietrich Borchardt6, Christian Schmidt6, Hartwig Kremer16

Chapter 2
Ting Tang8, Seifeddine Jomaa6, Claudia Faerber7, Karin Schenk3, Nynke Hofstra20, Martina Flörke13,
Maryna Strokal20, Michelle van Vliet19, Joel Podgorski14,18

Chapter 3.1
Joost van den Roovaart2, Lex Bouwman19,9,10, Arthur Beusen19,9, Jos van Gils2, Tineke Troost2, Daniel
Odermatt14, Stefan Simis12, Kerstin Stelzer1, Nynke Hofstra20, Annette Janssen20, Maryna Strokal20,
Ting Tang8, Michelle van Vliet19, Bruna Grizetti4

Chapter 3.2
Nynke Hofstra20, Mirjam Bak20, Gertjan Geerling2, Andrew Gemmell16,15, Alessio Ippolito5, Issoufou
Ouedraogo17, Joel Podgorski14,18, Eirini Politi1, Jaime Rivera13, Philipp Saile7, Christian Schmidt6, Stefan
Simis12, Kerstin Stelzer1, Maryna Strokal20, Michelle van Vliet19, Mengru Wang20, Jikke van Wijnen11

Chapter 3.3
Martina Flörke13, Jaime Rivera13, Arthur Beusen19,9, Lex Bouwman19,9,10, Hans H. Dürr13, Thomas
Heege3, Joel Podgorski14,18, Karin Schenk3, Maryna Strokal20, Ting Tang8, Michelle van Vliet19

Chapter 4
Andrew Gemmell16,15, Kornelius Riemann16,15, Rowena Hay15

Chapter 5
Christian Schmidt6, Nynke Hofstra20, Joost van den Roovaart2

Chapter 6
Ilona Bärlund6, Martina Flörke13, Nynke Hofstra20, Ting Tang8

1 Brockmann Consult, Germany
2 Deltares, The Netherlands
3 EOMAP GmbH & Co.KG, Germany
4 European Commission, DG Joint Research Centre, Italy
5 European Food Safety Authority (EFSA), Italy (A. Ippolito is employed by the European Food Safety Authority. The positions and opinions presented
in this document are those of the authors alone and do not necessarily represent the views or scientific works of the European Food Safety Authority)
6 Helmholtz Centre for Environmental Research (UFZ), Germany
7 International Centre for Water Resources and Global Change (ICWRGC), Germany
8 International Institute for Applied Systems Analysis (IIASA), Austria
9 Netherlands Environmental Assessment Agency (PBL), The Netherlands
10 Ocean University of China, PR China
11 Open University, The Netherlands
12 Plymouth Marine Laboratory, United Kingdom
13 Ruhr-University Bochum, Germany
14 Swiss Federal Institute of Aquatic Science and Technology (EAWAG), Switzerland
15 Umvoto Africa (Pty) Ltd, South Africa
16 United Nations Environment Programme (UNEP), Kenya
17 University of Fada N’Gourma, Burkina Faso
18 University of Manchester, United Kingdom
19 Utrecht University, The Netherlands
20 Wageningen University, the Netherlands

                                                                                                                                                        1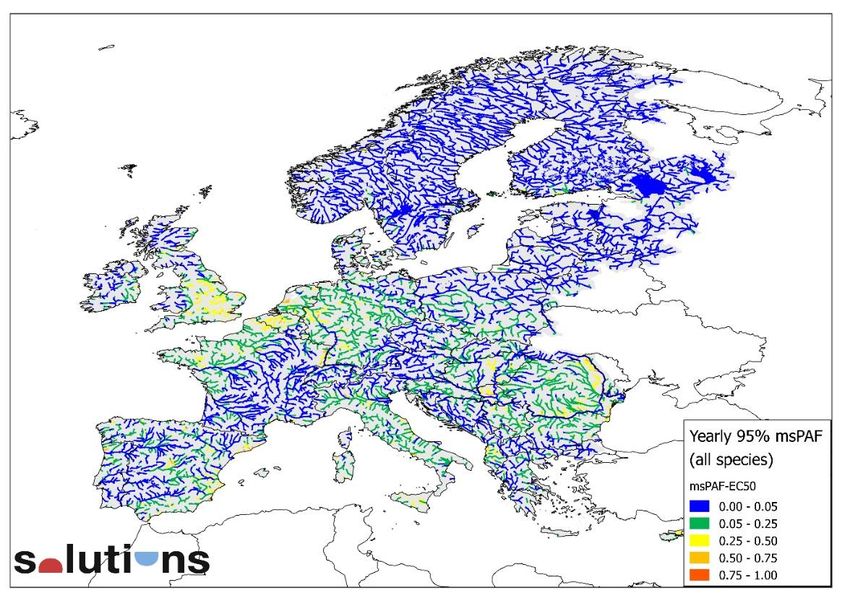
Suggested citation:

World Water Quality Alliance (2021). World Water Quality Assessment: First Global Display of a Water
Quality Baseline. A consortium effort by the World Water Quality Alliance - towards a full global
assessment. Information Document Annex for display at the 5th Session of the United Nations
Environment Assembly, Nairobi 2021.

The designations employed and the presentation of material on the maps do not imply the expression
of any opinion whatsoever on the part of the Secretariat of the United Nations concerning the legal
status of any country, territory, city or area or of its authorities, or concerning the delimitation of its
frontiers or boundaries.

                                                                                                         2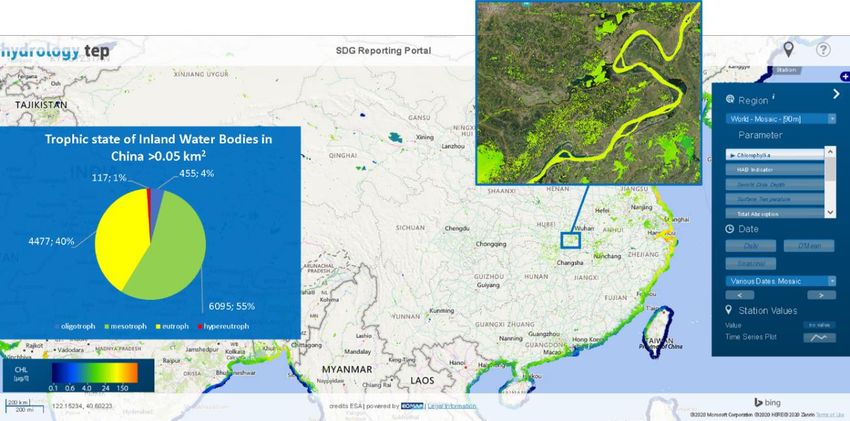
Résumé
Rationale
Increasing pollution of freshwater as a result of rapid economic growth and urbanization in developing
countries, and sustained, chronic pollution including long-term legacies in developed countries poses
a growing risk to public health, food security, biodiversity and other ecosystem services. The goal of
the World Water Quality Assessment is to review the state of freshwater quality and its potential
impacts on ecosystems health, human health and food security, in conjunction with pressures and key
drivers to overcome the global water crisis in a targeted way.

The UN Environment Assembly Resolution from 2017, UNEP/EA.3/RES.10, ‘Addressing water pollution
to protect and restore water-related ecosystems’ called for an assessment of global water quality. This
current document provides a first global display of a water quality baseline as the pilot draft
Assessment report to be delivered for UNEA-5 (2021/2022). It results from a networking activity
mirroring the competences, interests and resources of the contributors, and does not claim
completeness. This Assessment of global water quality will be continued to address the current
challenges in terms of gaps in data and to arrive at a comprehensive baseline that can be updated in a
more continuous way. It will further require more time to thoroughly address methodological issues
facing a global water quality assessment. The innovative pathway chosen builds on experiences made
in the Snapshot report (UNEP 2016) and the resulting Analytical Brief (UN-Water 2016) setting out key
requirements towards a global assessment. The working groups involved and principal investigators
representing several World Water Quality Alliance (WWQA) working groups will continue to achieve
best possible alignment of available in-situ, modelling and remote sensing data date to provide a best
possible global baseline and scenarios in early 2023 for presentation to UNEA 6 and to feed into the
comprehensive mid-term review of the International Decade for Action on Water for Sustainable
Development 2018-2028.

Key findings
This first global display of water quality gives a versatile picture of the baseline state of global water
quality and its impacts on ecosystems health, human health and food security. The results can be used
to identify water quality hotspots and help to identify some of the key drivers. The outcome of the
Assessment already at this initial demonstration state can provide context in support of the evaluation
of reaching the Sustainable Development Goal SDG 6 target 6.3 by focusing on the specific indicator
on ambient water quality 6.3.2 and its interlinkages with other targets and goals.

The key findings from the analysis presented include:
Chapter 2 ‘Methods’
-   The Assessment core of innovation, the triangulation approach, aiming to combine in-situ,
    modelling and remote sensing data can help to overcome the implicit limitations of each data
    source alone. So far, however, the implementation has been successful on case-by-case only;
-   The DPSIR (Drivers-Pressures-States-Impacts-Responses) causal chain conceptual framework
    connecting the drivers to pressures and responses opens new horizons of data collection from
    the three data sources, namely, in-situ monitoring, remote sensing and modelling.
Chapter 3.1 ‘Water quality impacts on ecosystem health’
-   In 2020, anthropogenic nutrient sources contribute more than 70% to river nutrient loading;
-   Most of the increase of river nutrient loading has been in Asia;
-   Harmful algae blooms are now spreading in many river basins;
-   Curbing global nutrient cycles requires paradigm shifts in food and waste systems;

                                                                                                        3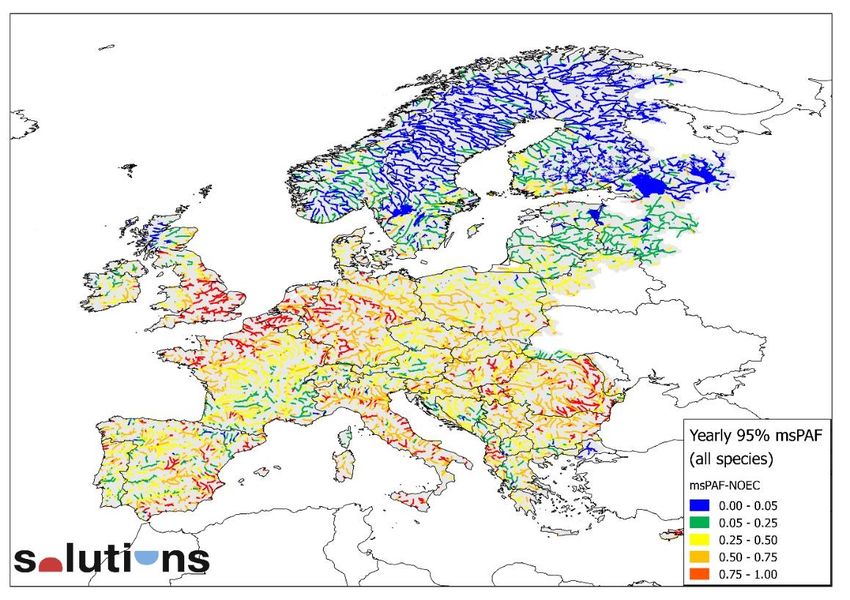
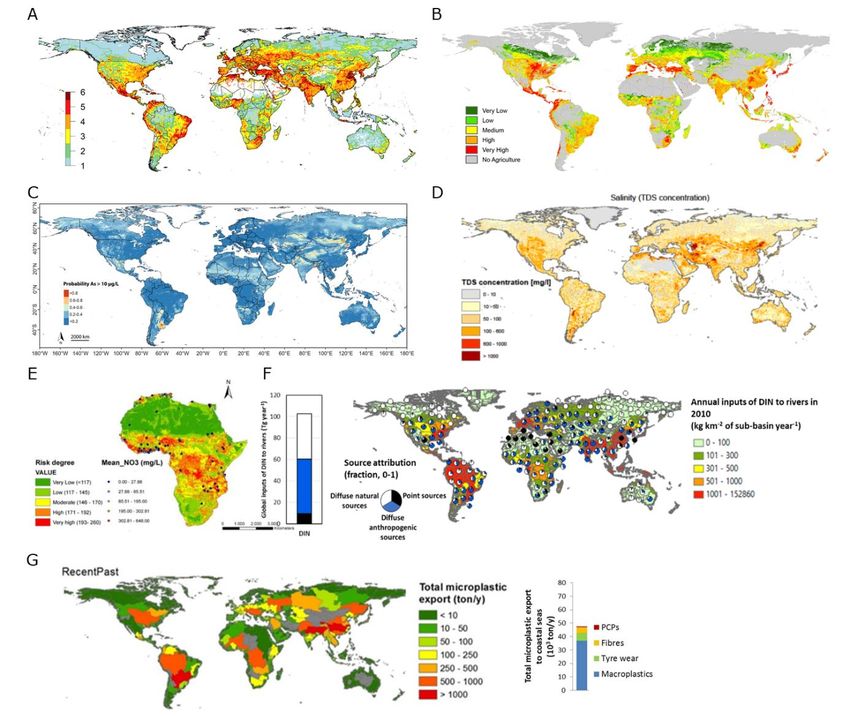
-   Two large scale European assessments on ca. 2,000 chemicals report chronic effects of (a mixture
    of) chemicals on aquatic species to be expected at 42%-85% of the studied sites, while 14%-43%
    of the sites are likely to experience some degree of species loss;
-   Assessments as for Europe cannot be made on a global scale. Neither the measured data nor the
    information to generate predicted concentrations are available yet;
-   The Human Impact and Water Availability Indicator (HIWAI) can be used to extrapolate results
    obtained for Europe. This proxy was found to correlate well with the expected loss of aquatic
    species in European surface waters.
Chapter 3.2 ‘Water quality impacts on human health’
-   Modelling has been a prominent approach to derive estimates on human health impacts from
    contaminated water, the water quality state and the contamination sources;
-   First estimates of human health impacts originating from the pathogen Cryptosporidium (single
    cell parasite) shows hotspots in areas where surface water is still regularly used for drinking
    directly and for arsenic hotspots are located in Asia. For most other contaminants to-date still no
    impact studies are available at the large scale;
-   Concentration hotspots are, for most contaminants, densely populated areas, in particular where
    wastewater treatment is limited. For groundwater arsenic and surface water salinity
    concentrations, hotspot areas include India, China and Mongolia.
Chapter 3.3 ‘Water quality impacts on food security’
-   First estimates of water quality impacts on food security show hotspots in north-eastern China,
    India, the Middle East, parts of South America, Africa, Mexico, United States and the
    Mediterranean;
-   Estimates of water quality impacts on food security reveal that over 200,000 km² of agricultural
    land in South Asia may be irrigated with saline water exceeding the FAO guideline of 450 mg/l
    and over 154,000 km² show a high probability of groundwater having arsenic concentrations that
    exceed the WHO guideline value of 10 µg/l, respectively;
-   Aquaculture and mariculture production are important to produce high-quality protein, but both
    can be at risk because of water pollution such as increased nutrient concentrations;
-   Wastewater reuse in irrigation is an option to overcome water shortages and to close the
    nutrient cycle, however, the food may become contaminated by pathogens (and faecal coliform
    bacteria), Antimicrobial Resistant (AMR) microorganisms and chemicals in wastewater that has
    not been sufficiently treated.
Chapter 4 ‘World Water Quality Alliance - Africa Use Cases’ (case studies contributing to the
Assessment and stakeholder engagement)
-   Cape Town’s groundwater is vulnerable to water quality impacts from urban development in an
    area with various land-use activities, posing a risk to the planned potable water supply; hence
    aquifer protection zones were co-designed;
-   Implications of water quality and its disturbance at Lake Victoria provide data to the Assessment
    and led to co-design of information products for the water food nexus with local fisheries
    stakeholders including a coastal eutrophication assessment, water temperature and stratification
    dynamics, and sediment chemistry;
-   Water quality related information product options for the Volta basin are initially being explored
    with local partners including tools to determine the percentage of population vulnerable to poor
    water quality, and a remote sensing-based groundwater quality assessment.

                                                                                                      4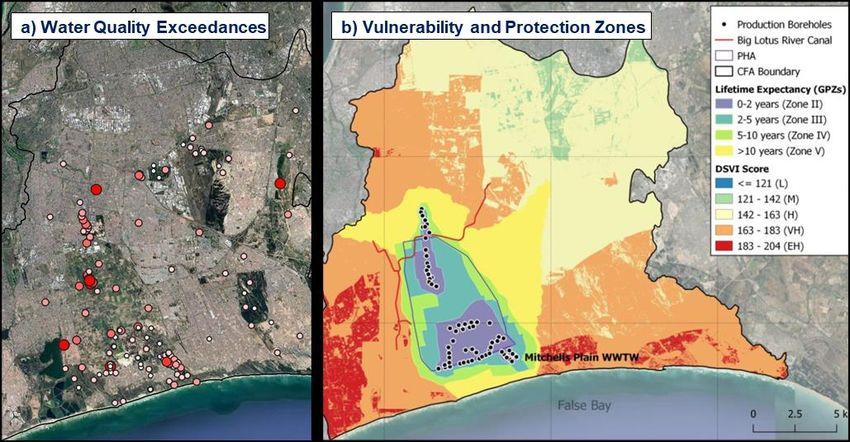
Chapter 5 ‘Digital water quality platforms’
-   A gap exists between the general availability of data, their level of coherent aggregation and
    synthesis which is required to provide useful information for different policy or management
    purposes. Appropriately designed platforms can help to overcome this gap;
-   The key to engage platform users is their involvement already early on in the development
    phases of the platform in a co-design process;
-   Multiple water quality platforms co-exist and target various water quality issues such as arsenic
    in groundwater or pathogens in African rivers. They should ideally reinforce each other by
    providing standardized data products to enable cross-platform sharing.

Water quality hotspots frequently overlap for many of the pollutants under consideration (namely,
when natural sources of contamination are far less important than anthropogenic pollution) and
located in densely populated areas. For a fully comprehensive global view, however, this Assessment
is still in a preliminary stage, facing considerable lack of input data, on state and on impacts for all
relevant water types, especially on contaminants/pollutants. Also for many contaminants relevant for
human health, estimates of their current state are still unavailable at the large scale. Response options
most often focus on reduction of sources. But, their impact has not yet been widely assessed. Also,
data that quantitatively link water quality impacts to food security is often lacking at the large spatial
scale, leaving efforts towards quantification of impacts at this large dimension difficult.

It is also evident that the emphasis of this Assessment, that is to encompass large- to global-scale water
quality studies, still is on surface waters and data retrieved from modelling. The prospects of the
Assessment triangulation approach, speaking to the joint use of data from in-situ monitoring, remote
sensing and modelling have been shown exemplarily in Chapter 3 for each of the water quality impact
themes. While this is opening promising perspectives to address data scarcity there are still technical,
practical and conceptual challenges to be addressed concerning for example inconsistencies in spatial
and temporal delineation and variables covered by each method.

Major Challenges
To assess water quality in the environment globally data is required with scientifically rigorous
coverage across time and space and reflecting a meaningful share of all waterbodies under
consideration. As in the past in this requirement still reside the most significant challenges the
Assessment aims to address over time.

Major data and knowledge gaps identified to-date include:
-   still an urgent need for regularly monitored up-to-date and readily available data to do a
    thorough evaluation;
-   the further development of methods for integrating different data sources (including in-situ
    monitoring, water quality models and remote sensing) for a comprehensive water quality
    evaluation is required;
-   knowledge gaps on the importance of the environmental fate and transport pathways and which
    need to be closed, also to test model assumptions on these;
-   that reporting should encompass the state, impacts (also indirect impacts), main sources and
    response options for all contaminants causing environmental and health risks;
-   that the assessment of water quality impacts in quantitative terms remains difficult as in-situ
    data and modelling data are lacking (for example to capture the impacts of harmful algal blooms,
    HABs and hypoxia on fisheries, aquaculture and mariculture as well as pathogen contamination
    impacts on leafy crops and food safety or on diarrhoeal diseases);
-   a continued and urgent requirement for innovative regulatory solutions, which include
    awareness raising among policy makers and all societal actors worldwide;
                                                                                                    5
-   an intrinsic need for better translation of response options to various target audiences by means
    of strong institutional collaboration across key water quality nexus dimensions and including the
    integration across water and health/food/ecosystem disciplines to implement effective
    measures.

In the next Assessment phase, the baseline water quality state and impact will be further elaborated.
What especially requires improving is better integration of all sources of information: in-situ data,
models and remote sensing, across the DPSIR framework. For this, the Assessment team needs
strengthening in particular concerning competences in the fields of in-situ monitoring and remote
sensing but also regarding the water bodies less visible in this report, i.e. groundwater and estuaries.
Concerning modelling, the versatile contribution so far lacks especially large-scale results for many
pollutants but also the basis required for scenario runs needs attention, as modelling is the only means
to perform scenario studies.

Selected case studies will be carried on to develop in-country partnerships and collaboration,
especially with water resource decision-makers in order to continue the co-design of water quality
products and services using the World Water Quality Assessment triangulation approach needed e.g.
to address mitigation options. Here attention will be paid to groups at risk like women because of their
frequent usage of water from rivers and lakes for cleaning clothes and collecting water for cooking and
drinking in the household, and children because of their play activities in local surface waters and also
because they often have the task of collecting water for the household.

The triangulation approach will trigger new thinking in the scientific community and provide eventually
new results to be included in the Assessment. To provide resilient and future-proof response options
to decision-makers, the basis must be established for conducting scenario analysis of future
development pathways of water quality in the freshwater system in response to future climate change,
socio-economic development and response options. For complex new products beyond a pure
community effort, such as a comprehensive scenario assessment across all modelling teams, different
linked impacts models, or multi-pollutant approaches, additional resources would be required.

                                                                                                       6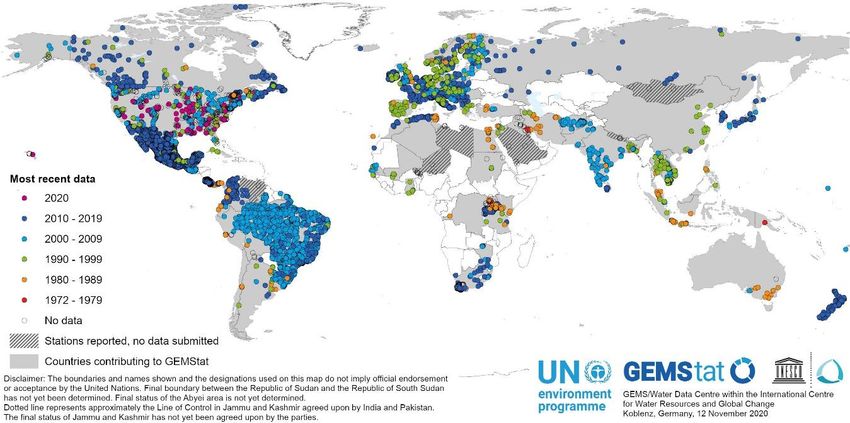
Table of contents
Contributors ............................................................................................................................................ 1
Résumé .................................................................................................................................................... 3
    Rationale ............................................................................................................................................ 3
    Key findings ........................................................................................................................................ 3
    Major Challenges................................................................................................................................ 5
1         Introduction .................................................................................................................................. 9
    1.1       Background .............................................................................................................................. 9
    1.2       Objectives and approach of the World Water Quality Assessment ........................................ 9
    1.3       This document ....................................................................................................................... 10
2         Methods ...................................................................................................................................... 11
    2.1 Approach .................................................................................................................................... 11
          2.1.1 The DPSIR framework ........................................................................................................ 11
          2.1.2 The triangulation approach................................................................................................ 12
    2.2 Tools ........................................................................................................................................... 13
          2.2.1 In-situ data ......................................................................................................................... 13
          2.2.2 Remote sensing products ................................................................................................... 14
          2.2.3 Water quality modelling..................................................................................................... 15
3         Water quality impacts on ecosystem health, human health and food security ......................... 18
    3.1       Ecosystem health ................................................................................................................... 18
          3.1.1         Introduction ................................................................................................................. 18
          3.1.2         Nutrient pollution ........................................................................................................ 19
          3.1.3         Toxic stress................................................................................................................... 25
          3.1.4         Data and knowledge gaps............................................................................................ 29
    3.2       Human health ........................................................................................................................ 31
          3.2.1         Introduction ................................................................................................................. 31
          3.2.2         Results.......................................................................................................................... 33
          3.2.3         Data and knowledge gaps............................................................................................ 40
    3.3       Food security .......................................................................................................................... 41
          3.3.1         Introduction ................................................................................................................. 41
          3.3.2         Salinity pollution .......................................................................................................... 42
          3.3.3         Arsenic pollution .......................................................................................................... 45
          3.3.4         Nutrient pollution ........................................................................................................ 47
          3.3.5         Food safety .................................................................................................................. 50
          3.3.6         Response options......................................................................................................... 51
          3.3.7         Missing data / more research required ....................................................................... 51
4     World Water Quality Alliance Africa Use Cases – Stakeholder engagement and product/service
co-design ............................................................................................................................................... 53
    4.1       Introduction ........................................................................................................................... 53
    4.2       Cape Town Groundwater ....................................................................................................... 54
                                                                                                                                                           7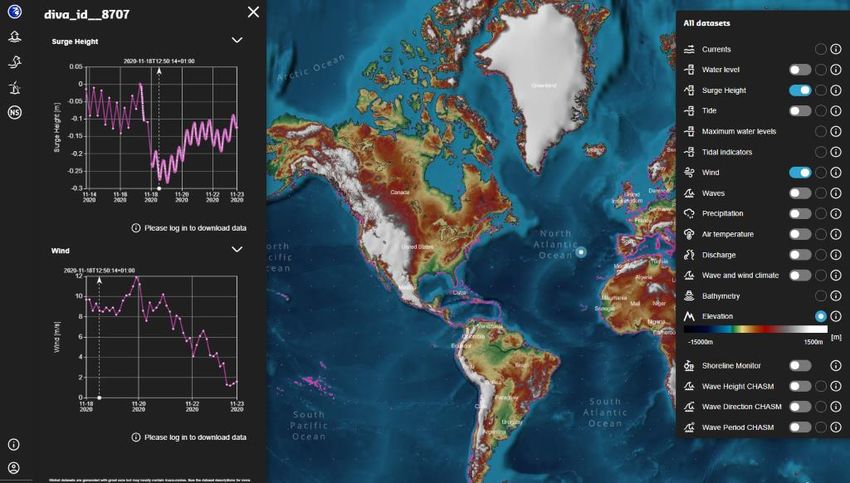
4.3       Lake Victoria Basin ................................................................................................................. 55
    4.4       Volta Basin ............................................................................................................................. 57
    4.5       Way forward .......................................................................................................................... 58
5         Digital water quality platforms ................................................................................................... 60
    5.1       What are digital, geospatial platforms?................................................................................. 60
    5.2       What are they good for? ........................................................................................................ 60
    5.3       Co-design is the key ............................................................................................................... 61
    5.4       Platforms supporting the World Water Quality Assessment ................................................ 61
          5.4.1         GlobeWQ ..................................................................................................................... 61
          5.4.2         Project and platform: Water Pathogen Knowledge to Practice (Water-K2P) ............. 62
          5.4.3         The Groundwater Assessment Platform (GAP) ........................................................... 63
          5.4.4         BlueEarth Data ............................................................................................................. 63
          5.4.5         SDG6 world water quality portal ................................................................................. 64
          5.4.6         World Environment Situation Room (WESR) ............................................................... 64
6         Summary and outlook ................................................................................................................. 66
References ............................................................................................................................................. 68

                                                                                                                                                         8
1 Introduction
1.1 Background
Increasing pollution of freshwater as a result of rapid economic growth and urbanization in developing
countries, and sustained, chronic pollution including long-term legacies in developed countries poses
a growing risk to public health, food security, biodiversity and other ecosystem services.
A prerequisite for the implementation of measures to improve water quality – e.g. to monitor progress
reaching the Sustainable Development Goal 6 target 6.3. on water quality and wastewater – is the
availability of information on the current state of water quality as well as the key drivers of water
quality changes. A preliminary Snapshot of the World’s Water Quality: Towards a Global Assessment
(UNEP 2016) revealed the lack of in-situ monitoring data which refer to measurements taken on the
ground in the water directly particularly in developing countries, rendering the sole reliance on
measured data impossible, both on continental and global and frequently also on national scales. The
challenge to generate this information and transform it to actionable knowledge not only consists of a
pure lack of data but also of making data accessible and providing them in a format that creates usable
and understandable information for the various actors involved.

1.2 Objectives and approach of the World Water Quality Assessment
The goal of the global Assessment is to review the state of freshwater quality and its potential impacts
on ecosystem health, human health and food security, in conjunction with its pressures and key drivers
to overcome the global water crisis in a targeted way. Embedded in the World Water Quality Alliance,
WWQA, a global community of practice comprising UN and external members world-wide and
representing a wealth of expertise in the field of water quality, the Assessment also aims at raising
awareness of the importance of water quality degradation for sustainable development and enabling
countries to better assess the state of the water resources and aquatic environment as a prerequisite
to effectively protect, maintain or restore water quality at sustainable levels. The Assessment is a key
element in UNEP’s long-term objective to foster a rolling global water quality appraisal including
Services and Innovation concepts and to be supported by an advanced global environment monitoring
system for freshwater (Figure 1.1).

Figure 1.1 A global water quality appraisal, services and innovation concept matching demand and supply of information
towards reaching good environmental quality and achieving SDG 6 and its interlinked goals at large.

                                                                                                                         9
The major components of the Assessment as identified in the Analytical Brief Towards a Worldwide
Assessment of Freshwater Quality (UN-Water 2016) are: 1) Baseline Assessment of global water
quality in surface and groundwater bodies, 2) Scenario Analysis of future pathways of water quality in
the freshwater system and its compartments, and 3) Mitigation Options, reflecting information on
pathways towards effectively protecting or restoring water quality at different scales.
Due to the inherent limitation of in-situ monitoring data which have been generated by direct
measurements at source (see Chapter 2.1.2), it is not possible to undertake a comprehensive
assessment of the state of global freshwater quality and related impacts from such sampling data
alone. Therefore, the central methodological challenge in the World Water Quality Assessment is to
innovatively consolidate the information basis by synthesizing data from in-situ monitoring, water
quality modelling and remote sensing-based Earth Observation (the so-called triangulation approach,
Figure 2.1B). Resulting data products and derived assessment information will provide consistent
images of the current state of freshwater quality (baseline) and illustrate causal chains from drivers to
impacts and response options using the DPSIR framework.
The ambition of the Assessment is to work at different scales: 1) the global scale to provide a consistent
context on the state of water quality regarding key pollutants and to identify the impaired water bodies
posing risks to human health, food security and ecosystem health; 2) the water body to river basin
scale with the engagement of stakeholders where possible in respective case studies to synthesize
information collectively and to achieve their management needs relevant in their respective water
system context including the implementation of the 2030 Agenda for Sustainable Development at
relevant scales (the concept of a localized 2030 Agenda).
As said above, embedding is provided by the World Water Quality Alliance, WWQA – currently
comprising more than 50 organizations globally – which represents a voluntary and flexible global UN
and external expert, practitioner and policy network, advocating the central role of freshwater quality
in achieving prosperity and sustainability. It brings together diverse disciplines and actors (including
science, private sector and civil society) and forms the expert community of practice behind the author
team of this document. As a product of this networking activity the present document mirrors the
competences and interests of the participants and does not claim completeness.
1.3 This document
The mandate is reflected in Resolution UNEP/EA.3/RES.10, adopted by the United Nations
Environment Assembly 3rd session end of 2017 on ‘Addressing water pollution to protect and restore
water-related ecosystems’, which called for an assessment of global water quality and draw on and
establish the necessary partnerships. This document is a first step towards the full World Water Quality
Assessment requested. It demonstrates the achievable interim results to-date in acknowledging the
complexity of meeting data scarcity and methodological challenges in combining data from various
sources in a scientifically rigorous reliable and reproducible way. It provides already today a first global
display of a water quality baseline as the pilot draft Assessment report to be delivered for UNEA-5
(2021/2022).
The core of the document is Chapter 3 ‘Water quality impacts’ that is structured along the three crucial
water quality impacts on ecosystem health, human health and food security. This chapter is based on
readily available, published materials on the three themes that have been compiled as a state-of-the-
art. The approaches applied (Assessment data-source triangle and the DPSIR framework) and the tools
behind the results are introduced in Chapter 2 ‘Methods’. The full World Water Quality Assessment
aims at stakeholder engagement and making data and actionable information accessible. These two
aspects are introduced and illustrated in Chapter 4 which displays first efforts made to this effect by
the World Water Quality Alliance (‘WWQA Use Cases – Stakeholder engagement and product/service
co-design’) in three pilot locations across Africa and which feed into and supplement the Assessment
and in Chapter 5 ‘Digital water quality platforms’.
102 Methods
The integrated use of the triangulation approach combined with the DPSIR framework is an
innovative approach to fill the data and knowledge gaps to better assess water quality at the
global scale:
- The triangulation approach combines in-situ, modelling and remote sensing data through novel
links, which can help to overcome the implicit limitations of each data source.
- A combination of data from the cornerstones of the triangle contributes to a better
understanding of uncertainties in simulated water quality variables and helps consolidate the
water quality assessment, especially in data-scarce regions with limited in-situ water quality
monitoring data.
- The triangulation approach has the potential to maximise the information gained from in-situ
data, modelling knowledge and remote sensing products, and identify focal regions to improve
water quality monitoring and modelling and develop strategies towards sustainable water
quality management.
- The DPSIR framework as a causal chain connecting the drivers to pressures and responses
opens new horizons of data collection from in-situ monitoring, remote sensing and water
quality modelling.
2.1 Approach
2.1.1 The DPSIR framework
The DPSIR (Drivers-Pressures-States-Impacts-Responses, Figure 2.1A) framework was developed in the
early 1990s. It was adopted by the European Environmental Agency (EEA) in 1995 as a conceptual
framework illustrating the cause-effect relationships for environmental problems (Smeets and
Weterings 1999). Since its development, the use of the DPSIR framework, alongside with indicator
development in a meaningful manner for decision-makers (OECD 2003), has been further extended,
for structuring information (Kristensen 2003). It allows the integration of knowledge from multiple
disciplines, and explains and visualizes the interactions between the environmental and socio-
economic dynamics (Lundberg 2005). Therefore, the DPSIR framework was used by multidisciplinary
studies (Tscherning et al. 2012), such as dealing with air quality (Relvas and Miranda 2018), and nature-
based tourism development (Mandić 2020). The framework was also used in water quality studies and
land-coast assessments, such as linking water pollution with human health (e.g., Boelee et al. 2019)
and nutrient load management in hinterland catchments and in coastal and marine environments and
their interactions (Salomons et al. 2005; Dolbeth et al. 2016). Hence, the DPSIR framework has shown
capability across different spatial scales, ranging from case study (Carr et al. 2007), and regional
(Hamidov et al. 2018), to the global scale (Odermatt 2004). Besides, a large body of research on
sustainable development has broadened the use of the DPSIR framework as a beneficial assessment
tool connecting the drivers to impacts and intervention priorities as well as a communication tool
between multidisciplinary researchers, policymakers, and key stakeholders for problem
understanding, participatory scenario analysis and for supporting decision making. In the current
report, the DPSIR framework is used as an overarching structure for the water quality assessment at
regional and global scales (see e.g., Table 3.1 on human health).
112.1.2 The triangulation approach
Water quality monitoring, evaluation, and prediction are increasingly recognised as priority research
topics to improve the science base for water quality management. The most common water quality
evaluation methods are i) in-situ data analysis based on data generated from direct measurements in
the water systems and laboratory analysis, ii) water quality modelling, and iii) remote sensing.
Generally, these methods are used separately and bilaterally, but rarely integrative. In-situ data is of
fundamental importance because it provides the ground truth as the basis for water quality
assessment and management on its own, especially at the local and regional scales. Moreover, it is
irreplaceable when it comes to the validation and testing of modelling and remote sensing results. The
in-situ data analysis is well recognised as a data-dependent approach and in-situ data collection is often
costly, labour-intensive, and time-consuming. Its applicability mainly depends on in-situ data
availability in terms of parameters, temporal and spatial coverage. For the model-driven analysis, often
mathematical models and methods are developed and/or validated using in-situ data in specific
regional or local case studies. The transferability and spatial validation of these approaches to other
regions - characterised by different physiographical features - are usually uncertain, in part due to lack
of publicly available data for model evaluation and inconsistent monitoring standards and units.
Modelling is the only method, out of the three, that can assess future projections and alternative
mitigation options. The remote sensing analysis has more capabilities regarding its consistent
spatiotemporal coverage compared to in-situ data and modelling analyses. Additionally, the satellite-
based remote sensing can reconstruct measurements into the past based on historical satellite images
up to 40 years back in time. The competence of remote sensing to reconstruct the past environmental
status together with its spatiotemporal scanning capability makes it an innovative tool for water quality
assessment across different spatiotemporal scales. Also, remote sensing analysis is subject to natural
limits such as the presence of clouds and only limited water quality properties that can be directly
obtained or inferred by optical-spectral imaging.
A) B)
Figure 2.1 A) The DPSIR assessment framework, illustrating the flow of cause-effect relationships for a given environmental
problem (modified from Tscherning 2012; Carr et al. 2007). B) The World Water Quality Assessment triangle suggested as
an innovative approach combining the in-situ data, modelling data and remote sensing data for better water quality
assessment across different scales (Source: GlobeWQ project).
12To overcome the limitations of each data source, an appropriate combination of in-situ, modelling and
remote sensing data is proposed as innovative triangulation approach to better assess water quality
at local, regional and global scales (Figure 2.1B). The triangulation approach strengthens the available
information and data from in-situ, modelling and remote sensing (see for example Chapter 3.1 on
nutrient pollution) and overcomes their implicit limitations through novel links. The three data sources
can be integrated to give a robust assessment of the baseline or status quo conditions through
adequate validation of models and remote sensing products. A robust baseline assessment including
the identification of hotspots over time and location (geospatial) is a prerequisite for making reliable
projections using future scenarios considering participatory management options co-designed with
stakeholders. The World Water Quality Assessment triangle in principle is able to address the whole
causal chain reflected in the DPSIR framework including feedback loops (Figure 2.1.A). Data from in-
situ and remote sensing sources provide information on the status and in some cases impact aspects
of the DPSIR framework. Combining the two with models, the Assessment triangle can reliably link to
the underlying drivers, pressures and impact, and enable assessing the effects of different response
options. This report focuses on exploring the availability of the three types of data and the potentials
to integrate them for a global comprehensive water quality assessment, in order to facilitate a full
implementation of the triangulation approach in the next stage.
2.2 Tools
As indicated in the World Water Quality Assessment triangle, mainly three types of tools and products
are used in this report, namely in-situ data, water quality modelling and remote sensing products.
2.2.1 In-situ data
In-situ monitoring remains the most frequently used way for water quality data collection at the
national and local scales. Various regional in-situ datasets are available, such as Water Information
System for Europe (WISE) and U.S. National Water Quality Portal. However, accessing and compiling
such data at the global scale has been challenging due to inconsistencies in technical aspects (e.g.
sampling, chemical analysis, reporting methods) and politic barriers, among others. An open-access
global surface and groundwater salinity dataset has been recently published (Thorslund and van Vliet
2020). It is a synthesized dataset comprising electrical conductivity in-situ monitoring data of global,
regional and local resources for 1980-2019. UNEP’s Global Environment Monitoring System for
Freshwater (GEMS/Water) Programme, established in 1978, collects worldwide freshwater quality
data for assessments of state and trends in global inland water quality. Surface and groundwater
quality monitoring data gathered from the global GEMS/Water monitoring network of member states
and organisations is shared through the GEMStat information system. GEMStat is hosted by the
GEMS/Water Data Centre (GWDC) within the International Centre for Water Resources and Global
Change (ICWRGC) at the Federal Institute of Hydrology, in Koblenz, Germany.
As of October 2020, the growing GEMStat database contained more than 14 million entries for rivers,
lakes, reservoirs, wetlands and groundwater systems from 88 countries and approximately 11,000
stations (Figure 2.2). Overall, data is available between the time period from 1906 to 2020 for about
500 parameters. The largest proportion is contributed by inorganic and organic compounds and
nutrients (Figure 2.3). Currently, the largest number of the data comes from river stations, followed by
data from groundwater, lakes, reservoirs and wetlands. The greatest coverage of stations is currently
available from Latin America and the Caribbean (7596). Most values are contributed by Latin America
and the Caribbean (4.4 million), Europe (4.3 million) and North America (3.6 million).
The water quality data available in GEMStat can be used for status quo evaluation, policymaking,
research purposes or within the scope of education and training initiatives. Since March 2019, the
available water quality data can be directly downloaded from the GEMStat portal. The data are mostly
13used for research purposes, but also used as input into international assessments, such as the
‘Snapshot of the World’s Water Quality: Towards a Global Assessment’ (UNEP 2016) and the World
Bank report ‘Quality Unknown: The invisible water crisis’ (Damania et al. 2019). In this report, GEMStat
was used for the validation and testing of several water quality models (e.g., WorldQual and MARINA
models, see Table 2.2).
Figure 2.2 Spatiotemporal availability of GEMStat data worldwide indicated by most recent sampling data.
Figure 2.3 Temporal availability of water quality samples in GEMStat by parameter group since first data record from 1906.
2.2.2 Remote sensing products
Remote sensing products have huge potential to provide additional water quality information with
large spatial coverage for inland and coastal water bodies. This is particularly beneficial in places where
in-situ monitoring is missing or lacking due to practical or financial constraints (e.g., Africa, Asia). Since
the start of Landsat missions in the 1970s, experts have developed algorithms to extract water quality
information from remote sensing satellite images (Klemas et al. 1971, Maul and Gordon 1975). In the
past decade, several efforts were initiated to provide inland water quality dataset at large (global and
14continental) scales (Table 2.1), such as Diversity II (Odermatt et al. 2018), the UNESCO world water
quality portal (Heege et al. 2019), Copernicus Global Land Service (CGLS) and AquaSat (Ross et al. 2019)
using remote sensing products from different satellites and sensors. However, it is still poorly
integrated with other sources of water quality information (Ross et al. 2019), especially modelling
results. On the positive side, the recent evolvement towards higher resolution (e.g., Sentinel-2, Landsat
8/9) and higher overpass frequency (e.g., Sentinel-3, Planet Doves) of satellites together provide
unprecedented opportunities to utilize remote sensing technology and apply the triangulation
approach for inland and coastal water quality monitoring and assessment and are available from
commercial providers at various levels. However, product quality assurance standards to ensure inter-
comparability and improving quality are not yet available on a common base, but under development.
Remote sensing can estimate optically-active water quality parameters, most commonly turbidity,
total suspended solids (TSS), Secchi disk depth (SDD), coloured dissolved organic matter (cDOM),
surface water temperature (Tsw), chlorophyll a (Chl-a), and trophic state index (TSI). Other parameters
that can be estimated include total organic carbon, dissolved organic carbon, ammonia nitrogen,
orthophosphate and total phosphorus (Gholizadeh et al. 2016). Table 2.1 provides an overview of
remote sensing products and datasets with a global coverage that are used in the current report.
2.2.3 Water quality modelling
While in-situ monitoring and remote sensing products provide information on water quality state and
to some extent impact on aquatic ecosystems (e.g., eutrophication), most water quality models can go
beyond state assessment and link the state with the drivers and pressures, and assess the impacts of
alternative management options and – as the only tool in the triangulation approach – assess and
predict future changes. Modelling is therefore of critical importance in the Assessment triangle to fully
address each element in the DPSIR framework, such as scenario analyses towards assessing the impact
of and response to climate change and socio-economic developments on water quality.
Large-scale (global and continental) water quality modelling started in the 1990s with nutrient export
modelling (Caraco and Cole 1999; Kroeze and Seitzinger 1998; van Vliet et al. 2019). In the past decade,
large-scale water quality models have emerged quickly for nutrients (Beusen et al. 2015; Mayorga et
al. 2010; Ouedraogo et al. 2016) and other water quality parameters, including water temperature
(Punzet et al. 2012; van Beek et al. 2012; Wanders et al. 2019; van Vliet et al. 2020), salinity (Voß et al.
2012; UNEP 2016; van Vliet et al. 2020), organics (Wen et al. 2018; Voß et al. 2012; UNEP 2016), arsenic
(Amini et al. 2008a; Podgorski and Berg 2020), fluoride (Amini et al. 2008b), microorganisms (Kiulia et
al. 2015; Vermeulen et al. 2019; Reder et al. 2015), plastics (Siegfried et al. 2017; Lebreton et al. 2017;
van Wijnen et al. 2019), pharmaceuticals (Oldenkamp et al. 2019), pesticides (Ippolito et al. 2015) and
other chemicals (van Wijnen et al. 2017; Wannaz et al. 2018) and toxins (Janssen et al. 2019; van Gils
et al. 2020). Efforts are also made to model the impact of water pollution at large scales, such as on
ecotoxicological risks (De Baat et al. 2019), biodiversity (Dumont et al. 2012), human health
(Limaheluw et al. 2019), and water scarcity (van Vliet et al. 2017, van Vliet et al. 2020). Furthermore,
multi-pollutant models are being developed that integrate modelling approaches of multiple groups
of pollutants (e.g. WaterGAP-WorldQual, MARINA-Global, QUAL, WFLOW-DWAQ, see Table 2.2). Such
multi-pollutant models allow to assess multi-pollutant problems of water systems in a holistic matter,
and enable us to better understand synergies and trade-offs associated with interactions between
pollutants and their drivers (Strokal et al. 2019). This allows to explore effective response options
where reducing one pollutant may reduce another. However, it remains challenging to compare or
integrate modelling results from different models (van Vliet et al. 2019) due to inconsistencies in model
inputs, spatial and temporal resolution and coverage as well as simulated water quality parameters.
Such inconsistencies can be easily seen in Table 2.2, which provides a summary of the models that are
used in Chapter 3.
15Table 2.1 Water quality products and datasets derived from Remote Sensing.
1 Spatial resolution2 & Temporal resolution &
Remote sensing products/datasets Water quality parameters Key Documentation
coverage coverage
TSS, turbidity, cDOM, Tsw,
300 m monthly Odermatt et al. (2018)
Diversity II Chl-a, cyanobacteria and
350 lakes worldwide 04/2002–03/2012 http://www.diversity2.info/products/documents/
floating vegetation
CGLS Turbidity, trophic state 300 m 10-day
Optical https://land.copernicus.eu/global/products/lwq
(Copernicus index, Spectral reflectance 4265 lakes worldwide 2005-2011 and 2016-present
Global Land 1000 m 10-day
Thermal Tsw https://land.copernicus.eu/global/products/lswt
Service) 1000 lakes worldwide 04/2002-03/2012 and 2016- present
Turbidity, SDD, Tsw, TSS, Chl- 90 m for global inland and Single snapshot between 2013-2017
UNESCO-IHP IIWQ World Water
a, trophic state index, coastal waters for global inland and coastal waters http://sdg6-hydrology-tep.eu/
Quality Portal and ESA Hydrology-
harmful algae bloom (HAB) 10-500 m (mostly 30 m) for use Daily to seasonal for 2010 onwards for www.worldwaterquality.org
TEP SD6 Reporting Portal
indicator cases use cases
1 TSS: total suspended solids, cDOM: coloured dissolved organic matter, T sw: surface water temperature, Chl-a: chlorophyll a, and SDD: Secchi disk depth
2 Resolution of raw data. Final products might be of lower resolution due to aggregation
16Table 2.2 Brief summary of the large-scale water quality models used in the current report.
Water Spatial aggregation of model
Simulated water quality parameters Temporal aggregation of model outputs Key references
Models body outputs
Parameter group Parameters1 type2 Resolution3 Coverage Resolution3 Baseline year
DRASTIC Nutrients NO3- a 15 km Africa 10-year 1990-2010 Ouedraogo et al. (2016)
Geogenic
GlobalAsGW Arsenic a 30 arcseconds Global NA (static)4 Pre-2019 Podgorski and Berg (2020)
contaminants
GloWPa Microorganisms Cryptosporidium b 0.5 degree Global Monthly Around 2010 Vermeulen et al. (2019)
GREMiS Others Microplastics b, d Basin Global Annual 2000 van Wijnen et al. (2019)
Global and (sub- Beusen et al. (2015), van
IMAGE-GNM Nutrients TN, TP, Si a, b, c 0.5 degree Annual 1970-2015
)national Puijenbroek et al. (2019)
Insecticide model Pesticides Insecticides5 b 5 arcminutes Global NA (static)4 2000-2010 Ippolito et al. (2015)
Nutrients DIN, DON, DIP, DOP
MARINA-Global Strokal et al. (n.d., 2016, 2019), van
Microorganisms Cryptosporidium b, d Sub-basin Global Annual 2010
(multi-pollutant) Wijnen et al. (2017)
Others Microplastics, Triclosan
Nutrients DIN, DON, DIP, DOP
MARINA (version 2.0) b, d Sub-basin China Annual 2012 Wang et al. (2020a)
Others ICEP
Physical Water temperature
QUAL Organics BOD b, c 0.5 degree Global Monthly 1980-2010 van Vliet et al. (2020)
Salinity TDS
Physical Water temperature Global 1971-2010 Punzet et al. (2012)
Nutrients TP
Africa, Asia,
WaterGAP-WorldQual Organics BOD Monthly Voß et al. (2012), Reder et al.
b, c 5 arcminutes Europe and Latin 1990-2010
Salinity TDS (2015), Fink et al. (2018)
America
Microorganisms Faecal Coliform
WFLOW-DWAQ Others Contaminants6 b, c 1 km Europe Annual 2017-2018 van Gils et al. (2020)
1. NO3-: nitrate, TN: total nitrogen, TP: total phosphorus, Si: Silica, BOD: biological oxygen demand, TDS: total dissolved solids, DIN: dissolved inorganic nitrogen, DON: dissolved organic nitrogen,
DIP: dissolved inorganic phosphorus, DOP: dissolved organic phosphorus, ICEP: Indicator for coastal eutrophication potential.
2. Water body types: a: groundwater, b: rivers, c: lakes and reservoirs d: coastal waters.
3. Typical reporting resolution used in the current document, which could be lower than the simulation resolution due to aggregation or averaging.
4. The model is time dependent but can account for climate inputs of different time periods.
5. Vulnerability, hazard and risk potential for insecticide runoff, non-substance specific.
6. The model simulates the cumulative impact on ecology for 1785 chemical of emerging concern, including pharmaceuticals and pesticides.
173 Water quality impacts on ecosystem health, human health and
food security
3.1 Ecosystem health
Main messages:
Nutrient pollution
- In 2020 anthropogenic nutrient sources contribute more than 70% to river nutrient loading.
- Curbing the global nutrient cycles requires paradigm shifts in food and waste systems.
- N:P ratios in global rivers have increased primarily due to selective retention filters.
- Agricultural sources contribute more than half of the total river nutrient loading. Sewage
contributes 17% of the total river nutrient loading.
- Most of the increase of river nutrient loading in the past 50 years has been in Asia.
- Harmful algae blooms are now spreading in many river basins.
Toxic stress
- The chronic and acute lethal effects of (mixtures of) chemicals on aquatic species are significant.
Two large scale European assessments report chronic effects on aquatic species to be expected at
42%-85% of the studied sites, while 14%-43% of the sites are expected to experience some degree
of species loss.
- Assessments, as mentioned above for Europe, cannot be made on a global scale. Neither the
measured data nor the information to generate predicted concentrations are available yet.
- The Human Impact and Water Availability Indicator (HIWAI) can be used to extrapolate the
results obtained for Europe. This proxy was found to correlate well with the expected loss of
aquatic species in European surface waters. Tentative results are available for Africa.
- At present no ready-to-use solution can deal with the many substances and degradation
products, protection targets and modes-of-action for chemicals to affect humans and the
environment.
- Yet, hopeful local steps can and are being taken like research on innovative regulatory solutions,
awareness raising, investments in sanitation and initiating substances authorization procedures
world-wide.
3.1.1 Introduction
In this chapter, two water quality issues with major impact on ecosystem health are described: i)
nutrient pollution and ii) toxic stress by chemicals.
Fertilizers, primarily nitrogen (N) and phosphorus (P) that have played a major role in the increased
food production, enter soils, groundwater and surface water and are transported towards coastal seas.
This has resulted in a wide range of environmental problems, ranging from groundwater pollution, loss
of habitat and biodiversity, the creation of coastal dead zones, occurrence of harmful algal blooms,
and fish kills as well as human health impacts (Damania et al. 2019, Diaz and Rosenberg 2008; Howarth
et al. 2011; Michalak et al. 2013; Rabalais et al. 2001; Turner et al. 2003; Vollenweider 1992).
Currently, over 350,000 chemicals and mixtures of chemicals have been registered for production and
use (Wang et al. 2020b). And, as a result of their use, many of these chemicals find their way to
18freshwater systems (Stroomberg et al. 2018, Liška et al. 2015, Schulze et al. 2019) and coastal waters
(UNESCO and HELCOM 2017). There they may accumulate and negatively affect the aquatic ecosystem.
3.1.2 Nutrient pollution
3.1.2.1 Impact/State
In freshwaters, algal blooms are often dominated by cyanobacteria that may generate toxins,
rendering the water unsuitable for drinking, irrigation, bathing or swimming. Also, increased growth
of algae may result in oxygen depletion and even hypoxia in the water body after the decay of the algal
biomass. This, in turn, may lead to bad smells affecting local tourism, as well as to massive fish kills
affecting local fisheries (Janssen et al. 2020).
Globally, lakes constitute an important source of water, food, and recreation. However, increasing
water pollution threatens the ability of lakes to provide these and other ecosystem services (Fink et al.
2018). Lake eutrophication specifically, is a global environmental issue that poses a survival risk to
aquatic organisms affecting fisheries and aquaculture. Alarmingly, eutrophication already is a
worldwide phenomenon, with rapidly declining aquatic biodiversity (Janse et al. 2015). One of the
symptoms of eutrophication and biodiversity loss is illustrated in Figure 3.1 showing remote sensing
observations for 450 lakes with high cyanobacteria dominance, now occurring across all continents.
Trend analyses indicate increases over time, and in several cases even regime shifts, in many lakes.
Figure 3.1 Mean cyanobacteria dominance in the years 2003-2011 for 300 of the world’s largest lakes (source: Diversity II
water quality dataset (Odermatt et al. 2018). Each lake pixel can be classified as cyanobacteria or green algae dominated.
The map shows the two classes’ relative frequency for the whole nine years of data acquired by ENVISAT-MERIS (Matthews
and Odermatt 2015).
The global map of the trophic state index (Figure 3.2, top) shows that satellites are able to identify
freshwater systems in different stages of eutrophication. Such information can be used in combination
with data on P accumulation in lake and reservoir sediments (Figure 3.2, middle), as an indicator for
the potential occurrence of cyanobacteria blooms, and the level of original freshwater biodiversity
(Figure 3.2, bottom), i.e. the species loss due to human interferences in aquatic ecosystems, including
nutrient loading differentiated by sources and dam construction in rivers.
19You can also read