GLOBAL PARIS PROFILING THE REGION'S INTERNATIONAL COMPETITIVENESS AND CONNECTIONS - Brookings Institution
←
→
Page content transcription
If your browser does not render page correctly, please read the page content below

G L O B A L PA R I S
P R O F I L I N G T H E R E G I O N ’ S I N T E R N AT I O N A L
  COMPETITIVENESS AND CONNECTIONS


G L O B A L PA R I S
P R O F I L I N G T H E R E G I O N ’ S I N T E R N AT I O N A L
  COMPETITIVENESS AND CONNECTIONS

                                    BROOKI NGS :
     J OS E PH PA R I LLA , N I CK M A RC HI O, A ND JES U S LEA L T RUJI LLO

       THE BR O O K I NGS I NSTI TUT ION | ME TROPOL ITA N POL ICY PROGRA M | 2016
EXECUTIVE SUMMARY

                         I
                                n imagination and in fact, Paris is a quintessential global city. It has been
                                one of the world’s most visited places for centuries, and its economy pros-
                                pers today thanks to a well-educated workforce, modern infrastructure, and
                                global niches in creative industries, business services, and tourism. Yet, facing
                         new pressures related to globalization, technological disruption, and demographic
                         change, the region’s growth has lagged relative to global peer regions that share its
                         economic size, wealth, and industrial structure. To deliver economic opportunities
                         for its residents, Paris must boost growth.

                         This report, developed as part of the Global Cities         15 years. In a composite economic performance
                         Initiative, a joint project of Brookings and JPMorgan       index, Paris ranks fifth in comparison with its eight
                         Chase, provides a framework for leaders in the Paris        global peers.
                         region to sustain the region’s prosperity and to bet-
                         ter understand its competitive position in the global       The Paris region can take advantage of changing
                         economy. The report offers information and insights         market, technology, and demographic trends, but
                         on Paris’s global economic position by benchmarking         it must focus on the core drivers and enablers
                         the region against eight global peer regions based on       of competitiveness. A competitive region is one in
                         economic size, wealth, productivity, industrial struc-      which firms can compete successfully in the global
                         ture, and competitiveness. Its key findings are:            economy while supporting high and rising living
                                                                                     standards for local households. Globally competitive
                         Paris is a wealthy city-region, but its economy is          traded sectors, functioning innovation ecosystems,
                         growing slowly relative to other major global cities.       and skilled labor are the key drivers of overall produc-
                         The Paris regional economy, defined as a metropolitan       tivity, employment creation, and income growth. Two
                         labor market slightly larger than the Île-de-France         enablers support these three drivers: well-connected,
                         region, housed 12.5 million people in 2015 (19 percent      spatially efficient infrastructure and a reliable gover-
                         of France’s population) and generated $818 billion in       nance structure and business environment.
                         output (31 percent of national gross domestic product,
                         or GDP). Paris is the fourth-largest metro economy in
                         the world and boasts the fifth-highest average wealth
                         (GDP per capita) among the world’s 120 largest global
                         city-regions. Paris is prosperous, but stalled growth
                         is limiting increases in that prosperity. Jobs and GDP
                         have increased at a slower rate than in global peer
                         city-regions. Average GDP per capita is growing at
                         such a pace that it will take nearly a century for living
                         standards in Paris to double. Income gains from that
     B R O O K I N GS    growth have been more broadly shared than in major
M E T R O P O L I TA N   U.S. cities or in London, but those gains have been
           POL I CY      so minimal that the average household’s disposable
        P R OG RA M      income has actually slightly declined over the last

                    2
The Paris region contains notable strengths and             workforce, professional occupations accounted for
significant opportunities to better deploy these five       nearly all net job growth during that time. As they
factors—trade, innovation, talent, infrastructure, and      demand more skilled labor, local firms are placing new
governance—to increase its global competitiveness:          demands on existing education and training systems.
                                                            Continuing to produce more high-skill workers and
      TRADE: Paris specializes in a diverse set             attract talent from both domestic and international
      of tradable industries—from financial and             sources will prove necessary in order to jumpstart
business services to advanced manufacturing to              growth and counter high unemployment, particularly
creative industries—but is limited by low participa-        among youth. In a composite talent index, Paris places
tion of small and medium-sized enterprises (SMEs)           sixth among global peer regions.
in trade. Unlike some of its peers, Paris has a diversi-
fied global presence in financial services, multina-              INFRASTRUCTURE: Paris’s transportation
tional firm headquarters, advanced manufacturing,                 and digital connectivity are strong, but it
and international tourism, culture, fashion, and media.     must continually invest to address bottlenecks.
These industries tend to drive growth in jobs and           The region is a major aviation hub, but growing
value-added, exports, and foreign direct investment.        strain from passenger flows at Charles de Gaulle
However, most firms are not globally engaged; French        International Airport warrants further investments.
SMEs account for 44 percent of value-added but only         The region’s digital connections are fast and wide-
16 percent of exports. In a composite trade index,          reaching, supporting efficient communication
Paris places fourth among peers.                            between Paris and other economic hubs. However,
                                                            physical infrastructure bottlenecks remain, especially
      INNOVATION: Paris accounts for significant            in public transit in outlying areas, logistics, and
      shares of national research and develop-              housing supply. While Paris’s core is better connected
ment (R&D), patents, and venture capital, but it is         by public transit than any peer metro area, its transit
not yet on par with other leading innovation hubs.          system is much less comprehensive in suburban
Paris is the center for innovation in France. It houses     communities. It is relatively more expensive to ship
world-class research universities, agglomerations of        goods out of Paris than other markets. Housing
high-tech employment, patent-intensive multinational        remains expensive, even as compared to other global
companies, and high levels of R&D spending. Yet,            cities, although the region has been able to increase
as compared to its global peers—some of the most            the supply of new housing over the past year. In a
innovative places in the world—Paris lags on metrics        composite infrastructure index, Paris ranks third
such as patenting intensity, industry collaboration on      among peers.
scientific research, and venture capital attraction. In a
composite innovation index, Paris ranks second to last            GOVERNANCE: Satisfaction with
among peers. Nonetheless, significant recent growth               government services is in line with peer
in the patenting output of local firms and research         countries, but the region’s business and regulatory
institutions bodes well for the Paris region’s innova-      environment is more restrictive than in city
tion potential.                                             competitors. The Paris region operates within a
                                                            more centralized government structure than its
      TALENT: Paris is one of the most educated             peer cities in the United States, which means it will
      regions in the world, but it has higher unem-         naturally have less fiscal and spending authority. The
ployment than peer regions. The Paris region’s high         Île-de-France region has made admirable attempts to
levels of human capital remain a critical asset. Sectors    consolidate its highly fragmented municipal structure,
of the economy that employed high levels of profes-         but public goods and services are still delivered
sionals and university graduates accounted for most         in a relatively fragmented setting, and this mode         GLOBAL CITY

of the job growth in the region over the past decade.       of governance likely limits efficiency and lowers         PROFILE:

In fact, despite accounting for only 24 percent of the      overall local productivity. Government services are       PARIS

                                                                                                                      3
high quality, but they could likely be delivered in a                 findings, and we recommend the region pursue its
                         more coordinated and efficient fashion. The region                    strategy using the international lens deployed in this
                         can make improvements around the business and                         report. Such a strategy would acknowledge that the
                         regulatory environment. The World Bank’s Doing                        Paris region’s tradable industries, which are engaged
                         Business project, which assembles its analysis from                   in the global marketplace for trade and talent, are
                         the perspective of a firm located in the largest                      the ultimate drivers of Paris’s growth. And with
                         city in the country, suggests that Paris’s business                   its comparative advantage residing in technology-
                         environment lags those in places like Amsterdam,                      intensive portions of the economy, Paris must focus
                         London, Los Angeles, New York, and Tokyo.                             particularly on supporting its regional innovation
                                                                                               system and preparing workers to participate in these
                         This profile benchmarking Paris against its interna-                  expanding sectors. Investments and reforms to the
                         tional peers coincides with the Île-de-France Regional                region’s infrastructure and governance, respectively,
                         Council’s efforts to create a new economic strategy                   also could help enable the region’s competitiveness.
                         to help solidify the Paris region’s core economic                     By taking purposeful action now, the Paris region’s
                         strengths and address outstanding challenges.                         public, private, and civic institutions can build a glob-
                         The Paris region is well-positioned to act on these                   ally competitive economy that works for all.

                           Summary of Paris’s performance and competitiveness factors
                                Strongest
                                Weakest

                                             Economic              Trade                   Innovation                 Talent                 Infrastructure
                                            Performance

                                                          London     San Francisco              Boston     New York            Los Angeles

                                                          Paris      Rotterdam-Amsterdam        Tokyo      Chicago

                           Metro areas are ranked according to a composite index of several variables within each category. For a full list of these
                           variables used in these indices, see methodological appendix.

     B R O O K I N GS

M E T R O P O L I TA N

           POL I CY

        P R OG RA M

                   4
I. INTRODUCTION
Cities around the world are having to adapt to a set of global forces that are rede-
fining what it takes to excel in today’s global economy.

First, globalization is intensifying. Revolutions in      number and size of cities actively engaged in global
information technology and transportation, the rapid      flows of trade, talent, and capital. Of course, these
rise of emerging markets, the globalization of finance,   same dynamics have created abundant market oppor-
and the advent of global value chains have intensi-       tunities for cities as well. For those places that allow
fied international exchange. Global flows of goods,       firms and people to successfully plug into the global
services, and capital have expanded fivefold over the     economy, the returns are high.7
last two decades, from $5 trillion in 1990 to $26 tril-
lion in 2012.1

Second, technology is altering how we communi-
cate, how firms create products and services and
                                                              “Competitive regions are,
deliver them across the globe, and the very nature
                                                             by this definition, supportive
of work itself.2 The McKinsey Global Institute pre-
                                                                 environments for both
dicts that 12 emerging technologies will generate
                                                                people and companies.”
an annual economic impact of $33 trillion by 2025.3
Risks accompany these breakthroughs; for instance,
already-demonstrated technologies have the poten-
tial to automate 45 percent of work activities in the
United States.4                                           Political, business, and civic leaders across the world
                                                          have thus become increasingly focused on under-
Third, urbanization is changing the geography of          standing and enhancing their city-regions’ economic
growth and economic activity in emerging markets,         competitiveness and connections. To help inform their
especially in Asia and Africa. The share of global        efforts, the Global Cities Initiative—a joint project of
population in metropolitan areas grew from 29 per-        Brookings and JPMorgan Chase—is exploring the com-
cent in 1950 to 50 percent in 2009, and it is predicted   petitiveness of global city-regions through a two-year
to reach 60 percent by 2030.5                             series of Global City Profiles, which include Paris. This
                                                          research draws on Harvard Business School research
Cities are on the frontlines of these shifts, and their   to define a competitive region as one in which firms
position creates both challenges and opportunities. As    can compete successfully in the global economy while
more emerging markets come online—connected by            supporting high and rising living standards for local
technology and trade—the possibilities for where firms    households.8 It acknowledges that firms ultimately
and workers can locate their activities have expanded,    compete in the global marketplace, but that the public
generating new pressures on individual cities to          sector can support a healthy and vibrant private
attract mobile talent and firms. This basic premise is    sector through investments in skills, innovation, and
not necessarily new; for centuries firms have sought      infrastructure. It also acknowledges that corporate
out supportive environments that provide them the         success alone is unsustainable if it is not accompanied
inputs required to sell their products and services.      by flourishing workers and families, and that connect-
Cities have always utilized this external demand as a     ing residents to education, training, basic infrastruc-
critical route to expanded local wealth and prosper-      ture, finance, and human services is also critical.9        GLOBAL CITY

ity. However, the competition for firms and workers
   6
                                                          Competitive regions are, by this definition, supportive     PROFILE:

has heightened considerably today, due to the sheer       environments for both companies and people.                 PARIS

                                                                                                                      5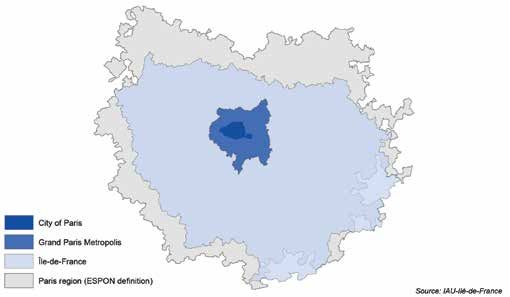
This profile draws upon a unique dataset of glob-          economic performance of the region and assess its
                         ally comparable performance indicators to offer new        comparative strengths and weaknesses on five key
                         insights about the economic competitiveness of the         competitiveness factors, and it concludes with impli-
                         Paris region (see the accompanying boxes on bench-         cations for the city-region’s network of government,
                         marking and on defining the Paris region). It uses         business, civic, and community leaders to consider as
                         international benchmarking to explore the overall          they position the Paris region on the global stage.

                           Defining and measuring competitiveness through international benchmarking

                           C
                                   ompetitiveness is defined in many ways. This research draws on the Harvard Business School
                                   definition of a competitive market as one in which firms can compete successfully in the global
                                   economy while supporting high and rising living standards for local households.10 Competitive
                           regions are, by this definition, supportive environments for both companies and people. Building on an
                           extensive literature review on regional economic development by researchers at George Washington
                           University, this research analyzes competitiveness through a five-factor framework—trade, innovation,
                           talent, infrastructure, and governance.11 The first three factors—globally competitive traded sectors, innova-
                           tion ecosystems, and skilled labor—are the key drivers of overall productivity, employment creation, and
                           income growth. The other two factors—well-connected, spatially efficient infrastructure, and reliable gover-
                           nance, public services, and business environment—enable these drivers.12 Focusing on these fundamentals
                           positions metropolitan economies to compete based on the distinct long-term value their industries and
                           people can provide, and avoids economic strategies that attract firms through “race-to-the-bottom” tech-
                           niques like one-time tax breaks or depressed wages.

                                                        Infrastructure                     Trade

                                  Enablers                                             Prosperity

                                                        Governance            Innovation            Talent

                           This report utilizes a group of carefully selected metropolitan peers to understand competitiveness beyond
                           a national context. We selected the Paris region’s peer cities through a combination of principal compo-
                           nents analysis (PCA), k-means clustering, and agglomerative hierarchical clustering using 22 variables
                           that measure economic size, wealth, productivity, industrial structure, and competitiveness.13 This analy-
                           sis revealed eight metropolitan economies that most closely resemble the economic profile of the Paris
                           region. Table 1 compares the city-region to its peer metro areas on five of these variables. Similar to Paris,
                           these metro areas are large in terms of output and population, are quite wealthy, and tend to be important
     B R O O K I N GS      hubs of business and exchange in their respective countries and regions. Whenever possible, the analy-
M E T R O P O L I TA N     sis employs comparable metrics of economic performance and the five competitiveness factors to unveil
           POL I CY        areas of comparative strength and weakness.14
        P R OG RA M

                    6
Table 1. Key indicators for Paris and global peer metro areas
Rank Population Nominal GDP Employment GDP per capita GDP per worker
1 Tokyo Tokyo Tokyo San Francisco San Francisco
2 New York New York New York Paris Los Angeles
3 London Los Angeles London Boston New York
4 Los Angeles London Paris New York Paris
5 Paris Paris Los Angeles Los Angeles Boston
6 Chicago Chicago Chicago Rotterdam- Chicago
Amsterdam
7 Rotterdam- Rotterdam- Rotterdam- London Rotterdam-
Amsterdam Amsterdam Amsterdam Amsterdam
8 Boston San Francisco Boston Chicago London
9 San Francisco Boston San Francisco Tokyo Tokyo
Source: Brookings analysis of Oxford Economics data.
Defining the Paris region
T
here are several geographic definitions of the Paris region, but two of the principal ones are the
European Spatial Planning Observation Network (ESPON) designation, which this report uses,
and the Île-de-France designation (see map). The Île-de-France region contains 1,279 independent
communes and 21 administrative units in the City of Paris, and has a population of 12 million. The ESPON
definition, which assigns a population of 12.5 million, considers commuting patterns between municipali-
ties, so its area extends slightly beyond the Île-de-France region to reflect workers moving in and out of
the region. We find this to be the best approximation of the regional economy as compared to municipal
or regional administrative definitions. Where data are not available for the ESPON area, we use data for
Île-de-France and, in a few cases, for the City of Paris. The Grand Paris metropole geography has been
introduced recently, but we do not use it in our analyses.
Paris region definitions
GLOBAL CITY
PROFILE:
PARIS
7I I . T H E S TAT E O F T H E PA R I S R E G I O N ’ S E C O N O M Y
T
he Paris region, the economic engine of France, is a preeminent global
city. Defined here as a metropolitan labor market slightly larger than
the Île-de-France region, the Paris regional economy housed 12.5 mil-
lion people and generated $818 billion in economic output in 2015,
accounting for 19 percent of France’s population and 31 percent of national gross
domestic product (GDP). Paris is the fourth-largest metro economy in the world
and boasts the fifth-highest average wealth (GDP per capita) among the world’s 120
largest global city-regions.15
In this section we profile the state of the Paris 1.3 percent between 2000 and 2015, sixth among
regional economy by examining three elements nine metro areas in this analysis but faster than
of its economic performance: growth, prosperity, France’s 1.1 percent annual growth during the period
and inclusion. (Figures 1A and 1B). Employment growth has been
more modest, averaging 0.3 percent per year since
Employment and output growth in Paris have 2000, placing Paris in the bottom third of its metro
been below average compared to global peers, and peers and behind France’s 0.4 percent annual rate
employment growth has lagged the national econ- (Figures 2A and 2B). Both employment and output
omy. The rate of change in the size of the regional experienced severe contractions in 2009, but in the
economy indicates its progress toward expanding post-crisis years they have returned to pre-recession
economic opportunity. Real GDP growth averaged growth trajectories.
Figures 1a and 1b. Real output growth, CAGR and index, 2000-2015
125
London 2.4% Paris
Los Angeles 1.9% 120
San Francisco 1.7%
Boston 1.6% 115 France
New York 1.6%
110
Paris 1.3%
Rotterdam-Amsterdam 1.2%
105
Tokyo 0.9%
Chicago 0.8% 100
2000 2003 2006 2009 2012 2015
B R O O K I N GS Source: Brookings analysis of Oxford Economics data. CAGR = compound annual growth rate.
M E T R O P O L I TA N
POL I CY
P R OG RA M
8Figures 2a and 2b. Employment growth, CAGR and index, 2000-2015
110
London 1.2%
Tokyo 0.6% France
New York 0.5% 105
Paris
Rotterdam-Amsterdam 0.5%
Los Angeles 0.3% 100
Boston 0.3%
Paris 0.3%
95
San Francisco 0.3%
Chicago 0.0%
90
2000 2003 2006 2009 2012 2015
Source: Brookings analysis of Oxford Economics data. CAGR = compound annual growth rate.
GDP per capita and productivity in the Paris region factors of production into more valuable products and
are growing faster than in France as a whole, but services. Productivity, measured as GDP per worker,
still remain sluggish compared to global peers. To grew by a 1.0 percent average annual rate from 2000
create lasting prosperity, economic growth must keep to 2015 (Figures 4A and 4B). Over the past 15 years,
pace with population and labor force growth so that both output per worker and GDP per capita grew
individuals can continue to see their standards of faster in the Paris region than in France as a whole,
living rise. Annual GDP per capita growth, a common but at the current rate of sluggish GDP per capita
metric of standard of living, has averaged 0.7 percent growth it would take nearly 100 years for average
in Paris since 2000, higher than national trends but living standards to double. Indeed, when adjusted for
sixth among its peer group (Figures 3A and 3B).16 GDP inflation, the average household’s gross disposable
per capita growth is in turn related to productivity, income actually declined by 92 euros between 2003
or the ability of firms and workers to transform the and 2013 (Figure 5).
Figures 3a and 3b. Real GDP per capita growth, CAGR and index, 2000-2015
115
Los Angeles 1.4%
London 1.3% 112 Paris
New York 1.2%
Boston 1.0% 109
San Francisco 0.9%
106 France
Paris 0.7%
Rotterdam-Amsterdam 0.7%
103
Chicago 0.5%
Tokyo 0.4% 100
2000 2003 2006 2009 2012 2015
Source: Brookings analysis of Oxford Economics data. CAGR = compound annual growth rate.
GLOBAL CITY
PROFILE:
PARIS
9Figure 4a and 4b. Growth of output per worker, CAGR and index, 2000-2015
118
Los Angeles 1.6% Paris
116
San Francisco 1.4%
114
Boston 1.2% 112
London 1.1% France
110
New York 1.1% 108
Paris 1.0% 106
Chicago 0.8% 104
Rotterdam-Amsterdam 0.8% 102
Tokyo 0.3% 100
2000 2003 2006 2009 2012 2015
Source: Brookings analysis of Oxford Economics data. CAGR = compound annual growth rate.
Figure 5. Gross disposable income per Figure 6. Gini income inequality index, latest
household (inflation-adjusted), EUR available year
24,127 24,035 Los Angeles 0.41 More
Unequal
19,670 20,337 San Francisco 0.41
London 0.41
Chicago 0.40
New York 0.40
Boston 0.38
Paris 0.34
Tokyo 0.34
Paris France Less
Rotterdam-Amsterdam 0.30 Unequal
2003 2013
Source: Brookings analysis of INSEE, Division Statistiques Source: Brookings analysis of OECD data and national
Régionales and IMF CPI statistical offices
Growth is more broadly shared than in peer city- which defines inequality on a scale from zero (perfect
regions, but the benefits have not extended to all equality) to one (perfect inequality). The Paris region
parts of the Paris region. High inequality can reduce registered a Gini ratio (after taxes and transfers) of
the durability of economic growth if it undermines 0.34 in 2010 (Figure 6).18 Income inequality in Paris
access to health care and education, limits produc- is much lower than in the U.S. states in which Paris’s
tivity-enhancing investments, and diminishes social peer cities are located, i.e., California, Illinois, New
cohesion. While many of the global economic trends
17
York, and Massachusetts. Paris’s income distribution
that contribute to income inequality are beyond is also more equitable than London’s. Still, Paris exhib-
the control of any individual city, understanding its significant spatial inequality. Poverty rates in the
B R O O K I N GS how income gains are distributed within a regional northern and eastern parts of the region remain much
M E T R O P O L I TA N economy can reveal who among the population is higher than those in the south and east (Figure 7).
POL I CY benefitting from local growth. One common way to
P R OG RA M measure income inequality is the Gini coefficient,
10Figure 7. Percentage of population living in poverty, Île-de-France municipalities, 2012
Poverty rates
0–5%
5–8.7%
8.7–14%
14–24%
24–45%
Source: INSEE, Recensements de la population.
➤ BOTTOM LINE: Paris is an extremely wealthy region, boasting the second highest GDP per capita
among its peer regions, behind only San Francisco. Yet economic growth has been slight over the past 15 years.
Despite Paris’s relative affluence, jobs and GDP have increased at a slower rate than in global peer city-regions.
Average GDP per capita is growing at such a pace that it will take nearly a century for living standards in Paris
to double. Income gains from that growth have been more broadly shared than in major U.S. cities or in London,
but those gains have been so minimal that the average household’s disposable income has actually slightly
declined. Sluggish productivity growth of only 1.0 percent per year is contributing to this lackluster perfor-
mance. Paris, and France more broadly, need to jumpstart growth.
GLOBAL CITY
PROFILE:
PARIS
11III. COMPETITIVENESS DRIVERS AND ENABLERS
A. TRADE TRADED SECTOR STRUCTURE
AND GROWTH
WHY IT MATTERS: Trade is a critical driver
of prosperity and competitiveness. Firms sell- Paris’s traded sectors are responsible for 43 per-
ing internationally inject new wealth from abroad cent of value-added and 35 percent of employment.
that, when spent locally, creates a multiplier effect Services, which account for 93 percent of total eco-
in the regional economy, spurring new jobs, growth, nomic value-added in the region, dominate the Paris
and further tax revenue to be reinvested locally. 19
economy. The Paris region has the fourth-largest
Participating in global trade also makes metro areas service economy in the world. Professional, scientific,
more competitive and productive. Firms that generate and technical services (13 percent of value-added and
revenue from outside their home markets must provide 12 percent of jobs) and information and communica-
goods and services faster, better, and more cheaply tion services (11 percent of value-added and 7 percent
than global competitors. Local companies that embed of jobs) are the region’s largest tradable services
themselves in global value chains gain access to high- (Table 2). Non-tradable services like wholesale and
quality inputs, lower their overall costs, and as a result retail trade absorb significant shares of employment
become more globally competitive. This process tends (13 percent) and output (11 percent). Higher labor
to boost productivity and wages.20 A 1 percent increase productivity in professional, scientific, and technical
in international trade leads to a 0.5-2 percent gain in services explains why a smaller number of workers
income per capita.21 Therefore, the traded economy, as generate a larger share of output in the region.22
measured by trade in goods and services and by for- Manufacturing accounts for 6.9 percent of output and
eign direct investment, is both an important signpost 5.6 percent of jobs.
and a critical driver of competitiveness.
Table 2. Paris Region’s Industrial Structure, 2015
Sector Share of jobs Share of value added
Tradable 34.7% 43.4%
Professional, scientific & technical activities 11.8% 13.0%
Information & communication 6.8% 11.4%
Manufacturing 5.6% 6.9%
Transportation & storage 5.6% 5.2%
Financial & insurance activities 4.7% 6.7%
Agriculture, forestry & fishing 0.3% 0.1%
Mining & quarrying 0.0% 0.0%
Non-Tradable 65.3% 56.6%
Wholesale & retail trade 12.8% 10.8%
Human health & social work 9.2% 5.9%
Administrative & support activities 8.7% 5.9%
Public administration & defense 8.0% 6.4%
Education 6.2% 3.7%
Accommodation & food services 5.3% 2.6%
Construction 5.2% 3.5%
Other services 3.7% 1.4%
Arts, entertainment & recreation 3.2% 1.7%
B R O O K I N GS
Real estate activities 1.8% 12.9%
M E T R O P O L I TA N
Electricity, gas & water supply 1.0% 1.9%
POL I CY
Source: Brookings analysis of Oxford Economics data.
P R OG RA M
12Advanced services have driven Paris’s traded sector professional, scientific, and technical services (2.1 per-
growth since 2000. Overall, economic output in the cent) during these years (Figure 9A). Traded output in
tradable portion of Paris’s economy has grown at advanced services has increased at a faster pace than
2 percent per year since 2000, fifth among peer employment, indicating productivity gains in these
regions (Figure 8). One simple way to gauge the sectors over the past 15 years.
health of traded sectors is to examine the change
in jobs and economic value-added within each of
them. Three sectors—professional, scientific, and
Figure 8. Output growth in traded sectors,
technical services; information and communications
CAGR, 2000-2015
services; and finance and insurance—generated 53
percent of net employment growth in Paris (equiva- London 2.6%
lent to 175,000 positions) between 2000 and 2015 San Francisco 2.4%
(Figure 9B). This contrasts starkly with the significant Los Angeles 2.3%
employment declines in manufacturing (161,000 fewer Boston 2.3%
jobs than in 2000), which occurred more precipitously Paris 2.0%
than in the nation as a whole. Manufacturing output New York 1.9%
slightly increased during this same period, reflecting Rotterdam-Amsterdam 1.5%
the fact that technological advancements have made Tokyo 1.3%
the sector more productive. Output growth was fast- Chicago 1.0%
est in information and communication (3.8 percent
annually), finance and insurance (2.5 percent), and Source: Brookings analysis of Oxford Economics data.
Figure 9a. Output growth in key traded sectors, CAGR, 2000-2015
Paris
France
Information & Financial & Professional, Transportation Manu- Agriculture,
communication insurance scientific & & storage facturing forestry &
activities technical fishing
activities
Mining &
quarrying
Source: Brookings analysis of Oxford Economics data.
Figure 9b. Employment growth in key traded sectors, CAGR, 2000-2015
Paris
France
Professional, Financial & Information & Transportation
scientific & insurance communication & storage
technical activities
activities
Manu- Agriculture, Mining & GLOBAL CITY
facturing forestry & fishing quarrying
PROFILE:
Source: Brookings analysis of Oxford Economics data. PARIS
13GOODS AND SERVICES TRADE and defense) account for nearly half of the region’s
overall goods exports (Figure 11). Between 2014 and
The Paris region registered €77 billion and €129 2015, the automotive and aerospace industries con-
billion in goods exports and imports, respectively, tributed nearly two-thirds of the region’s goods export
accruing a trade deficit of €52 billion in 2014. growth. While advanced manufacturing may no longer
Goods trade deficits are common among large ser- be a widespread source of employment, it remains a
vice economies, which tend to import most of their critical export industry. Large firms tend to dominate
primary goods and raw materials to meet basic retail, exports. Nationwide, small and medium-sized enter-
energy, and business needs. Paris’s goods trade
23
prises (SMEs) account for 50 percent of private-sector
deficit was higher in 2015 than in 2000 (when it employment, 44 percent of total value-added, and 32
was €45 billion), but it has declined from a peak percent of business investment, but only 16 percent
of €59 billion in 2008 (Figure 10). Post-recession of export revenues.24 Undoubtedly, some SMEs are
recoveries in transportation equipment and mechani- involved as suppliers to larger exporting companies
cal, electronic, and computer equipment exports have and are therefore not reflected in the official statis-
helped close the gap. These two industries alone, tics. However, it is still notable that only 5 percent of
powered by major multinational companies like PSA SMEs export, half the share as in Germany.25
Group (automotive) and Dassault Aviation (air, space,
Figure 10. Global goods trade, Île-de-France, 2012, billions EUR
150
Imports
100
Exports
50
0
Balance
-50
-100
2000 2001 2002 2003 2004 2005 2006 2007 2008 2009 2010 2011 2012 2013 2014
Source: Direction interrégionale des douanes and World Bank-OECD national accounts deflator.
Figure 11. Goods exports, Île-de-France, 2015, billions EUR
Transport equipment 20.96
Mechanical, electronic, and computer equipment 19.95
Natural hydrocarbons, mining products, electricity 4.69
Products of the agri-food industries 3.43
Publishing and communication products 1.09
Objects of art, antiques, and collection 1.03
Others 32.08
B R O O K I N GS
M E T R O P O L I TA N
POL I CY Source: Brookings analysis of fDi Intelligence data.
P R OG RA M
14Paris is the epicenter of a growing national ser- lower than in the United Kingdom. Since 1997, busi-
vices trade. In the absence of region-level data, ness services, travel, and transportation (due to the
national trade statistics are the closest proxy avail- large inflow of international travelers to the country)
able to determine Paris’s role in services trade. have generated, on average, 82 percent of France’s
Nationally, services are an increasingly important services exports (Figure 13). Given that Paris hosts
component of France’s export basket. In 2014, services more than 60 corporate headquarters and attracts
were 33 percent of all exports, up from 28 percent 16 million visitors per year, it is likely that a significant
in 2010 (Figure 12), and were a greater share than in share of these revenues concentrate in the region
Japan, the Netherlands, and the United States but (see the box on France’s service exports).26
Figure 12. Export of services as share of total exports, 2010-2014
42%
39%
33%
30% 30%
28%
25%
20% 19%
16%
France Japan United Kingdom United States Netherlands
Source: Brookings analysis of United Nations Conference on Trade and Development Data (UNCTAD)
Figure 13. National service exports by industry, 1997-2013, billions, EUR, constant
70
Business services
60
50 Travel
40
Transportation
30
Other services
20
10
0
1997 1998 1999 2000 2001 2002 2003 2004 2005 2006 2007 2008 2009 2010 2011 2012 2013
Source: WebStat Bank of France and World Bank deflator.
GLOBAL CITY
PROFILE:
PARIS
15How Paris leads France’s service exports
F
rance is a growing services exporter. Even through the recession, national services exports main-
tained a €35 billion surplus by 2013. Many of these industries cluster and concentrate in the Paris
region, which accounts for 43 percent of France’s tradable services value-added. Data measuring
the networks of multinational services firms confirm these findings. According to the Globalization and
World Cities (GaWC) Research Network (Table 3), Paris is the fourth most connected region in the world
for advanced services, a rank that stems from its high concentration of corporate headquarters and the
supportive management consulting, accounting, financial, legal, and marketing services those businesses
require. Indeed, firms with their corporate headquarters in Paris have larger balance sheets and generate
higher revenues than those in London or New York.
Table 3. Global 2000* corporate headquarters and connectivity measures, 2012 or most recent
data available
Degree of
Global network
Number Revenue Profits Assets network connec-
of head- (USD (USD (USD connectiv- tivity (%
City Country quarters billion) billion) billion) ity rank connected)
Tokyo Japan 154 3,444 125 13,088 6 65
New York U.S. 82 1,682 191 10,875 2 94
London U.K. 68 1,681 156 10,694 1 100
Paris France 60 2,011 103 11,137 4 72
Chicago U.S. 31 548 43 974 11 60
San Francisco U.S. 17 605 67 1,947 31 49
Los Angeles U.S. 16 211 20 313 18 56
Boston U.S. 12 135 14 389 38 45
Amsterdam Netherlands 9 305 12 1,845 23 53
Source: Brookings analysis of GaWC data. *The Global 2000 is a list of the 2000 largest publicly-traded companies
in the world.
Paris is also a hub for creative industries (e.g., fashion, media, culture, etc.). It enjoys a near monopoly in
the couture market, which translates into exports not only of luxury goods but also of fashion design and
brand management services. Consistently ranking among the world’s most visited cities—receiving close to
16 million people per year—Paris is also directly responsible for a large piece of France’s €10 billion tourism
revenues. International visitors have accounted for most tourism growth in the past five years. Total nights
spent in Paris hotels by domestic visitors has been flat since 2010, while those spent by international
travelers has increased by 19 percent. Increasingly, these visitors are coming for leisure, not business: the
share of nights spent in hotels by business travelers has declined from 50 percent in 2010 to 33 percent in
2015 (Figures 14A and 14B).
B R O O K I N GS
M E T R O P O L I TA N
POL I CY
P R OG RA M
16Figure 14a. Nights spent in hotels by Figure 14b. Total nights spent in hotels, 2010-
international and domestic visitors, 2015, millions, and share of business visitors
2010-2015, millions
68 66 67 67 66
38 38 38 61
35 36
32 33 32
50%
29 29 28 29 46%
45%
41%
38%
33%
2010 2011 2012 2013 2014 2015
2010 2011 2012 2013 2014 2015
Total nights spent in hotels Business share of
■ International ■ Domestic (domestic and international) millions nights spent in hotels
Source: Bilan d’activité CRT 2010 à 2015
Foreign direct investment other global regions. Paris ranked fourth among global
peers in terms of total FDI inflows between 2009 and
Paris attracted $20 billion in new foreign direct 2015 (Figure 15). These investments created approxi-
investment (FDI) since 2009, the fourth most mately 51,000 jobs, also fourth among peers. On a per
among global peers. Greenfield investments—new capita basis, Paris’s FDI inflows rank fifth (Figure 16).
establishments in foreign markets—help reveal the No metro area in this analysis comes close to London
extent to which multinational firms find the Paris ($76 billion), which receives more FDI than New York,
region an attractive operational environment vis-à-vis Rotterdam-Amsterdam, and Paris combined.
Figure 15. Total greenfield FDI, 2009-2015, Figure 16. Total greenfield FDI per capita,
millions, USD 2009-2015, thousands, USD
London $75,726 London 8.8
New York $26,621 San Francisco 6.5
Rotterdam-Amsterdam $20,176 Boston 5.0
Paris $20,148 New York 4.8
Tokyo $15,568 Paris 4.1
Los Angeles $11,189 Rotterdam-Amsterdam 4.0
Chicago $8,352 Los Angeles 3.0
San Francisco $7,570 Chicago 2.9
Boston $7,164 Tokyo 1.5
Source: Brookings analysis of fDi Intelligence data. Source: Brookings analysis of fDi Intelligence data.
GLOBAL CITY
PROFILE:
PARIS
17Technology-intensive sectors have accounted for
43 percent of total FDI since 2009. Between 2009 Figure 17. Share of total FDI in tech-intensive
and 2015, four of every 10 dollars invested by firms in sectors, 2009-2015
the Paris region were spent in science- and technol-
Boston 68%
ogy-intensive advanced industries, led by communica-
San Francisco 49%
tions and software/ information technology services.
Paris’s share of FDI in advanced industries trails Paris 43%
only Boston and San Francisco (Figure 17), arguably Rotterdam-Amsterdam 43%
the United States’ two leading innovation hubs. Chicago 38%
Other major industries included business services Los Angeles 37%
($3.3 billion), consumer products ($3.2 billion), and Tokyo 37%
textiles ($3.0 billion), reflecting Paris’s world-leading New York 26%
specializations in business and fashion (Table 4). London 22%
Source: Brookings analysis of fDi Intelligence data.
Table 4. Greenfield foreign direct investment by industry, 2009-2015
Industry Total FDI (USD million) Cumulative share of total FDI
Business services 3,323 16%
Consumer products 3,244 33%
Textiles 3,011 48%
Communications 2,294 59%
Software & IT services 1,913 68%
Financial services 1,535 76%
Real estate 1,077 81%
Hotels & tourism 595 84%
Leisure & entertainment 408 86%
Beverages 405 88%
Others 2,343 100%
Source: Brookings analysis of fDi Intelligence data.
➤ BOTTOM LINE: Unlike some of its peers, Paris has a diversified global presence in financial ser-
vices, multinational firm headquarters, advanced manufacturing, and international tourism, culture, fashion,
and media. High value-added, technology-intensive sectors are the region’s comparative advantage and growth
engine. Growth in jobs and value-added, exports, and foreign direct investment point to a common set of indus-
tries in advanced manufacturing and professional and technical services. However, most firms are not globally
engaged. Paris can fully live up to its export potential by helping more firms connect to international trading
B R O O K I N GS opportunities, supporting key tradable industry clusters, and branding the region aggressively as the premier
M E T R O P O L I TA N business and technology hub in Europe.
POL I CY
P R OG RA M
18B . I N N O VAT I O N expenditures, but R&D investment as a share of
GDP has declined slightly over time. R&D is an
WHY IT MATTERS: A region’s innovative important measure of the resources invested in the
capacity and levels of entrepreneurship both discovery and commercialization of new products,
have implications for its ability to develop and deploy processes, and technologies,32 and Paris is an R&D-
commercial applications, start new businesses, and intensive region. It allocates 3 percent of total GDP
maintain industrial competitiveness in the face of to R&D activities, higher than the national rate of 2.3
disruptive technological change. Innovation takes percent and almost twice as much as the average
many forms and can be hard to measure, especially metro in Organisation for Economic Co-operation
innovation that improves processes or management and Development (OECD) countries (1.6 percent of
techniques or that occurs in the informal economy. total GDP). However, R&D investments have slightly
Yet the most productive and technologically advanced declined from a high of 3.3 percent in 2003. As of the
metropolitan economies in the world tend to combine latest year for which we have data, R&D investment in
a common set of institutions and assets into a rich, col- Paris as a percentage of its regional economy is lower
laborative innovation ecosystem that can commercial- than in Massachusetts (largely dominated by Boston)
ize research and development into new products and and California (which includes Los Angeles and San
services. Further, for developed nations the creation of Francisco) (Figures 18A and 18B). Corporates are the
new technologies, products, and services constitutes largest source of R&D in the region, accounting for 68
the only way forward to achieve economic growth. percent, followed by higher education institutions (17
percent) and the government (13 percent). Government
The Paris region accounts for 39 percent of R&D investment has declined overall since 2000 while
France’s research and development (R&D) higher education’s share has grown (Figure 19).
Figure 18a. R&D investment as a percentage of GDP, 2013 or latest year available
Massachusetts 5.3
California 4.5
Paris 3.0
Illinois 2.4
Amsterdam 1.9
New York 1.5
London 1.0
Source: Brookings analysis of OECD Regional Innovation Indicators
Figure 18b. R&D investment as a percentage of GDP, 2000-2013 or latest year available
8
7
6
Massachusetts
5
California
4
3 Paris
Illinois
2 Amsterdam
New York
1 London
GLOBAL CITY
0
2000 2001 2002 2003 2004 2005 2006 2007 2008 2009 2010 2011 2012 2013 PROFILE:
PARIS
Source: Brookings analysis of OECD Regional Innovation Indicators
19Figure 19. R&D expenditures by sector, 2000–2013, billions (U.S. dollars), constant PPP
3.8 3.5 3.6
3.1 3.8
2.9 3.1 3.4 3.4 3.7
3.1 3.1 3.3
2.9 2.8 2.8
2.6 2.9 3.0
2.8 2.7 3.0 3.0
2.7 2.9 2.9
12.9 13.4 13.5 12.9 12.6 12.3 12.5 12.5 12.7 13.0 13.4 14.4 14.5
2000 2001 2002 2003 2004 2006 2007 2008 2009 2010 2011 2012 2013
■ Business sector ■ Government sector ■ Higher education sector ■ Private and nonprofit sector
Source: Brookings analysis of OECD Regional Innovation Indicators
A strong network of research universities supports these universities is less likely to appear in high-impact
R&D and innovation in the Paris region, but collab- scientific journals. Fourteen percent of all publications
oration with the private sector could be improved. rank in the top 10 percent of most cited academic
Research universities play a major role in driving papers, a common metric to gauge quality of research
innovation by providing basic research that underlies (Figure 20), more than the world average of 11 per-
scientific discovery and understanding, facilitating cent but less than all global peers except Tokyo. Since
the translation of research results into consumable English-language journals tend to be the most widely
goods and services, and attracting and supporting read in the scientific community, and since much of
the growth of other research-intensive industries. 33
the scientific research in Paris is likely done in French,
To measure the scientific impact of universities, the it is not surprising that Paris ranks relatively low on
Centre for Science and Technology Studies (CWTS) this metric. Current efforts by the French government
and Leiden University have compiled metrics for 750 are consolidating leading universities into a single
major universities worldwide. Six universities in the consortium to better utilize resources and produce
Paris region (École Polytechnique, Paris Descartes higher-quality research. These efforts also aim to spur
University, Université Paris Diderot, Université Paris- research collaborations with industry partners, a key
Est Créteil Val de Marne, Pierre and Marie Curie element for the successful translation of knowledge
University – UPMC, and Paris-Sud University) are into new ventures. Currently, Paris ranks at the bottom
ranked within the top 750 research universities, and in terms of the share of total scientific publications
the region trails only Tokyo and London on concen- done with industry (Figure 21).
B R O O K I N GS tration of world-class research universities.34 As
M E T R O P O L I TA N compared to global peers, however, the research in
POL I CY
P R OG RA M
20Figure 20. Share of total publications in top Figure 21. Share of total publications done
10 percent most cited papers in all fields, with industry, 2010-2013
2010-2013
Boston 22% Tokyo 9.7%
San Francisco 22% San Francisco 7.8%
Los Angeles 18% Los Angeles 7.7%
New York 17% Boston 7.6%
Chicago 17% New York 7.2%
London 16% Rotterdam-Amsterdam 6.8%
Rotterdam-Amsterdam 15% London 6.2%
Paris 14% Chicago 6.1%
Tokyo 9% Paris 4.8%
Source: Brookings analysis of Centre for Science and Source: Brookings analysis of Centre for Science and
Technology Studies (CWTS) and Leiden University data. Technology Studies (CWTS) and Leiden University data.
The Paris region registered a 26 percent increase and 2012 the region produced 2.2 patents per 10,000
in the number of patents per capita in the last workers (Figure 23), a 26 percent increase from the
10 years (Figure 22). Patents provide a reliable and 2003 to 2007 output. This represented the second-
comparable, if imperfect, measure of new inventions fastest growth rate in patent output among its metro
that spur economic development. Paris concentrates
39
peers, behind only Tokyo. Even with these gains, how-
37 percent of France’s total patents, and the region ever, Paris trails its most patent-intensive peers.
is increasing its patenting intensity. Between 2008
Figure 22. Change in patent per capita output, Figure 23. Patents per 10,000 workers,
2003-2007 to 2008-2012 2008-2012
Tokyo 60.3% San Francisco 7.0
Paris 25.6% Boston 5.5
Rotterdam-Amsterdam 16.5% Tokyo 4.8
Chicago 11.3% Chicago 2.2
San Francisco 10.9% Paris 2.2
Los Angeles 9.6% Los Angeles 1.9
Boston 5.5% New York 1.7
New York -9.6% Rotterdam-Amsterdam 1.3
London -13.4% London 0.8
Source: Brookings analysis of OECD REGPAT data. Source: Brookings analysis of OECD REGPAT data.
GLOBAL CITY
PROFILE:
PARIS
21The private sector accounts for more than a third L’Oreal, a firm that specializes in cosmetics and
of all patents invented in the region. Four industries other consumer goods, has patents in organic fine
account for nearly three-quarters of total patents: life chemistry, advanced manufacturing, macromolecular
sciences (21 percent), advanced manufacturing and chemistry, polymers, textiles, paper, and other
information technology (20 percent each), and energy consumer goods. The same pattern can be observed
and infrastructure (13 percent). Large multinational in other firms in the automotive sector, energy, and
companies in industries with vertically integrated machinery manufacturing. Table 5 highlights the
value chains help to spur innovation in the region by technologies in which the Paris region generates the
investing in different parts of the supply chain that most patents, highlighting those in which it has a
complement their products and services. For example, unique specialization.
Table 5. Top technologies by number of patents, Paris, 2008-2012
Rank Number Share Technology
Rank among of patents of total specializa-
within peers registered, patents, tion (LQ),
Paris (X/9) Technology family Technology 2008-2012 2008-2012 2008-2012
1 4 Life sciences Organic fine chemistry 1593.2 11.3% 1.70
2 2 Transport Motor vehicles 1190.6 8.5% 2.93
3 3 Precision systems Measurement 1011.6 7.2% 1.37
4 2 Information technology Digital communication 878.2 6.2% 0.88
5 6 Information technology Computer technology 866.7 6.2% 0.87
Advanced Engines, pumps,
6 2 manufacturing turbines 838.5 6.0% 2.05
Energy and Electrical machinery,
7 2 infrastructure energy 554.7 3.9% 0.75
8 5 Life sciences Biotechnology 492.1 3.5% 1.09
9 7 Life sciences Medical technology 476.0 3.4% 0.49
Advanced
10 2 manufacturing Mechanical elements 393.0 2.8% 1.06
Advanced
11 2 manufacturing Materials, metallurgy 345.2 2.5% 1.26
Energy and
12 3 infrastructure Oil and Gas 340.4 2.4% 1.38
13 5 Life sciences Pharmaceuticals 253.8 1.8% 1.34
Energy and Environmental
14 2 infrastructure technology 233.6 1.7% 1.51
15 2 Precision systems Control 230.9 1.6% 1.21
16 1 Transport Aerospace 166.7 1.2% 3.58
Energy and Combustion and
17 2 infrastructure Steam 64.3 0.5% 2.57
18 3 Transport Ships and watercraft 57.9 0.4% 1.33
Energy and
19 2 infrastructure Nuclear engineering 49.2 0.3% 1.98
20 2 Transport Other vehicles 37.0 0.3% 1.05
B R O O K I N GS
M E T R O P O L I TA N Source: Brookings analysis of OECD REGPAT data. Items in red indicate technologies in which Paris has a unique
POL I CY specialization.
P R OG RA M
22Paris concentrates 63 percent of all venture ventures.41 Compared to other metro peers, Paris
capital invested in France, but investment flows lag ranks near the bottom in terms of venture capital
most of its European and North American peers. flows, ahead of only Tokyo and Rotterdam-Amsterdam
Venture capital (VC) provides funds for innovative (Figure 24). About 62 percent of all VC investments
enterprises positioned for high growth and the in Paris come from domestic sources, in part
potential to create and capture entire new markets.40 bolstered by government efforts to spur innovation.42
Firms that receive venture capital can be particularly Five industries concentrate 60 percent of all VC
important stimulants to regional economies: VC investments into Paris: software (24 percent), media
recipients are three to four times more patent- (11 percent), pharmaceuticals and biotechnology
intensive than other firms and are much more likely (10 percent) commercial services (10 percent), and
to translate their R&D activities into high-growth medical devices (9 percent).
Figure 24. Total venture capital investments per capita, 2005-2015, USD
San Francisco 19,183
Boston 8,361
New York 1,707
Los Angeles 1,675
Chicago 958
London 823
Paris 423
Rotterdam-Amsterdam 271
Tokyo 17
Source: Brookings analysis of Pitchbook data.
“Five industries concentrate 60 percent of Paris’s
venture capital investment: software, media,
pharmaceuticals and biotechnology, commercial
services, and medical devices.”
GLOBAL CITY
PROFILE:
PARIS
23Financing the startup ecosystem in Paris
S
tartups are important players in regional economies because they help translate R&D into economic
activities that have the capability of creating entirely new industries.43 More broadly, their often
innovation-intensive business models represent one of the most important avenues for economic
growth in advanced economies.
The Paris region concentrates the necessary elements required for a thriving startup scene. It agglomer-
ates France’s most important innovation inputs: 27 percent of the nation’s world-class research universities,
37 percent of patents, 30 percent of high-tech employment, and 63 percent of all venture capital invest-
ments. Yet, given all these assets, startups frequently struggle to achieve the scale and relevance of their
American and European counterparts. Out of 191 startups with valuations higher than $1 billion,
21 are located in Europe but only one, Blabla Car, is headquartered in Paris.44
Financing is one of the main challenges affecting the performance of Parisian startups. Seed capital, a
segment of the investment cycle typically provided for activities like market research and prototyping, has
room to improve in France. A recent OECD study found that this type of investment tends to be smaller in
France than in other European countries (particularly Germany) and highly concentrated among certain
firms and sectors.45 These trends are also apparent for Paris and its regional peers: Paris ranks near the
bottom, above only Tokyo and Rotterdam-Amsterdam, in number of seed capital deals (Figure 25). Venture
capital is not the only way to measure financing for small firms, but it illustrates the technology-intensive
portions of the economy in which Paris seeks to specialize.
Figure 25. Seed capital deals, 2006-2015
San Francisco $32.5
Boston $18.8
New York $17.6
Chicago $17.5
Los Angeles $16.7
Rotterdam-Amsterdam $12.7
London $12.2
Paris $10.8
Tokyo $3.7
Source: Brookings analysis of Pitchbook data.
B R O O K I N GS
M E T R O P O L I TA N
POL I CY
P R OG RA M
24Startups in Paris also face funding constraints once they have developed a business model, are receiving
steady revenue, and are ready for expansion. Compared to global peers, Paris ranks second to last on the
average “late stage” venture capital investment (Figure 26). This lower access heavily impacts the capabili-
ties of Parisian firms to tap into new markets and consolidate their business models internationally.
Figure 26. Average later stage investment deal, 2006-2015, millions USD
San Francisco 1,995
New York 1,149
Boston 592
London 536
Los Angeles 488
Chicago 194
Paris 135
Rotterdam-Amsterdam 72
Tokyo 33
Source: Brookings analysis of Pitchbook data.
➤ BOTTOM LINE: As the center for innovation in France, Paris houses world-class research univer-
sities, clusters of high-tech employment, patent-intensive multinational companies, and high levels of R&D
spending. The rate at which new inventions, as measured by patents, are being created is on the rise. Yet the
region still lags behind some of its most innovative peers on several indicators. In high-growth entrepreneur-
ship, as measured by venture capital funding, Paris trails all of its American peer regions and London. Paris has
the necessary elements to compete with some of the most innovative places on earth, but more coordinated
efforts to better utilize its assets are required. Fostering a closer alignment of the private sector and research
universities, as well as promoting a business environment conducive to innovation, will be critical in the region’s
efforts to solidify itself as Europe’s leading global knowledge center.
“Paris has the necessary elements to compete with some
of the most innovative places on earth and solidify itself
as Europe’s leading knowledge center.”
GLOBAL CITY
PROFILE:
PARIS
25You can also read