AFRICAN DEVELOPMENT BANK AFRICAN DEVELOPMENT FUND
←
→
Page content transcription
If your browser does not render page correctly, please read the page content below
AFRICAN DEVELOPMENT BANK
                       AFRICAN DEVELOPMENT FUND

                             KINGDOM OF ESWATINI

                        COUNTRY STRATEGY PAPER 2020-2024

Task Team        George Honde, Lead Economist, ECCE
                 Farai Kanonda, Regional Operations Manager, RDGS
                 Noel Kulemeka, Implementation and Support Manager, RDGS
                 Neeraj Vij, Regional Operations Manager, RDGS
                 Bothwell Nyajena, Senior Country Economist, ECCE
                 Rees Mwasambili, Chief Regional Program Officer, RDGS
                 Mecuria Assefaw, Chief Financial Analyst, RDGS
                 Jonathan Nyamukapa, Regional Financial Management Coordinator
                 Aaron Mwila, Principal Transport Engineer, RDGS
                 Evelynne Change, Chief Governance Officer, RDGS
                 Linet G.Miriti, Principal Gender Specialist, RDGS
                 Rosemary Mokati-Sunkutu, Regional Integration Coordinator, RDGS
                 Raymond Besong, Principal Infrastructure Engineer, RDGS
                 Ahmadou Moustapha Diallo, Principal Procurement Specialist, RDGS
                 Michelle Layte, Consultant, Climate Change and Green Growth, RDGS
                 Maurice B. Wanyama, Senior Financial Management Specialist, RDGS
                 Jonathan Banda, Senior Investment Officer, COMW
                 Keiko Takei, Chief Education Analyst, AHHD1
                 Martha Njeri Kinyoho, Senior Civil Society Officer

RDGS/ECCE      Josephine Ngure, Ag. Director General, RDGS
Management     Emmanuel Pinto Moreira Director, ECCE
Peer Reviewers Albert Mafusire, Principal Country Economist, RDGE
                 Walter Odero, Principal Country Economist, COZW
                 Abdoulaye Konate, Principal Country Economist, COBI
                 Abdul Pawaah Aziz Bangura, Principal Country Program Officer, COLR
                 Michel Corbin Guedegbe, Consultant AHHD1
                           DIRECTORATE GENERAL – SOUTH
                                            JANUARY 2020
AFRICAN DEVELOPMENT BANK
AFRICAN DEVELOPMENT FUND
KINGDOM OF ESWATINI
COUNTRY STRATEGY PAPER 2020-2024
Supporting Sustainable, Diversified and More Inclusive Growth
RDGS/ECCE
February 2020Table of contents List of Figures, Boxes and Annexes .................................................................................................... i Acronyms and Abbreviations ............................................................................................................. ii Currency Equivalents and Fiscal Year .............................................................................................. iv General Map of the Kingdom of Eswatini ......................................................................................... v Executive Summary .......................................................................................................................... vi I. INTRODUCTION ....................................................................................................................... 1 II. COUNTRY CONTEXT AND PROSPECTS ............................................................................ 1 2.1. Political Context and Prospects ............................................................................................... 1 2.2. Economic Context and Prospects ............................................................................................ 2 2.3. Sector Context ......................................................................................................................... 7 2.4. Social Context and Cross-Cutting Themes ............................................................................. 8 2.5. Country Strategic Framework ............................................................................................... 10 2.6. Aid Coordination Mechanisms, Bank Positioning and Comparative Advantage ................. 10 2.7. Strengths and Opportunities, Weaknesses and Challenges ................................................... 11 III. KEY FINDINGS OF COUNTRY PORTIFOLIO PERFOMANCE REVIEW (CPPR) .... 12 3.1. Ongoing Portfolio .................................................................................................................. 12 3.2. Portfolio Performance ........................................................................................................... 12 3.3. Strategic and Operations Challenges ..................................................................................... 13 IV. LESSONS LEARNT ........................................................................................................... 13 4.1. Lessons for the Bank ............................................................................................................. 13 4.2. Lessons for the Government.................................................................................................. 14 4.3 Outcome of Stakeholder Consultations ................................................................................ 14 4.4. CODE Comments on CSP 2014-2018 Completion Report................................................... 14 V. BANK GROUP STRATEGY 2020-2024 ................................................................................. 15 5.1. Strategy Rationale, Objective and Priority Area for Bank Support ...................................... 15 5.2. Bank Strategy and Expected Results ..................................................................................... 16 5.3. Indicative Bank Lending and Non-Lending Program ........................................................... 18 5.4. Country Dialogue .................................................................................................................. 18 5.5. Financing the Strategy ........................................................................................................... 19 5.6. Implementation Arrangements, Monitoring and Evaluation ................................................. 19 5.7. Risks and Mitigation Measures ............................................................................................. 19 VI. CONCLUSIONS AND RECOMMENDATIONS ............................................................ 20
List of Figures, Boxes and Annexes

Figure 1: GDP Composition: 2000-2019 ........................................................................................... 2
Figure 2: Real GDP Growth: 2011-2022 ........................................................................................... 3
Figure 3: Eswatini Public Finances: 2014-2019................................................................................. 4
Figure 4: External accounts ............................................................................................................... 4
Figure 5: Portfolio Distribution by Sector and High 5s ................................................................... 12

Box 1: Country Context Analsis: Strengths, Weakeness, Challenges and Opportunities ................ 13
Box 2: IDEV Evaluation of the Eswatini CSPs (2009-18) .............................................................. 13
Box 3: Risks and Mitigation Measures ............................................................................................ 20

Annex 1: Results Measurement Framework ..................................................................................I
A.1.1: CSP Strategic Alignment Matrix ..............................................................................................I
A 1.2.: Performance Matrix .............................................................................................................. III
Annex 2: Indicative Lending/Non-Lending Program and contribution to the High-5s ........... V
A.2.1. Indicative Lending Program ................................................................................................... V
A.2.2 Indicative Non-Lending Program ............................................................................................ V
A 2.3 Contribution of the Indicative Lending/Non-Lending Program to the High-5s .....................VI
Annex 3: Lessons Learned ........................................................................................................... VII
A.3.1 Key findings of the CSP 2014 – 2018 Completion Report and 2018 CPPR ........................ VII
A.3.2 Key findings of BDEV Country Program Evaluation (2009-2018) .......................................IX
Annex 4: Engagement with CODE/Board .................................................................................... X
A.4.1 CODE Comments on CSP 2014-2018 Completion Report ...................................................XI
A.4.2: Findings of ED’s Visit to the Kingdom of Eswatini .......................................................... XIV
Annex 5: Findings of Stakeholder Consultations ..................................................................... XVI
Annex 6: Portfolio Performance Review ................................................................................ XVIII
A.6.1: Ongoing Portfolio ............................................................................................................ XVIII
A.6.2. Portfolio Performance ........................................................................................................ XIX
A.6.3: Portfolio Improvement Plan ................................................................................................ XX
Annex 7: Donor Mapping ........................................................................................................ XXIII
Annex 8: Comparative Socio-Economic Indicators .............................................................. XXIV
Annex 9: Selected Macroeconomic Indicators ........................................................................ XXV
Annex 10: Arrangement with the IMF ................................................................................... XXVI
A.10.1: IMF Press Statement August 23, 2019 .......................................................................... XXVI
A. 10.2. IMF Staff Completes 2019 Article IV Mission to Eswatini, November 4, 2019 ......... XXVI
Annex 11: Eswatini’s Progress towards SDGs ................................................................... XXVIII
Annex 12: Eswatini Country Fiduciary Risk Assessment (CFRA) 2019 ............................. XXX
End Notes ................................................................................................................................. XLVIII

                                                                         i
Acronyms and Abbreviations
ACC Anti-Corruption Commission
ACMS Aid Coordination and Monitoring Section
AEO African Economic Outlook
AfCFTA Africa Continental Free Trade Area
AfDB African Development Bank
AGOA African Growth and Opportunity Act
AIDI Africa Infrastructure Development Index
ARII Africa Regional Integration Index
AU African Union
AWF African Water Facility
BADEA Araba Bank for Economic Development in Africa
BDEV Independent Development Evaluation
CAADP Comprehensive Africa Agriculture Development Programme
CEDAW Convention for the Elimination of All Forms of Discrimination against Women
CFRA Country Fiduciary Risk Assessment
CMA Common Monetary Area
CODE Committee on Development Effectiveness
COMESA Common Market for Eastern and Southern Africa
CPIP Country Portfolio Improvement Plan
CPPR Country Portfolio Performance Review
CSOs Civil Society Organizations
CSP Country Strategy Paper
CSPE Country Strategy and Program Evaluation
DBDM Development and Business Delivery Model
DPs Development Partners
EFTA European Free Trade Association
EHIES Eswatini Household Income and Expenditure Survey
EPA Economic Partnership Agreement
ERA Eswatini Revenue Authority
ESPPRA Eswatini Public Procurement Regulatory Authority
EU European Union
GII Gender Inequality Index
GOE Government of Eswatini
IFMIS Integrated Financial Management Information System
INDC Intended Nationally Determined Contribution
IPU Inter-Parliamentary Union
ITF Individual Tenure Farms
LUSIP Lower Usuthu Smallholder Irrigation Project
MDGs Millennium Development Goals
MEFMI Macroeconomic and Financial Management Institute of Eastern and Southern
Africa
MEPD Ministry of Economic Planning and Development
MIC Middle-Income Country
MTR Mid-Term Review
NDP National Development Plan
NDS National Development Strategy
PEFA Public Expenditure Fiduciary Assessment
PEFA Public Expenditure Financial Accountability
iiPOCA Prevention of Organized Crime Act
PPP Public–Private Partnerships
SACU Southern African Customs Union
SADC Southern Africa Development Community
SDGs Sustainable Development Goals
SNAIP National Agriculture Investment Plan
SNL Swazi Nation Land
TAF Technical Assistance Fund
TVET Technical and Vocational Education and Training
TYS Ten-Year Strategy
UA Unit of Account
UNDP United Nations Development Programme
VNR Voluntary National Report
WGI Worldwide Governance Indicators
iiiCurrency Equivalents and Fiscal Year
Currency Equivalents
(January 2020)
Currency Unit = Lilangeni (SZL)
UA 1.0 SZL 19.45
UA 1.0 = ZAR 19.45
UA 1.0 = USD 1.38
UA 1.0 = EUR 1.24
USD 1.0 = ZAR 14.06
Government Fiscal Year
1 April – 31 March
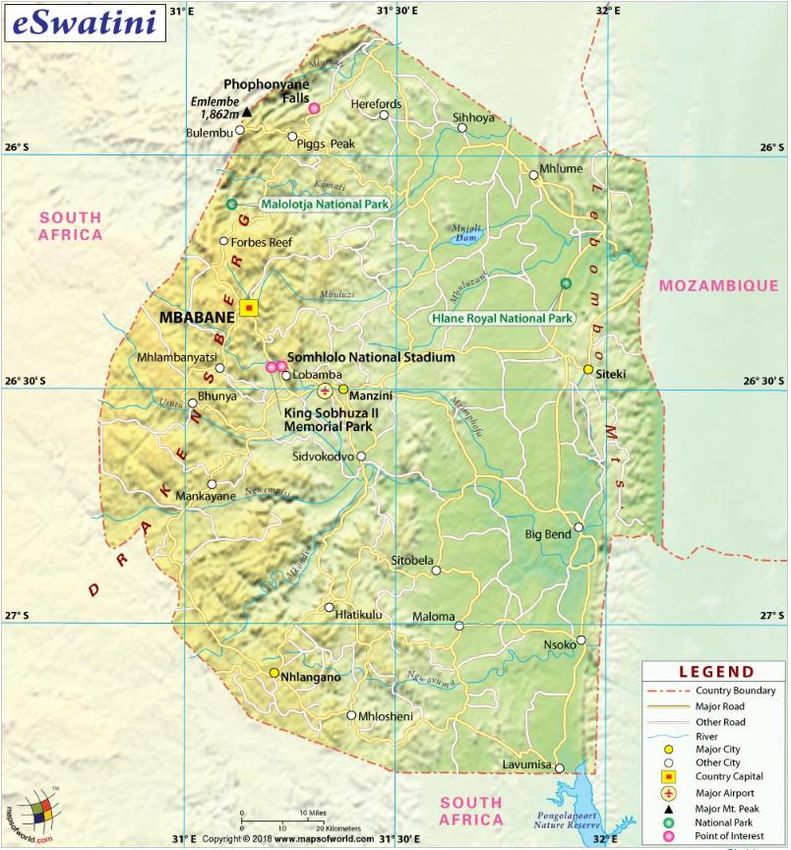
ivGeneral Map of the Kingdom of Eswatini
Disclaimer: The dimensions used and the boundaries shown on the map do not
imply on the part of the Bank Group and its affiliates, any judgment on the legal
status of any territory or any endorsement or acceptance of such boundaries.
Source: Maps for World
vExecutive Summary
1. This document proposes the African Development Bank’s Country Strategy Paper
(CSP) for the Kingdom of Eswatini for the period 2020-2024. It presents how the Bank intends to
support Eswatini’s development efforts over the period of the CSP. The choice of intervention areas
was informed by Eswatini’s development priorities as articulated in the National Development Plan
(NDP, 2019-22) and the Strategic Roadmap for Economic Recovery (2019-22) which both support
the National Development Strategy (NDS, 1997-2022). In addition to these economic blueprints, the
new strategy was informed by extensive consultations with the Government of the Kingdom of
Eswatini, private sector, civil society, a think tank and Development Partners (DPs). The CSP
immensely benefitted from the Executive Directors’ Consultation mission in January 2019 and the
Bank President’s official visit to the Kingdom in September 2019. It was also informed by
recommendations from the Independent Development Evaluation (BDEV) evaluation of Eswatini’s
CSPs from 2009-18 and lessons from the CSP 2014-18 Completion Report and 2018 Country
Portfolio Performance Review (CPPR). The new CSP is aligned with the Bank’s Ten Year Strategy
(TYS, 2013-22) and reflects the High-5 priorities of the Bank.
2. On 12th July 2019, the Committee on Operations and Development Effectiveness
(CODE) endorsed the combined CSP 2014-18 Completion Report, the 2018 CPPR and the Power
Point Presentation on the proposed priority areas of the new CSP 2020-24. The approved CSP Priority
Areas are: Priority Area I: Scaling-Up Infrastructure Investments to Foster Economic
Diversification and Priority Area II: Strengthening Economic Governance to Improve the
Investment Climate. The new CSP will mainstream crosscutting issues of green growth, climate
change, gender and youth employment. The two priority areas are complementary and predicated on
promoting macroeconomic stability and improving the investment climate so as to accelerate
Eswatini’s diversified, inclusive, and sustainable growth. The new CSP builds on the successes of
CSP 2014-18, which contributed to infrastructure development and dialogue on strengthening PFM
and laid a vital foundation for the Bank’s engagement during the new strategy.
3. Eswatini has been stuck in low growth trap over the past two decades and continues to
face significant development challenges. Real GDP growth fell from an annual average of 4.9 %
over the period 1990 - 1999 to 3.4% during the period 2000 – 2009, before further sliding to 2.4%
over 2010-2019. Since 2014, growth averaged less than 2 % and the economy has been beset by
macroeconomic imbalances emanating from the volatile Southern Africa Customs Union (SACU)
receipts, prolonged drought effects, a weak external environment and a challenging business and
investment climate. Capital formation has been small, private investment has been low and declining,
while competitiveness has remained stagnant, constrained by among others, old and inadequate
infrastructure stock. Government faces mounting challenges characterized by persistent fiscal deficits,
growing domestic arrears, depleted reserves and rapidly rising public debt. Although a low-Middle
Income Country (MIC), Eswatini faces high levels of unemployment, inequality and deep poverty.
To address these challenges, in May 2019, the Government unveiled two complementary policy blue
prints the Strategic Roadmap and the NDP aimed at, among others, restoring macroeconomic and
fiscal stability, easing the business regulatory environment, clearing domestic arrears, reinforcing
infrastructure investment and removing impediments to private sector growth so as to generate
positive investor sentiment and spur growth.
4. The overall theme/objective of the CSP 2020-24 is to support Eswatini’s economic
recovery and develop a more resilient and diversified economy that can consistently deliver
rapid, inclusive, and sustainable growth. To achieve this objective, the Bank’s interventions under
Priority Area I will target the provision of growth-oriented and catalytic infrastructure to remove
viimpediments to growth, improve the provision of basic services, reduce the cost of doing business
and increase the country’s competitiveness. The Bank will support Government’s efforts to diversify
the economy’s productive base and thereby accelerate economic recovery and inclusive growth.
Infrastructure support will focus on agriculture, transport, energy and water and sanitation. Priority
Area II will focus on galvanizing reforms aimed at bolstering economic governance which is critical
in improving the macroeconomic environment, restoring fiscal sustainability, creating a conducive
investment climate for private sector development. To promote private sector development, the Bank
will prioritize private sector financing through provision of lines of credit, facilitating guarantees,
equity funds, trade finance and Public-Private Partnerships (PPPs). The Bank will continue to provide
informative and well-focused knowledge products and enhance policy dialogue.
5. As at end December 2019, the performance of the Bank’s portfolio in Eswatini was
assessed satisfactory, with a rating of 3.0 (for rated projects) on a scale of 1 to 4. The rating at the
last CPRR (2016) was 2.5 on the same scale. The portfolio is relatively young with an average age of
3.0 years, and has no problematic projects nor outstanding Project Completion Reports of projects
that are closed. As at December 31st, 2019, the Bank’s active portfolio in Eswatini comprised nine (9)
operations with a total commitment of UA 170.5 million, a notable increase from UA97.6 million at
the 2016 CSP Mid Term Review (MTR). The ongoing portfolio’s sector distribution is spread over
four sectors and mostly invested in infrastructure (92 %). The water supply and sanitation sector
accounts for the largest share of the resources (34 %), closely followed by agriculture (30 %), then
transport (28 %) and finance (8 %).
6. In the new CSP, the Bank and the Government identified a number of operations and
has developed a pipeline for the period 2020-2024 that include 2 transport sector interventions in
roads and railways, 2 agriculture projects, a renewable energy sector program and 1 water project
under Priority Area 1. Priority Area 2 envisages implementation of 1 policy based operation (PBO)
and 1 public finance management (PFM) project. The total cost of the indicative lending program is
UA 610 million disaggregated as follows - UA 570 million (sovereign), UA 30 million from the non-
sovereign operations (NSO) window and UA10 million from the Affirmative Finance Action for
Women in Africa. The cost of the indicative non-lending operations is UA3.7 million. The Bank will
rigorously pursue additional financing through PPPs and possible e co-financing from other partners.
7. Bank lending and non-lending operations during the CSP period will be supported by
ADB resources, MIC Technical Assistance Fund (TAF) and other trust funds. As a MIC,
Eswatini has access to the ADB window and is eligible for funding from the MIC TAF and trust funds
particularly in undertaking feasibility studies, knowledge work, capacity building and technical
assistance. As regards to private sector lending, the Bank will continue to promote use of non-
sovereign lending instruments to the private sector.
8. The Boards of Directors are invited to consider and approve the Eswatini Country Strategy
Paper 2020-2024.
viiI. INTRODUCTION
1. This Country Strategy Paper (CSP) proposes the African Development Bank’s new
intervention framework in the Kingdom of Eswatinii for the period 2020-2024. It succeeds the
CSP 2014-2018 (ADB/BD/WP/2013/188) approved by the Board of Directors in February 2014. The
strategy is based on extensive consultations between the Bank, on one hand, and the Government of
the Kingdom of Eswatini (GoE), civil society, private sector and Development Partners (DPs), on the
other. The CSP was developed pursuant to the adoption, by Government, of the National
Development Plan (NDP, 2019-22) and the Strategic Roadmap for Economic Recovery (2019-22) in
May 2019. The choice of the Bank’s strategic areas of focus was informed by the development
priorities outlined in these policy blueprints, whose overarching objective is to achieve economic
recovery, macroeconomic stability and inclusive growth. The CSP takes into account the findings
and recommendations of the Country Strategy and Program Evaluation (CSPE) for two CSP cycles,
2009-13 and 2014-18, commissioned by the Bank’s Independent Development Evaluation (IDEV) in
2018, the report of the Bank Group’s Executive Directors mission to Eswatini in January 2019, as
well as lessons from the CSP 2014-18 Completion Report and the 2018 Country Portfolio
Performance Review (CPPR). The strategy is aligned with the Bank’s Ten Year Strategy (TYS, 2013-
22) and reflects the High-5 priorities of the Bank.
2. The Bank’s Committee on Operations and Development Effectiveness (CODE) endorsed
the strategic thrust of the CSP 2020-24 for Eswatini at its meeting held on 12th July 2019. The
overall theme/objective of the new Bank strategy is to support the country’s economic recovery and
develop a more resilient and diversified economy that can consistently deliver rapid, inclusive, and
sustainable growth. To achieve this objective, Bank’s support will aim at reinforcing infrastructure
development, promoting macroeconomic stability and improving the investment climate, as well as
at strengthening the country’s resilience to climate change and external shocks. Against this
background, the new Bank strategy for Eswatini is articulated around two priority areas, namely:
Priority Area I: Scaling-Up Infrastructure Investments to Foster Economic Diversification and
Priority Area II: Strengthening Economic Governance to Improve the Investment Climate.
3. This report is structured as follows: Chapter 2 presents an update on the country context and
prospects; Chapter 3 provides key findings of the CPPR; Chapter 4 presents the lessons learnt in the
implementation of the last CSP; Chapter 5 presents the Bank strategy for 2020-2024; and Chapter 6
is the conclusion and recommendation.
II. COUNTRY CONTEXT AND PROSPECTS
2.1. Political Context and Prospects
4. Eswatini is a monarchy with a dual political and legal system in which modern and
traditional institutions of governance coexist. In line with the 2005 Constitution, the King is the
Head of State mandated to appoint key members of the Government including the Prime Minister,
Cabinet Ministers and a proportion of members of the bicameral Parliament, who serve for a five-
year termii. The country’s political system has facilitated political stability and peace since
independence in 1968. The country performs well in the Global Peace Index, which ranked 72/163
in 2019, an improvement from the rank of 87 attained in 2014. The last general elections, held in
September 2018, were described by the Southern Africa Development Community (SADC) and
African Union (AU) as orderly, peaceful and calm. The AU observer mission, however, encouraged
the country to consider reviewing the ban on political parties and allow them to participate in elections
1in accordance with the country’s international commitments. This call resonated with the September
2016 High Court ruling that the ban on political parties undermines the constitutional right to freedom
of expression and association. These developments have been hailed as useful towards opening up
the political space. In November 2018, His Majesty King Mswati III appointed a new Government,
largely drawn from the private sector, including the Prime Minister. The new Government has
demonstrated commitment to economic turnaround, fiscal stability, private sector development and
improving the investment climate. The next elections are due in 2023 and, during the new CSP period,
no significant changes are expected in the political and governance landscape.
5. Eswatini marginally declined in its governance rankings on the African continent. The 2018
Ibrahim Index of African Governance (IIAG) ranks Eswatini 32nd out of 54 countries in 2017,
marginally lower than its 2014 ranking of 30th. However, the overall governance score slightly
improved by 0.6 basis points to 48.7 (out of 100) compared to 2014, below Southern Africa’s average
score of 57.1. Of the four subcomponents of the Index, the country has high scores in safety and rule
of law (61.0) and human development (57.3) in 2018 and has lowest scores in participation and human
rights (26.8/100). Sustainable economic opportunity index showed a remarkable improvement from
the rank of 24th out of 54 in 2014 to 17th in 2018. The Freedom House 2019 accorded Eswatini an
aggregate low freedom score of 16/100 from a score of 18 in 2016 on political rights, civil liberties
and freedom. The perceptions on corruption, as gauged by Transparency International Corruption
Perception Index, deteriorated with the country ranked 113/180 countries (score 0.34) in 20198 from
the rank of 69/174 countries (score 0.43) in 2014. There are, however, some efforts by the authorities
to tackle corruption through the Anti-Corruption Commission operationalized in 2017. In 2019,
Eswatini enacted the Prevention of Organized Crime Act, signed the Dar es Salaam Declaration on
Strengthening Asset Forfeiture for Development and established an Assets Recovery Fund to trace
and forfeit all proceeds of corruption.
2.2. Economic Context and Prospects
6. Eswatini’s economy exhibits slow structural transformation and limited diversification with
the industrial and services sectors contributing the largest Figure 1: GDP Composition (2000 -2019)
share of GDP. The country is classified as a low-middle 100%
income country (MIC) country, with a gross domestic product 80%
Services
60%
(GDP) per capita of USD 3,908 (2019), but faces significant 40% Industry
development challenges common to low income countries. 20%
0%
Agriculture
Agriculture’s contribution to GDP dropped from 12.3% in 2000 2010 2019
2000 to 8.8% in 2019, partly due to recurring climate change Source: Central Statistics Office, MEPD
induced droughts. Mining contribution is small (0.2% of
GDP) and currently limited to coal and quarrying. Industrial sector contribution declined from 39 %
of GDP in 2000 to 36 % in 2019, while manufacturing, dropped from 35% of GDP to 32% over the
same period. The services sector contribution to GDP significantly increased, from 46% of GDP in
2000 to 52 % in 2019. Main services sub-sectors include wholesale and retail trade (14 % of GDP)
and public sector (17 % of GDP) with the former constituting about 17% of employment share of the
services sector. The economic structural changes resulted in employment and economic activity
somewhat shifting from manufacturing and agriculture, traditionally the engine of Eswatini’s long-
term productivity and growth, towards the public and services sectors, where potential productivity
growth is generally less. Eswatini’s growth has, therefore, not been sufficiently inclusive. Potential
for value added formal employment exists in beverages, textiles, horticulture and timber processing
subject to provision of adequate financial and technical skills. Eswatini prioritizes sustainable
development, green growth and strengthening resilience to climate change.
27. The country’s economic growth in recent Figure 2: Real GDP Growth (2011-2022)
20,0 6,0
years has been subdued, expanding at an average
Sectoral Growth (%)
Real GDP Growth (%)
growth rate of 1.7 % during 2014-19. The slow 10,0 4,0
growth has been a result of mounting fiscal challenges, 0,0 2,0
a difficult external environment and the impact of the
2015/16 El Niňo drought. From a low base of 0.9% in -10,0 0,0
2011
2012
2013
2014
2015
2016
2017
2018
2019p
2020p
2021p
2022p
2014, growth rebounded to 2.3% in 2015 before
GDP Growth Agriculture Industry Services
decelerating to 1.3% in 2016 (Figure 2). However, GDP
Source: CSO, MOEPD
growth picked 2.4% in 2018, driven by recoveries in
agriculture and services sectors before receding to 1.4 % in 2019 as agriculture growth levelled off.
Industrial sector’s low key performance, which averaged around 2 % since 2014, reflects the negative
effects of fiscal challenges and the weak external demand from key export markets, in particular
South Africa. Further, the country’s suspension from the African Growth and Opportunity Act
(AGOA) eligibility during 2015 to 2017 due to concerns over the protection of workers’ rights and
from the European Free Trade Association (EFTA) over foot and mouth disease concerns in livestock,
heavily weighed down the textiles and meat processing industries. The persistent fiscal challenges
and the resultant consolidation measures consequently led to the slowing down of public capital
projects in that way hampering construction activity, and also inhibiting robust growth of services
subsectors dependent on government spending. On the demand side, consumption constituted the
highest share of GDP, averaging 89 % (66.5 % private), while gross investments averaged 12.7 %
(6.9 % government). Net exports contribution averaged -0.2 %, depicting escalating imports.
8. In the medium term, growth is anticipated to remain positive but unstable. In 2020,
growth is expected to recover to 2.5 % spurred by continued recovery in manufacturing and agro-
processing industries as agricultural production further stabilizes. In 2021, growth is projected to
recede to 1.2 %, weighed down by continued fiscal challenges. The implementation of bold reforms
measures articulated in the NDP and Strategic Roadmap have potential to induce business confidence
and promote private sector development. In particular, reforms targeted at easing the business
regulatory environment, reducing business costs, fiscal consolidation, clearing of domestic arrears,
and elimination of structural rigidities can foster macroeconomic stability and generate positive
investor sentiment. South Africa’s economic recovery, if sustained, and operationalization of new
trade agreements bode well for Eswatini’s exports oriented industries. The weak fiscal situation,
exacerbated by uncertain SACU transfers against the backdrop of elevated expenditures and
unmitigated domestic arrears, remain key risks to growth.
9. In line with inflation developments, the authorities maintained an accommodative monetary
policy to support growth. Annual inflation peaked at 7.8% in 2016, driven by drought induced food
inflation, high electricity and transport costs. Following a strong rebound in agricultural production
and a slowdown in housing and utilities costs, inflation eased to about 2.7% in 2019 and is expected
to remain within Central Bank of Eswatini’s target range of 3-7% in the medium term. As such,
monetary policy has progressively loosened, with periodic reductions in the policy bank rate (6.5%
in July 2019, from 7.25% in 2016). Membership in the Common Monetary Area (CMA), however,
precludes conduct of an independent monetary policy.
10. Public finances significantly deteriorated following a fiscal crisis in 2016 and the budget has
been in persistent imbalances. Domestic resources mobilization remains a key challenge due to the
3country’s heavy reliance on volatile SACU Figure 3: Public Finances (2014-2019)
receipts, which have however plummeted from
40,0
56% of total revenue in 2014 to 34% in 2019.
30,0
Percentage of GDP
Recurrent expenditures, which have averaged Fiscal Deficit
20,0 Total Debt
78% of total expenditures over 2014-19, remain External Debt
10,0
high, elevated by wage bill (13% of GDP in Domestic Debt
0,0 Revenue
2019) and transfers. Capital expenditures
-10,0 Expenditure
averaged 21% of total expenditures during the
-20,0
same period. Fiscal imbalances worsened in
2014
2015
2016
2017
2018
2019
2016 following a sharp decline in SACU
Source: AfDB, CSO, CBE
receipts (24%), against the backdrop of an
increase in total expenditure, in particular the wage bill which increased by 17%. Revenues have
continued to be outpaced by the elevated expenditures. Failure to effectively contain government
expenditure has resulted in large budget deficits, rising debt levels, financing shortfalls, and
accumulation of arrears. The fiscal deficit worsened to 8.5% of GDP in 2016/17, before improving
slightly to 6.5% in 2018/19, financed by central bank advances, drawdowns on international reserves,
increasing external and domestic borrowing, and accumulation of domestic arrears (estimated at 5%
of GDP). The authorities are, however, making concerted efforts to restore fiscal sustainability
through fiscal consolidation. In anticipation of the realization of the adopted measures, the deficit is
expected to decline to 6.1% of GDP in 2019/20 but is anticipated to remain around 5% in the medium
term. Diversifying fiscal revenues is key to the achievement of macroeconomic and fiscal stability.
11. Public debt has risen rapidly in recent years, prompting sustainability concerns. Total public
debt increased from 12.7% of GDP in 2014 to 29.2% in December 2019. Domestic debt increased at
a faster pace from 5.8% of GDP to 18%, while external debt increased less sharply from 6.9% of
GDP to 11.2 % during the same period. Since 2015, government increasingly relied on domestic debt
to plug expanding financing needs and in that way minimizing exchange rate risk. The government’s
2019 debt sustainability analysis (DSA), supported by the Macroeconomic and Financial
Management Institute of Eastern and Southern Africa (MEFMI), concluded that although the
country’s debt level is still relatively low, the recent increase in public debt and the high gross
financing needs raise both sustainability and liquidity concern, due to the increased interest payments
and debt servicing costs. External debt service averaged 1.6% of exports of goods and services while
ratio of external debt to exports of goods and services doubled to about 30% in 2019, compared to
2014. Government, however, remains committed to keep public debt levels below its desired debt
sustainability limit of 35% of GDP, although this threshold is likely to be breached in the medium
term. Government’s is finalizing its Debt Policy and Medium Term Debt Strategy (MTDS) and its
current thrust is to seek debt finance on concessional terms and for capital projects thoroughly
appraised for economic benefits.
12. Eswatini’s current account posted surpluses since
Months of Import Cover
Figure 4: Eswatini External Accounts (% of GDP)
2012, but the surplus has been dwindling since 2016. 15,0 4,0
% of GDP
Exports slowed down from 41.9% of GDP in 2014 to 10,0
2,0
39.0 % in 2018, while imports increased from 38.1% of 5,0
GDP to 38.4% of GDP, which triggered a contraction of 0,0 0,0
2014 2015 2016 2017 2018
the trade balance as percentage of GDP from 3.8% in
2014 to 0.6% in 2018. Net services exports averaged -4% Current Account Trade Balance Reserves
of GDP since 2014, a reflection of the country’s huge Source: Central Bank of Eswatini
demand for foreign services partly due to skills shortage.
The Lilangeni/Rand exchange rate generally weakened against major external currencies,
4depreciating by almost 30% between 2014 and 2019 against the US dollar, owing to low investor
sentiments, global trade tensions and South Africa’s weak growth performance. Official reserves
progressively declined since 2016, due to deteriorating fiscal and external positions, reaching 2.3
months of imports cover by September 2019 which is below the minimum threshold of three months
import cover. Eswatini’s external balances are vulnerable to exogenous factors, particularly those
emanating from South Africa, which underlines the need for further economic diversification.
Tourism contribution to the current account remains fairly small and international tourism relies on
regional tourism.
13. Economic and Financial Governance: Authorities adopted a battery of economic, structural
and financial governance reforms but the pace of implementation is deemed slow. The
Government’s top priority is to achieve fiscal consolidation, curb growing domestic arrears and create
the much-needed fiscal space to cater for growth enhancing capital investments and social spending.
In order to reduce the country’s dependence on the volatile SACU receipts, Government seeks to
enhance domestic resource mobilization and aims to cap SACU’s share in total revenues at 30%.
Revenue measures are targeted at raising selected consumption taxes, widening the tax base, as well
as improving tax administration and compliance. On the expenditure side, Government is pursuing
measures aimed at curbing foreign travel costs, containing the wage bill and curtailing investment
spending, among others. The last PEFA was undertaken in 2011. Identified PFM challenges persist
including budget planning, forecasting and commitment control, cash management, and weaknesses
in the procurement system including the absence of regulations for the Public Procurement Act that
was passed in 2013. There also remains a need to improve the debt management system, through the
development of a medium term debt strategy and institutional strengthening of the Debt Management
Unit (DMU) that was established in 2015. In an effort to enhance fiscal discipline and accountability,
Eswatini promulgated a new Public Finance Management Act in 2017. The Bank’s 2018 Country
Policy and Institutional Assessment (CPIA) maintained the same score as in 2014 on public financial
management noting only marginal improvements on transparency and accountability. The 2019
Country Fiduciary Risk Assessment (CFRA) rated the overall fiduciary risk as substantial.
Government embarked on implementing the Integrated Financial Management Information System
(IFMIS) with the support of the EU and the World Bank as part of the effort to improve the
management of and accountability for public finances. Although Eswatini last entered into a Staff
Monitored Program (SMP) with the IMF in 2011, the country undergoes regular IMF Article IV
Consultations, the last of which was fielded in October 2019.
14. Private Sector: The private sector is relatively small and suffers from low levels of
investment and an unfavorable business environment. Eswatini’s gross fixed capital formation by
the private sector slightly increased from 6.1% in 2014 to 7.8% of GDP in 2018, but still below the
20-25% of GDP needed for sustained, rapid growth. On the 2020 World Bank’s Ease of Doing
Business, Eswatini regressed from the rank of 110th out of 189 countries in 2015 (score 59.8) to the
rank of 121st out of 190 countries (score 59.5) in 2019. The country poorly performs on starting a
business, protecting minority investors, enforcing contracts, dealing with construction permits, and
getting electricity. For instance, starting a business requires 12 procedures compared to 7.4 for Sub-
Saharan Africa. The 956 days required to resolve a commercial dispute is considerably long. The
build-up in Government’s domestic arrears constrained the performance of companies that supply
services to the government, in particular SMEs and the construction sector which affected the
indicator of enforcing contracts. Progress was, however, registered in some of these areas. For
example starting a business was made easier by introducing free online services for name reservation
and business registration. The country increased the transparency of dealing with construction permits
by publishing online and free of charge regulations related to construction. The country is ranked first
5in Africa in trading across borders. The 2019 World Economic Forum Global Competitiveness Report
(GCR) ranked the country 121 out of 141 countries, a slight decline from 2014/15 when the country
was ranked 123rd out of 144 countries. Inefficiencies in government processes, high perception of
corruption, lack of access to finance and inadequate supply of infrastructure are identified by the
GCR as the main obstacles to business development. The Strategic Roadmap, unveiled by the
Government in May 2019 is aimed at easing the business regulatory environment and removing
impediments to private sector growth so as to generate positive investor sentiment, improve
competitiveness and spur growth.
15. Financial Sector: The banking sector (assets about 30% of GDP) is sound and stable with
the sector well capitalized, profitable and resilient. However, banks’ asset quality weakened due
to increase in non-performing loans (NPL’s). NPL’s ratio peaked at 10% in January 2019 before
declining to 8.5% in July 2019. The increase is partly linked growing government domestic arrears
which constrained economic activities of companies that supply services to Government and thus
their ability to service bank loans. Banks have accelerated use of financial technologies (fintechs) to
make existing financial products mobile and readily accessible. According to the 2019 FinScope
Survey, the adult population with access to formal financial services improved to 85% in 2018 from
64% in 2014 and, concomitantly, the proportion of those totally excluded diminished from 27% to
13% during same period. To further deepen financial inclusion, a fifth commercial bank, the Eswatini
Farmers Bank, was registered in 2018, for the first time in 30 years. In 2019, Government introduced
legislation amending the Building Societies Act to allow the conversion of Eswatini Building Society
to operate as a commercial bank. The performance of the large Non-Bank Financial Institutions
(NBFI) sector, comprising a large pension fund and insurance companies, (gross assets about 110 %
of GDP) remained positive. Private sector credit growth slowed from 11.4% in 2014 to around 6 %
in 2019, in response to the difficult macroeconomic conditions.
16. Regional Integration: Eswatini is well integrated in the region and closely linked with
neighbouring South Africa, its biggest trading partner. The country is a member of SADC, the
Common Monetary Area (CMA), SACU and the Common Market for Southern and East Africa
(COMESA). Other key trading partners are the United States under the African Growth and
Opportunity Act (AGOA) and the European Union (EU) under the Economic Partnership Agreement
(EPA), both of whom accord Eswatini preferential trade terms. The country is a signatory to the 27-
member state SADC-COMESA-East African Community (EAC) Tripartite Free Trade Area
agreement and also signed and ratified the Africa Continental Free Trade Area (AfCFTA) Treaty. On
the Africa Regional Integration Index, Eswatini performs fairly in all dimensions. Overall, Eswatini
is ranked 13th out of 20 members in COMESA (score 0.36) and ranked fifth in SADC (score of 0.52).
In 2016, the country signed the World Trade Organization’s (WTO) Agreement on Trade Facilitation
although not yet implementing commitments in full. On the World Bank’s 2020 Doing Business
Report, Eswatini greatly improved on trading across borders dimension, from the rank of 127/189 in
2015 to the rank of 35/190, a good measure of progress on trade facilitation.
17. Trade: The SACU region, at about 66% market share (South Africa 60%), is the dominant
export market for Eswatini’s products. The US, EU and the Asian markets are also important
export trading partners. In 2018, miscellaneous edibles (soft drink concentrates, caramel color and
sweets) constituted 48% of exports, followed by sugar (20%), textiles (13%) and wood (6%). The
SACU region is also the major source of imports for Eswatini, accounting for about 72% of the total
(with South Africa dominating), followed by the Asian region (16%) and the Eurozone, Sub-Saharan
Africa and North America (12% collectively). Inputs for domestic industries accounted for 33% of
total imports, followed by final consumption goods (23%), food (15%) and fuel and capital goods
6(12%). High concentration in a few large markets and key products expose the country to external
shocks, which buttresses the need for greater economic diversification. This is compounded by the
country’s limited influence in tariff policy setting under SACU due to slow operationalization of the
National Body as provided for under the SACU Agreement. The ineffectiveness of the National Body,
responsible for carrying out preliminary investigations at country level and recommending any tariff
changes necessary to the SACU Tariff Board, curtails Eswatini’s ability to invoke SACU tariffs as a
policy instrument for furthering national trade, industrial and economic development policy needs.
2.3. Sector Context
18. Water and Sanitation: Eswatini has performed relatively well in improving water and sanitation
delivery. Access to improved water supply services is estimated at 69% (2018) and access to improved
sanitation at 46%. Water supply and demand is estimated at 1,247 and 1,370 million cubic meters,
respectively, resulting in a deficit of 123 million cubic meters. Key challenges facing the water supply
and sanitation sector include effects of climate change, water scarcity, high growth in urbanization,
and aging infrastructure. These challenges point to a need for new investments to rehabilitate and
expand water supply and sanitation infrastructure. The Africa Infrastructure Development Index
(AIDI) averaged 61.14.
19. Energy: The country imports about 80% of its power requirements from South Africa
(64.5%) and 16.1% from the Southern Africa Power Pool (SAPP). Total installed generation
capacity is 69.6 megawatts, of which 60.1 megawatts is from hydropower, which contributes to 16.4%
to the total country’s energy consumption while local Independent Power Producers (IPPs) contribute
4.75%. Average electricity demand increased to 236 megawatts in 2018 from 221mega watts in 2014.
The proportion of households with access to electricity nationally, increased from 69% in 2014 to 78%
in 2018. The main challenges facing the energy sector include the reliance on power imports from
South Africa; which is also facing its own power generation problems; lack of clarity in roles for
procurement between the Eswatini Energy Regulatory Authority and Eswatini Electricity Company;
lack of incentives to improve electricity service performance and system to track performance
standards and limited ability to provide credit enhancement. The country is implementing an updated
energy policy that incorporates the use of renewable energies supplied by IPPs and full exploitation
of renewable energy has huge potential to decrease Eswatini’s exposure to energy supply risks. The
AIDI score on electricity remain low at 5.8.
20. Transport: Transport and storage activities contribute about 2.5% to GDP (2018) and high
transport costs affect the country’s competitiveness. The 2018 AIDI for transport is very low at
8.4. Roads provide the dominant form of transportation and account for at least 86% of the trade
logistics. The main road network is about 1,500 km, of which 75% are paved and 65% are in good or
fair condition. However, the majority of district roads (about 2,055 km) are unpaved and in poor
condition. The networks in the urban centers, particularly those servicing commercial and industrial
hubs, are increasingly becoming congested and restricting mobility and, thus, require expansion. The
railway network makes up a substantial share of the country’s freight transport, linking the country to
key ports of Durban and Richards Bay in South Africa and Maputo in Mozambique. Of this network,
about 131 km is in need of rehabilitation. The planned Eswatini Rail Link project is expected to create
additional commodities traffic equivalent to 10.3 million tons through Eswatini. According to the
Global Competitiveness report (WEF, 2019), the quality of Eswatini’s roads ranked 70/141, roads
connectivity 99/141, and airport connectivity 139/141. The aviation sub-sector is deemed
commensurate with the country’s demand for aviation services as it has one public airport.
721. Information and Communication Technology (ICT): Eswatini has continued to strengthen
liberalization of the telecommunications industry. The country has three telecommunications
service providers with over 80% mobile market penetration. Mobile cellular subscriptions increased
from 82.2 per 100 people in 2014 to 93.5 in 2017 while the number of fixed telephone subscriptions
declined from 4.1 per 100 people in 2014 to 3.6 in 2017. The proportion of the population using the
internet increased from 26.2% in 2014 to 47% in 2017. Government plans to further roll out broadband
networks to schools and hospitals, as well as to liberalize broadband access. However, AIDI index on
ICT stands at a low 18.32.
22. Industry: Manufacturing accounts for 88% of industry’s output, followed by construction
(9%) and utilities (3%). Key manufactured commodities include sugar, soft drink concentrate,
textiles, canned fruit and wood products which are largely destined for the export market. In terms of
employment, the industrial sector employs 16.1% of the country’s labor force, a slight reduction from
18.6% in 2014. In contrast, the services sector’s share of employment increased from 67% in 2014 to
68.6%. Agro-processing and manufacturing activity is strongly linked to agriculture, particularly sugar
production, which plays a vital role in the national economy through its backward and forward linkages
with other sectors. Eswatini’s industry faces challenges related to increased global competition,
domestic fiscal challenges weighing down on domestic demand and weak external demand amidst
global trade tensions. The textiles and meat processing industries are, particularly sensitive to external
developments. Eswatini’s 2015 Industrial Development Policy, which is aligned with the SADC
industrialization agenda is aimed at promoting industrial development.
23. Agriculture: The sector is key to Eswatini’s overall economic performance due to strong
linkages with the rest of the economy. Agriculture sustains livelihoods of close to 70% of the
country’s population. The sector provides the key raw material base to agro-processing and
manufacturing industries. Animal husbandry and crop production are the major drivers of agricultural
output at 52% (4.4% of GDP) and 31% (2.6% of GDP), respectively (2018), while forestry accounts
for 13% (1.1% of GDP). Key agricultural exports include sugar, wood products, citrus fruits, canned
fruits and meat products. The following value chains: fruit and vegetables, meat, dairy, and honey
have potential for boosting exports, promoting import substitution; increasing local employment
generation and enhancing product diversification. The binding factor for agro-processing and job
creation is low production due to lack of capacity. Challenges facing agriculture include high
vulnerability to climate change, especially drought. In addition, the sugar industry faces falling world
market sugar prices, influx of cheap foreign sugar within the SACU market and the over-supply of
sugar within the EU following the abolition of beet sugar production quotas in September 2017.
Government’s National Agriculture Investment Plan (2016-2025) is, thus, aimed at increasing the
contribution of agriculture to sustainable economic development and guiding investment in the sector.
2.4. Social Context and Cross-Cutting Themes
24. Poverty, inequality and human development: High levels of poverty persist despite a reduction
in the proportion of people living below the national poverty line to 58.9% in 2017 from 63% in 2010.
Although it is still high, income inequality, measured by the Gini coefficient, marginally declined to
0.49 in 2017 from 0.51 in 2010, attributable to government’s social welfare grants and marginal fall
in unemployment. The country has a population of 1,093,238 (2017) of which 77% is below the age
of 35 years. Eswatini’s Human Development Index (HDI) stands at 0.608 (2018), a slight change from
0.585 in 2015, thereby positioning the country at 138 out of 189 countries from 148 out of 188
countries in 2016. This HDI score puts the country in the medium human development category. While
the country’s adult HIV prevalence rate dropped from 31% in 2011 to 27% in 2018, it remains one of
8the highest in the world and a top challenge. In 2016, the country adopted the 2030 Sustainable
Development Goals (SDGs) and committed to their achievement and mainstreaming in national
development planning. Eswatini’s target is to achieve all the SDGs, but has prioritized nine which
focuses on inclusive growth, poverty eradication, social goals, energy and climate.iii (Annex 13).
25. Civil Society: Eswatini has a small but vibrant civil society championed by the Coordinating
Assembly of Non-Governmental Organizations (CANGO), which aims to coordinate, advocate and
capacitate civil society to fulfil its mandate and influence public policy. According to CIVICUS, a
global alliance of civil society organizations (CSOs) and activists, although CSOs and trade unions
can be formed in Eswatini, concerns remain regarding the openness of the civic space. However, the
awaited updating and adoption of the draft NGO policy developed in 2005 is expected to further
strengthen CSO engagement with Government and other partners.
26. Gender equality and inclusion: The Constitution provides for equality before the law in all
spheres of life. The country is a signatory to the UN Convention for the Elimination of All Forms of
Discrimination against Women (CEDAW) and is committed to the SADC declaration on Gender and
Development. The 2010 National Gender Policy, provides the framework and strategies for gender
mainstreaming into public policies. Progress has been made toward the promotion and protection of
women and girls’ rights through the enactment and amendment of various lawsiv including in 2018,
Sexual Offences and Domestic Violence Act. The number of women holding Cabinet positions
slightly increased to 30% in 2018 from 25% in 2013. However, the representation of women in
Parliament remains low at 12%, below the 50% stipulated in the SADC Protocol on Gender and
Development. The country has a low rate of female labour force participation at 46.5% vis-à-vis men
at 55.5%, while the 2018 Gender Inequality Indexv (GII) ranked the country at 145/162 (value of
0.579). Gender inequality has been exacerbated by strong patriarchal traditions, values and norms,
weak implementation of legislation and poor access to means of production, education and health.
Gender-based violence, intergenerational sex, early sexual debut, as well as limited employment and
economic opportunities for women all contribute to gender inequalities in Eswatini. The
implementation of the laws and statutes that advance women’s rights will contribute to the elimination
of all gender-based disparities.
27. Education, Skills and Employment: The labour force participation rate is low at 50.6% (2017)
and the unemployment rate, at 23.1% in 2017 (21.2% male versus 24.8% female) from 28.1% in 2013,
remains high. Youth unemployment (15-24 years) is high at 47.4%, from 51.6% in 2014, and is
compounded by limited job opportunities and yawning skills mismatches. While access to primary
education is significantly high, with a net enrolment of 95% (2016), access to Technical and
Vocational Education and Training (TVET) and Higher Education institutions remains limited because
of unaffordability and shortage of institutions. The NDP estimates that only less than 10% of the high
school leavers make it to tertiary education, which impacts employability of the youth. In recognition
of the need to improve the quality and relevance of education to the labour market needs, Government
developed a National Human Resource Development Policy and Implementation Strategy to guide
targeted investment in skills development.
28. Climate Change and Green Growth: Eswatini is highly vulnerable to climate change with
the agriculture sector being mostly affected. Government is committed to climate change adaptation
and strengthening resilience. Government developed the National Drought Mitigation and Adaptation
Plan 2016-22 and unveiled the National Climate Change Policy in 2016 aimed at providing an enabling
environment to address the climate change challenge. The country also developed the National
Resilience Strategy and Disaster Risk Reduction Policy and Action Plan (2017-2021), with activities
9You can also read