Local Strategic Plan PY 2016 - PY 2020 - Southwest Virginia ...
←
→
Page content transcription
If your browser does not render page correctly, please read the page content below

Local Strategic Plan PY 2016 - PY 2020

Interim Director, Aleta Spicer   www.swvawdb.org   (276)-883-4034

EXECUTIVE SUMMARY
       The Workforce Innovation and Opportunity Act of 2014 (WIOA) is the nation’s
principal workforce development legislation. Key components of WIOA include the following:
streamlining services through a one-stop balanced scorecard service delivery approach
(currently branded as American Job Centers) that is quality-focused, business-driven, customer-
centered, and tailored to meet the needs of regional economies.

        In recognition of WIOA and its guiding principles, the Southwest Virginia Workforce
Development Board (SWVAWDB) is pleased to present its Local Strategic Plan for workforce
development for the period Program Year (PY) July 1, 2016 – Program Year (PY) June 30,
2020. This plan identifies and assesses projected employment opportunities, projected
workforce needs, and the services that will be required in order to develop a skilled,
credentialed workforce to meet regional businesses’ needs over the years. Analysis of
workforce trends including gap analysis information is provided, as well as strategic goals and
action strategies that have been developed to address the identified issues. Labor market
information was provided by the Virginia Tech Office of Economic Development (VTOED)
using the Virginia Workforce Connection Labor Market Data, the U.S. Department of Labor,
the U.S. Census, and regional research data.

        Additionally, an assessment is provided of the current status of the workforce, including
current business demands for workers and skills. Local area governance information is
provided, including information on the Chief Local Elected Officials (CLEOs), the Workforce
Development Board (WDB), and the fiscal responsibilities of the Board. System development
of the Virginia Workforce Center is discussed, including services provided by partners, and
services available for specific populations. There are two customer bases for receipt of services
through the local workforce development system: Businesses and job seekers.

         The plan also describes the delivery of workforce development services through Area
One’s Virginia Workforce Centers (One-Stops) and affiliate sites, including access to services
for the general population, adults and dislocated workers, youth, and businesses. Included by
reference or attachment are required WDB policies and certifications. The SWVAWDB
recognizes the need to increase the visibility of the workforce development system and the role
of the Board in economic development throughout the region. Partnerships, collaborative
efforts, increased resources and innovative programming are set forth in the plan to address
these overarching needs.

       In the preparation of this plan, the Strategic Planning Committee, made up of Board and
CLEO members, held an initial meeting to chart the process for its development. The
Committee developed the Mission and Vision Statements, reviewed the State plan in order to
ensure alignment in the Area, began a SWOT analysis, and discussed the overall needs of the
area. The Business Services Team conducted a needs assessment with area businesses; Virginia
Tech Office of Economic Development (VTOED) conducted a focus group of SWVAWDB
stakeholders, and through contract, provided the labor market data for the plan. Virginia Tech
Office of Economic Development also led a Board retreat, which included WDB board
members, CLEO members, and partners. During the retreat, the SWOT analysis was completed
and goals and strategies were outlined. Through public comment and Board review, all
required partners will have a voice in the development of this document. This local plan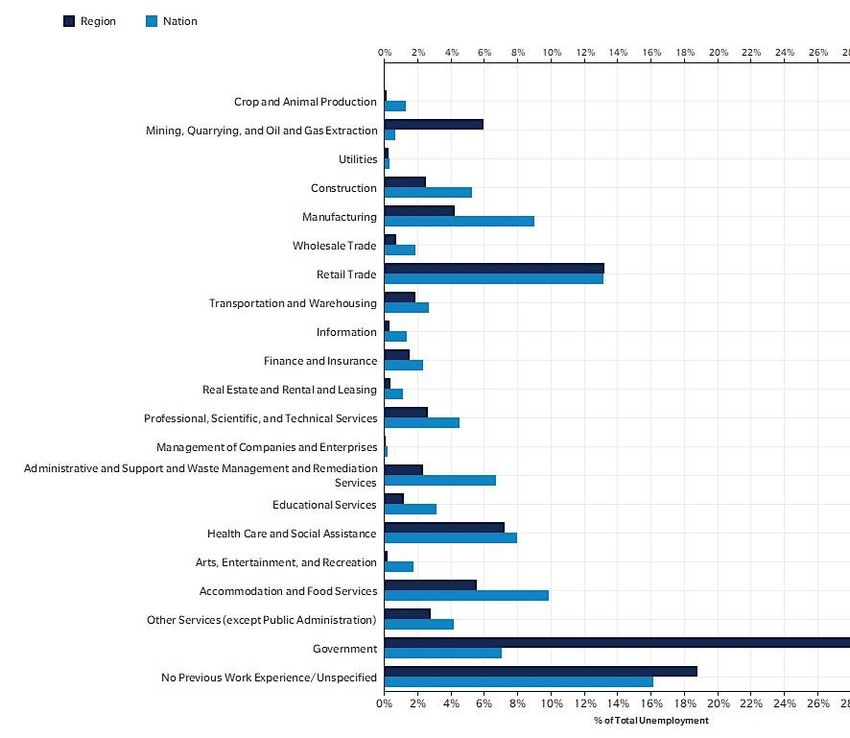
describes how local workforce development activities will be directed over the next four years
to promote effective economic, education, and workforce development partnerships that will
help develop and sustain productive workers for business, and thereby assist with the creation
of prosperous communities that maintain the quality of life for the area’s citizens.

        It is the intent of the Board to consistently promote effective, efficient, streamlined
services to all citizens and to build quality into processes that will make the system of resources
openly available through technology as well as through the Virginia Workforce Centers. The
SWVAWDB’s PY 2016- PY 2020 Local Strategic Plan is intended to be a “top drawer” plan –
not an “in-the-drawer” plan.
ACKNOWLEDGEMENTS

The Southwest Virginia Workforce Development Board would like to thank the following
individuals for all of their hard work, dedication, and contribution of time and effort in the
planning and development of the 2017-2020 Local Strategic Plan:

Strategic Planning Committee:
Bill Franklin, Chair; James Dye, Sharon Vandyke, Vinny Ringrose, Tonya Hurt, Michael
James, Rebecca Scott, David Yates (CLEO)

Virginia Tech Office of Economic Development:
Scott Tate, Sarah Lyon-Hill, Faruk Faluke, Ronnie Stephenson, Allison Homer

Southwest Virginia WDB Staff:
Aleta Spicer, Cara Owens, Rachel Patton, Sarah Bundy, Stephen Mullins, Betty Segal

We would also like to thank our wonderful WDB board members, CLEO board members,
program operators, workforce staff, and partner agencies for your service and contribution
to the success of the Southwest Virginia Workforce Development Board and this region.
INTRODUCTION
        With the implementation of the Workforce Investment Act of 1998, the Southwest
Virginia Workforce Development Board embarked on its mission to develop a workforce
system that would provide a well-trained workforce compatible with both the needs of existing
businesses and adaptable to the needs of prospective businesses, to be recruited through the
Area’s economic development efforts. The process has been ever-changing, a struggle at times,
and with the enactment of the Workforce Innovation and Opportunity Act of 2014, a new way
of doing business followed, yet always with the same goal in mind- to provide businesses with
the workforce to diversify the economy, and to provide the workforce with pathways to well-
paid, satisfying careers that maintain their quality of life in Southwest Virginia.

“We envision meeting the needs of our businesses and workers by enhancing
skills to create a qualified, career-ready workforce that reflects the Southwest
Virginia values of honesty, dependability, and resiliency.”
       These new ways of doing business – from integration with the State plan to the
development of sector partnerships with businesses to the creation of rapid responses to the
economic downturn in the coal industry – dictate more innovation, more collaboration and more
resource sharing in the day-to-day delivery of services to the SWVAWDB’s two main
customers: Businesses and job seekers.

       A re-statement of the mission of the SWVAWDB reflects its commitment to new ways
of doing its work in a way that best serves both businesses and jobseekers, while focusing on
the success of the Southwest Virginia community as a whole.

“We will build a business-driven, employee-centered workforce system to
support economic diversity and development that will sustain the quality of life
in the region.”
        Through this Local Strategic Plan for PY 2016- PY 2020, the SWVAWDB is committed
to more in-depth work with the Area’s businesses; increased diverse, quality programming for
job seekers; the creation of two outstanding Virginia Workforce Centers (One Stops) as the
service delivery mechanism, and further development of its role as the regional convener for the
Area’s workforce development system.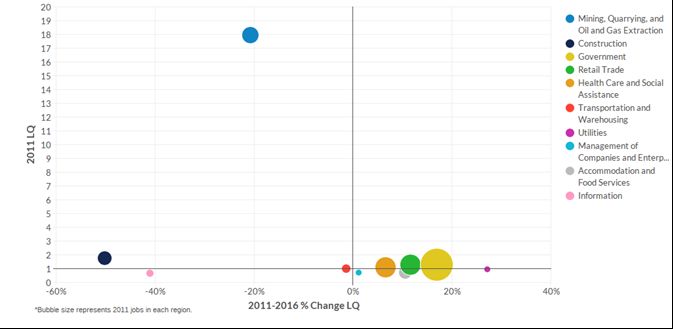
Local Strategic Plan
Table of Contents
Executive Summary                                          -
  Acknowledgement                                          -
  Introduction                                             -
Local Workforce Development Strategic Planning Elements
  Demand Analysis                                          1
  Supply Analysis                                         18
  SWOT Analysis                                           23
  Vision & Goals                                          29
  Strategy and Partnerships                               30
  Additional Strategic Elements                           32
Local Workforce Development System Elements
  Programs and Partners                                   33
  Collaborative Strategies                                36
  Business Services                                       48
  Economic Development                                    60
  One-Stop Systems                                        61
  Adult and DLW Services                                  68
  Rapid Response                                          71
  Youth Services                                          71
  Supportive Services                                     78
  Training Services                                       78
  Education                                               81
  Adult Education and Literacy                            82
  Priority of Service                                     83
  Incorporation of Technology                             84
  Setting of Standards                                    84
  Quality Assurance                                       85
  Fiscal Agent                                            86
  Procurement                                             86
  Performance                                             87
  Public Comment Period                                   88
  Appendix 1                                              89
Local Workforce Development Strategic Planning Elements

   Workforce Demand Analysis
           The Southwest Virginia Workforce Development Board’s (SWVAWDB) planning and
   programming are data driven, beginning with the numbers and analysis of the workforce in
   demand and concluding with the numbers and analysis of the workforce available. The
   identified gap then becomes the basis for strategic planning to meet the economic development
   and business needs of the area. Virginia Tech’s Office of Economic Development has been Area
   One’s “data” partner for many years and brings invaluable analysis and insight to the WDB’s
   planning process.

           Local Workforce Development Area I (LWDA I) is comprised of the counties of Lee,
   Scott, Wise, Dickenson, Buchanan, Tazewell, Russell and the City of Norton. The region
   encompasses two separate Planning District Commission (PDC) regions in their entirety: the
   Lenowisco PDC, which includes Lee, Norton, Wise, and Scott and the Cumberland Plateau PDC
   which includes Russell, Tazewell, Dickenson, and Buchanan. The region covers the far
   southwest corner of the Commonwealth, and includes virtually all of Virginia’s coal production.
   It has historic strengths in agriculture, forestry, mining and smaller-scale manufacturing.

           The driver industries in the region today are in a state of transition, with the continued
   decline of coal industry employment, declines in public sector employment, a slowly emerging
   technology sector, and fluctuations in manufacturing, construction, and other sectors. To better
   identify regional driver industries and their in-demand occupations, secondary data were pulled
   including total employment and job growth. Surveys and stakeholder engagement sessions were
   conducted (with businesses, economic development and education partners) to solicit feedback.

           Industries are classified using the government-defined standard North American Industry
   Classification System (or NAICS). NAICS uses a 2- through 6-digit classification hierarchy,
   with five levels of detail. At the 2-digit (less detailed) level, the three leading industries in which
   most of the region’s jobs are found are government, retail trade, and health care and social
   assistance.

                                                                                                         1
The top ten industries are displayed in the following table.
Top Ten Industries
2011 2016 Change in Jobs % 2016 Earnings
Industry
Jobs Jobs (2011-2016) Change Per Worker
Government 15,873 14,785 -1,088 -7% $45,777
Retail Trade 9,339 9,012 -328 -4% $26,600
Health Care and Social Assistance 9,085 8,862 -223 -2% $43,204
Accommodation and Food Services 4,128 4,234 106 3% $15,171
Mining, Quarrying, and Oil and Gas
6,549 3,525 -3,024 -46% $80,888
Extraction
Construction 4,995 2,397 -2,598 -52% $47,654
Manufacturing 3,617 2,941 -676 -19% $51,875
Administrative and Support and
Waste Management and 2,223 1,898 -325 -15% $30,036
Remediation Services
Transportation and Warehousing 2,102 1,887 -215 -10% $52,345
Professional, Scientific, and
1,938 2,194 256 13% $49,704
Technical Services
Of these top ten industries for number of jobs, eight experienced job declines from 2011-
2016. Interestingly, despite a decline in total number of jobs that exceeds 3,000, the Mining,
Quarrying, and Oil and Gas Extraction industry remains the fifth leading industry for
employment in the region.
There are a number of ways to explore industry and employment data, and one useful
measure is location quotient (LQ). The LQ of an industry is a way of quantifying how
“concentrated” an industry is in a region compared to a larger geographic area, such as the state
or nation.
Looking at the LWDA I region as a whole, the top ten industries (2-digit level) in terms
of concentration or LQ can be identified and are depicted visually in Figure 1. The ten industries
with the highest concentration are represented as differently colored dots or “bubbles”. The
bigger the bubble, the more jobs in that industry in 2011. The bubbles to the right of the vertical
axis represent industries that experienced an increase in jobs from 2011-2016.
2Figure 1: Highest Industry Location Quotient 2-digit Level 1
Based on industry concentration, growth potential, and occupation earnings levels, four
driver industry sectors were identified for LWDA I: manufacturing, healthcare and social
assistance, technology sector, and construction. These are all areas of growth potential.
Moreover, four additional secondary sectors of interest were identified, each of these employing
a significant number of workers in the region but that may have experienced recent employment
declines, anticipate uncertain growth prospects, or contain a high number of lower wage or lower
skilled occupations. These four secondary sectors include: mining; transportation and
distribution; accommodation and food service; and arts, entertainment and recreation.
3Primary and Secondary Driver Industry Sectors
Industry Cluster Total Projected Projected Location Competitive
Jobs Jobs Job Quotient Effect (2016-
(2016) Change Growth (2016) 2021)
(2016- (2016-
2021) 2021)
Driver Industry Sectors
Healthcare 9,404 832 9% 1.08 (-160)
Manufacturing 3,098 (-131) (-4%) .59 (-92)
Information Technology 907 207 22.8% * 120
Construction 3,669 150 4% .92 15
Secondary Sectors of Interest
Transportation and 2,323 (-33) (-1%) .87 (-200)
Warehousing
Mining and Extraction 3,678 (-736) (-20%) 13.51 (-986)
Accommodation and Food 4,455 112 3% .79 (-163)
Services.
Arts, Entertainment and 507 56 11% .31 18
Recreation
Healthcare Industry
Reflecting national trends, the healthcare industry in LWDA I is projected to grow its
employment by 9% in the next five years. The healthcare and social assistance sector consists of
these subsectors: Ambulatory Health Care Services; Hospitals; Nursing and Residential Care
Facilities; and Social Assistance. In LWDA I, total employment in these sectors was 8,862 in
2016, 16% above the national average for employment concentration although the employment
declined slightly from 2011-2016 (2.5% decline). The overall average earnings per job was
$43,204. Of the workers employed in this sector in 2016, over 81% were female.
Many of these occupations call for similar skill sets, but perhaps to varying degrees of
expertise. Some of the top shared skills required for the in-demand occupations below include:
4- Knowledge competencies: customer and personal services, psychology, therapy and
counseling, and the English language;
- Skills competencies: service oriented nature, critical thinking, reading comprehension,
social perceptiveness, speaking, active listening, and monitoring;
- Abilities: oral comprehension and expression, problem sensitivity, written comprehension
and speech recognition;
Several of these skills relate to a worker’s ability to assess a situation and come up with a
solution. For instance, monitoring entails observing and assessing oneself and others to make
improvements or take corrective action. Problem sensitivity describes a worker’s ability to
perceive a potential problem even before it occurs and take actions to prevent it. Social
perceptiveness refers to workers’ awareness of “others’ reactions and understanding why they
react as they do”.2 Many businesses and workforce service providers, which VTOED has
engaged for this and other research projects, have described a need for these assessment and
critical thinking skills in all industry workforces.
In-demand Healthcare Total Projected Job Average Average
Occupations Jobs Growth Annual Job Hourly
(4-digit SOC codes) (2016) (2016-2021) Openings Earnings
(2016-2021)
Nursing, Psychiatric, and Home 1,100 8% 48 $11.32
Health Aides
Credentials: Short-term OJT
Registered Nurses 1,096 (-1%) 34 $24.91
Credentials: Bachelor’s Degree
Licensed Practical and Licensed 704 1% 25 $16.12
Vocational Nurses
Credentials: Postsecondary non-degree
Health Practitioner Support 502 4% 12 $12.70
Technologists and Technicians
Credentials:
Social Workers 478 8% 21 $18.70
Credentials: Bachelor’s Degree, Master’s for Healthcare
Miscellaneous Healthcare Support 393 10% 18 $13.75
2 US Department of Labor (2017). O*Net Online. https://www.onetonline.org/
5Occupations Credentials: Short-term OJT
Therapists 376 15% 23 $40.17
Credentials: Doctoral or Professional Degree
Physicians and Surgeons 284 1% 11 $94.24
Credentials: Medical School, Specialization, MD
Emergency Medical Technicians 223 23% 17 $13.12
and Paramedics
Pharmacists 190 2% 6 $51.86
Credentials: Bachelor’s Degree +, Apprenticeship
Diagnostic Related Technologists 174 (-2) % 5 $23.04
and Technicians
Credentials: Doctoral or Professional Degree
Occupational Health and Safety 151 0% 4 $32.27
Specialists and Technicians
Credentials: Some Postsecondary education, no
credential
Physical Therapist Assistants and 126 25% 11 $24.96
Aides
Credentials: Associate Degree
Manufacturing Industry
The manufacturing sector in LWDA I included 2,941 jobs in 2016, which was 40%
below the national average for manufacturing jobs. The average annual earnings for
manufacturing workers is $51,785, which is good for the region, but significantly less than the
national average for manufacturing workers.
Industry employment in the region declined by 676 jobs, or 18.7%, from 2011-2016,
while national manufacturing employment increased by 4.7% during the same period. In 2016,
79% of the region’s manufacturing industry workers were male and 21% female. Over half of
workers in the industry are age 45 or older (50.7%).
6Looking at the sub-sectors within manufacturing, the top five 3-digit NAICS sub-sectors
in 2016, by number of jobs, were:
• Machinery Manufacturing, 607 jobs
• Fabricated Metal Product Manufacturing, 572 jobs
• Furniture and Related Product Manufacturing, 404 jobs
• Wood Product Manufacturing, 333 jobs
• Electrical Equipment, Appliance, and Component Manufacturing, 155 jobs
There were a few subsectors that experienced modest job growth from 2011-2016.
Plastics and Rubber Manufacturing added 63 jobs, followed by Miscellaneous Manufacturing
with an increase of 55 jobs. Those two were also the top two “most competitive” manufacturing
subsectors, when comparing actual job change from 2011-2016 against national and regional
indicators for “expected change”.
The knowledge, skills and abilities for the in-demand occupations below vary widely, and
many do not require the level of expertise that occupations in the healthcare sector demand. For
instance, several healthcare occupations called for higher expertise in the monitoring skillset than
those occupations in the manufacturing skillset. Several of the shared competencies that called
for higher levels of expertise were:
- Knowledge: production and processing, mechanical, engineering and technology,
mathematics, education and training, and design;
- Skills: repairing, equipment maintenance, operation monitoring and critical thinking;
- Abilities: oral comprehension, near vision, visualization, and control precision;
In-demand Occupations Total Projected Average Average
(4-digit SOC codes) Jobs Job Growth Annual Job Hourly
(2016) (2016-2022) Openings Earnings
(2016-2022)
Laborers and Material 953 3% 40 $12.08
Movers, Hand
Credentials: Short-term OJT
Assemblers and Fabricators 446 (-4) % 15 $15.27
Credentials: Moderate OJT
Sales Representatives, 448 6% 18 $24.17
Wholesale and
Manufacturing Credentials: Moderate OJT, Bachelor’s Degree for
Technical and Scientific positions
Industrial Machinery 387 3% 17 $18.14
7Installation, Repair and Credentials: Moderate to Long-term OJT,
Maintenance Workers Apprenticeship, NCCER IM Mechanic Level 1-4 &
NIMS Machining Level 1 (not available in region);
Industrial Maintenance Technician Certifications:
CMRT, Siemens Mechatronics Level 1, OSHA 10
General Industry, MT1, CRC Accreditation, Advanced
Manufacturing Technology Certificate (DLCC)
Machinists 265 10% 17 $16.91
Credentials: Long-term OJT, CNC training with
emphasis on CAD/CAM, NIMS Machining Level 1,
MT1, Siemens Mechatronics Level 1
Welding, Soldering and 251 (-8)% 9 $19.51
Brazing Workers
Credentials: Moderate OJT, AWS Welding
Accreditation, NCCER Welding Levels 1-3 Accreditation
First-Line Supervisors of 228 0% 6 $23.31
Production and Operating
Workers Credentials: Associates Degree and OJT
Production Workers-- 186 1% 8 $14.68
Helpers, Misc. Operators, etc.
Credentials: Short-term OJT
Inspectors, Testers, Sorters, 171 8% 8 $15.96
Samplers, and Weighers
Credentials: OJT, Associates Degree, Some
Postsecondary Credentialing
8Construction
(i) The construction industry in LWDA I has a mixed outlook. As this report was
being prepared, a new data release suggested that the modest growth for construction
from 2016-2021 may instead be a modest decline. However, certain sub-sectors are still
projected for growth from 2016-2021 such as plumbing, heating and air conditioning
contractor companies, water and sewer line construction, roofing contractors, and
painting contractors. Modest employment growth is expected in occupations related to
construction and building maintenance such as electricians, HVAC, and line installers
and repairers.
(ii) Stakeholders reported some growth in this sector as well, and Mountain Empire
Community College just received funding to develop a training program for line
installers and repairers. Many of these in-demand occupations require some
accreditation or apprenticeship training. Major knowledge skill sets include mechanical,
customer and personal service, building and construction, public safety and security,
and mathematics. Other skills important for these occupations are active listening,
critical thinking and coordination. Several of these construction occupations also call
for more refined abilities than found in other industry occupations. For instance, several
of the shared abilities called for higher expertise in:
- Control precision: the ability to quickly and repeatedly adjust the controls of a machine or
a vehicle to exact positions;
- Static strength: the ability to exert maximum muscle force to life, push, pull or carry
objects, and;
- Extent flexibility: the ability to bend, stretch, twist or reach with your body, arms and/or
legs;
(iii) While these abilities do not necessarily need training, when dealing with a potential
workforce, these are skills that should be thought of and addressed.
In-demand Occupations Total Projected Job Average Average
(4-digit SOC codes) Jobs Growth Annual Job Hourly
(2016) (2016-2022) Openings Earnings
(2016-2022)
Construction Laborers 859 3% 34 $12.58
Credentials: Short-Term OJT
Construction Equipment Operators 794 1% 27 $17.82
Credentials: Moderate OJT
First-Line Supervisors of 617 (-3%) 17 $27.19
9Construction Trades and Extraction Credentials: 5+ years of experience in construction
Workers trade
Carpenters 377 (-5%) 11 $11.94
Credentials: Apprenticeship
Electricians 336 5% 16 $20.52
Credentials: Apprenticeship, Certification through
accredited program -- Electrical Wiring Career Studies
Certificate for Journeyman Electricians
Highway Maintenance Workers 230 3% 8 $15.91
Credentials: Short-term OJT
Line Installers and Repairers 179 13% 13 $23.53
Credentials: Long-term OJT, Training/Apprenticeship
recommended (presence of regional program?)
Pipelayers, Plumbers, Pipefitters 168 3% 6 $13.68
and Steamfitters
Credentials: Apprenticeship
Construction Managers 166 (-9%) 4 $26.42
Credentials: Associate Degree and OJT; Bachelors for
some.
Helpers, Construction Trades 125 14% 7 $13.29
Credentials: Short-term OJT
Heating, Air Conditioning, and 116 5% 4 $15.71
Refrigeration Mechanics and
Installers Credentials: Long-term OJT, 2-semester Career Studies
Certificate, EPA HVAC 608 Certification
(iv) Information Technology
In the United States, the information technology industry continues to be an economic
driver nationally making up approximately 7.1 percent of the overall GDP and 11.6 percent of
the total private sector payroll. In 2015, the technology industry added nearly 200,000 net jobs
and now employs more than 6.7 million people.
10There are many ways to examine the technology sector and the Computing Technology
Industry Association (CompTIA) provides one framework for tech sector industries and
occupations, which is used at the state and national level to provide annual tech sector updates.
For industries, the CompTIA sector includes 50 different industry groupings at the six
digit NAICS level. By using those groupings to explore the tech industry in LWDA I, we find a
total employment of 1,370 jobs with an annual earnings of $62,150. The total number of jobs is
50% below the national average in terms of concentration and represents a decline over the past
five years. Projecting forward through 2026, however, the region’s tech industry sector is
expected to increase by 31%, and add over 400 jobs.
Looking at tech sector jobs rather than industries provides another lens with which to
view the region. The sector includes 50 different occupations for a total of 1,322 regional
workers with median hourly earnings of $27.80. The average number of monthly hires from
2011-2016 was 50 workers.
Shared knowledge (hard) skills for IT support workers are computers & electronics,
engineering & technology, customer & personal services, and mathematics. Soft skills include
critical thinking, coordination, monitoring, judgment & decision-making, system analysis,
problem sensitivity, and inductive & deductive reasoning.
In-demand Occupations Total Projected Job Average Average
(4-digit SOC codes) Jobs Growth Annual Job Hourly
(2016) (2016-2022) Openings Earnings
(2016-2022)
IT Support Workers
Computer Support Specialists 236 17% 12 $21.84
Credentials: Some College to Associate’s Degree, Cisco
CCNA Networking Career Studies Certificate, Cyber
Security Career Studies Certificate
Software Developers and 189 34% 17 $31.05
Programmers
Credentials: Bachelor’s Degree
Database and System 140 14% 7 $33.49
Administrators and Network
Architects Credentials: Bachelor’s Degree
Computer and Information Analysts 117 25% 8 $30.83
11Credentials: Bachelor’s Degree, Cisco CCNA
Networking Career Studies Certificate, Cyber Security
Career Studies Certificate
Misc. Media and Communication 114 24% 8 $16.65
Workers
Credentials: Associates Degree and OJT
Computer and Information Systems 42 24% 3 $42.36
Managers
Credentials: Bachelor’s Degree, OJT
Transportation and Warehousing
This sector includes air, rail, and truck-related transportation industries as well as
merchant wholesalers, warehousing and storage, couriers, and other support activities for
transportation. The region has over 400 establishments in these industries. The average earnings
per job is $53,096 in 2016. Over 81% of the 2016 jobs in this sector are held by males. In 2016,
55% of the workers are age 45 or older. By far the largest numbers of workers are drivers.
The age and gender demographics suggest opportunities in this sector for females as well
as for younger workers and workers to replace those aging out of the workforce. National trends
and forecasting reveal long-term challenges and contractions in this sector as automation and
autonomous technology further develops. Nonetheless, there are some near term opportunities
for workers in this sector.
Among the top ten in-demand occupations listed below, drivers with CDL accreditation
are some of the most needed workers according to businesses and workforce stakeholders
interviewed. Most of the other occupations listed, however, do not require much training other
than that received on-the-job. Some top knowledge skills listed for these occupations include
customer and personal service, transportation, and public safety, and security. Some of the more
technical occupations may require a solid knowledge of geography and mathematics. Soft skills
include coordination, active listening, critical thinking, time management, oral comprehension
and expression and written comprehension.
In-demand Occupations Total Projected Job Average Average
(4-digit SOC codes) Jobs Growth Annual Job Hourly
(2016) (2016-2022) Openings Earnings
(2016-2022)
Driver/Sales Workers and Truck 1,927 (-3%) 53 $16.48
Drivers
Credentials: Short-term OJT, CDL Accreditation
12Stock Clerks and Order Fillers 997 4% 41 $12.09
Credentials: Short-term OJT
Laborers and Material Movers, 953 3% 40 $12.08
Hand
Credentials: Short-term OJT
Bus Drivers 554 5% 13 $13.13
Credentials: Short- to Moderate-term OJT, School Bus
Driver Certification through Virginia Board of
Education
Heavy Vehicle and Mobile 284 1% 14 $21.40
Equipment Service Technicians and
Mechanics Credentials: Long-term OJT, Career Studies Certificate
in Automotive Analysis & Repair
Bus and Truck Mechanics and 219 1% 7 $17.29
Diesel Engine Specialists
Credentials: Moderate OJT; Postsecondary certificate.
Industrial Truck and Tractor 181 (-2%) 6 $13.70
Operators
Credentials: Short-term OJT
Shipping, Receiving, and Traffic 157 1% 5 $14.57
Clerks
Credentials: Short-term OJT
Dispatchers 153 5% 7 $14.94
Credentials: Moderate OJT
First-Line Supervisors of 105 2% 5 $24.09
Transportation and Material-
Moving Machine and Vehicle Credentials: Less than 5 years experience
Operators
13Mining and Extraction
Virtually all of Virginia’s coal production (99%) occurs in the LWDA I region. Coal
production and employment have declined steadily in LWDA I since 1990. The number of
mining jobs in the region declined by 2,880, or 43.9%, from 2011 to 2016. Forecasts suggest the
decline will continue due to a combination of factors: lower costs for natural gas related to
technological advances for horizontal shale drilling, national regulatory policy, domestic and
global market competition, and rising costs for mining the region’s deep coal seams. In 2016,
there were 135 establishments in LWDA I related to mining, quarrying, or gas extraction. The
average earnings per job, across all occupations, was $82,067. Over 96% of the jobs in this
sector are filled by males, and 47% of all workers are over age 45.
In mining and extraction occupations, the most called for hard skill is mechanical
knowledge, or familiarity with the machines used in the industry, particularly how to repair and
maintain them. They must know how to monitor these machines and detect any problems that
may occur. Many of these occupations also can for shared abilities. Considering the potential
safety risks in this industry, some top abilities are multi-limb coordination, auditory attention,
and reaction time.
In-demand Occupations Total Projected Job Average Average
(4-digit SOC codes) Jobs Growth Annual Job Hourly
(2016) (2016-2022) Openings Earnings
(2016-2022)
Mining Machine Operators 787 (-9%) 31 $20.45
Credentials: OJT and Apprenticeship
First-Line Supervisors of 617 (-3%) 17 $27.19
Construction and Extraction
Credentials: OJT, Associates Degree
Helpers – Extraction Workers 117 12% 7 $15.71
Credentials: Short-term OJT
Derrick, Drill, and Service Unit 111 (-5%) 8 $26.03
Operators, Oil, Gas, and Mining
Credentials: OJT
Roof Bolters, Mining 75 (-5%) 8 $26.03
Credentials: OJT
14Tourism Related: Accommodation and Food Services; Arts, Entertainment
and Recreation
The region has an abundance of natural and cultural assets, and significant focus has been
placed on supporting entrepreneurial and business activity in the areas of the arts and culture-
based development, outdoor recreation, agriculture, main street entrepreneurship, and other
tourism-related enterprises.
In looking at the two major NAICS industry sectors related to the tourism industry (arts,
entertainment and recreation; and accommodation and food services), the region had 4,451 jobs
in 2016, an increase of 2% since 2011. The average earnings per job are only $15,300,
significantly less than the national average of $25,654. While these workers do not necessarily
require specific training, employers prefer workers with listening comprehension, customer
service and critical thinking skill sets.
In-demand Occupations Total Projected Job Average Average
(4-digit SOC codes) Jobs Growth Annual Job Hourly
(2016) (2016-2022) Openings Earnings
(2016-2022)
Cooks 779 0% 26 $10.44
Credentials: OJT.
Waiters and Waitresses 516 (-1%) 28 $11.97
Credentials: OJT.
Supervisors of Food Preparation 513 4% 20 $13.83
and Serving Workers
Credentials: OJT and Experience
Food Preparation Workers 429 2% 14 $11.02
Credentials:
Food Service Managers 119 13% 6 $14.15
Credentials: OJT and Experience
Musicians, Singers, and Related 117 14% 7 $15.59
Workers
Credentials: Short-term OJT, Some Postsecondary Ed
Artists and Related Workers 95 13% 4 $9.62
15Credentials: Bachelor’s Degree, Moderate to Long-term
OJT
Bill and Account Collectors 483 -6% 12 $16.89
Credentials: Moderate OJT
Loan Interviewers and Clerks 701 -4% 12 $16.89
Credentials: Short-term OJT
Financial Managers 361 3% 11 $55.58
Credentials: Bachelor’s Degree, 5+ years experience
Credit Counselors and Loan 378 1% 8 $31.30
Officers
Credentials: Bachelor’s Degree, Moderate to Long-term
OJT
Securities, Commodities and 168 5% 6 $47.41
Financial Services Sales Agents
Credentials: Bachelor’s Degree, Moderate to Long-term
OJT
Brokerage Clerks 61 8% 3 $20.77
Credentials: Moderate to Long-term OJT
Shared Demand and Administrative Occupations
There are some significant occupations that cut across multiple industries and are not
easily segmented. Many of these are in the administrative support, general management, or
general maintenance and repair areas. This section lists some of the larger occupation groupings
not captured in the above primary and secondary focus sectors.
Skills sets vary widely for this group of occupations. Knowledge skills range from
customer and clerical skills for administrative support careers to mechanical, building and
construction and public safety competencies for maintenance and repair workers. Several of the
soft skills are similar, however, including active listening, critical thinking and problem
sensitivity.
16In-demand Occupations Total Projected Job Average Average
(4-digit SOC codes) Jobs Growth Annual Job Hourly
(2016) (2016-2022) Openings Earnings
(2016-2022)
Office Clerks, General 1,744 2% 52 $13.83
Credentials:
Customer Service Representatives 1,533 9% 70 $12.81
Credentials:
First Line Supervisors of Sales 1,283 6% 44 $14.41
Workers
Credentials:
Secretaries and Administrative 1,179 4% 26 $14.61
Assistants
Credentials:
Bookkeeping, Accounting, and 889 (-1%) 15 $15.43
Auditing Clerks
Credentials: Associates Degree
General and Operations Managers 819 6% 34 $36.72
Credentials: Long-term OJT and some Postsecondary
First-line Supervisors of Office and 724 5% 19 $19.61
Administrative Support Workers
Credentials: Long-term OJT, some Postsecondary
Maintenance and Repair Workers, 581 3% 20 $15.80
General
Credentials: OJT
Miscellaneous Installation, 387 3% 17 $18.14
Maintenance and Repair Workers
Credentials: Short-term to Moderate OJT
17Receptionists and Information 385 5% 16 $12.88
Clerks
Credentials: OJT
Workforce Supply Analysis
The previous section of this report described the labor demand in this region. Labor
supply, or the state of the current labor force, is an equally important factor in considering the
economic future of the region. This labor supply analysis includes statistics on total employment,
unemployment, and underemployment in LWDA I. The analysis also includes data on worker
ages, education levels, and barriers currently faced by the job seekers and workforce.
Collectively, this information provides a picture of the state of the labor supply in the region, and
helps illustrate ways to match labor supply with labor demand moving forward.
Employment, Unemployment and Underemployment
Similar to many regions in the United States, LWDA I experienced significant
employment loss during the Great Recession, though the overall trend was already in decline.
The graph below shows the average employment trend in the region from 2001 to present (black
dotted line), as well as the state and national employment. In 2016, the LWDA I region has
59,050 total jobs, a nearly 9% decrease of 5,523 since 2001. During that same period,
employment in the U.S. and Virginia both increased by about 10%. Projecting through 2026, the
LWDA I is expected to slowly add jobs, but at a much slower rate than the state and nation.
Figure 2: Employment Outlook through 2026
Region 2006 Jobs 2016 Jobs Change % Change
● Region 71,686 62,432 -9,254 -12.9%
● Virginia 4,167,024 4,275,716 108,692 2.6%
18Region 2006 Jobs 2016 Jobs Change % Change
● Nation 150,997,139 157,312,564 6,315,425 4.2%
Source: EMSI Analyst, QCEW 2016.3 Data
The image below shows the concentration of jobs by county in LWDA I. Tazewell
County to the north has approximately 15,700 jobs. Wise County, the next darkest shaded
county, has approximately 12,300 jobs. Buchanan and Russell Counties each have between 5-
8,000 jobs. The lightest blue localities of Lee, Scott, Dickenson, and the city of Norton each
have between 3,500 to 5,200 jobs.
Figure 3: Job Concentration by County
Source: EMSI Analyst, QCEW 2016.3 Data
LWDA I counties continue to experience moderately high unemployment and poverty
rates, particularly when compared to the state and nation. Lee County has a poverty rate in
excess of 25%, followed by Buchanan, Dickenson, and Wise with poverty rates between 15-
20%.
In October 2016, regional unemployment totaled 5,065. The following graph displays
unemployment percentages across all major industry sectors, and compares the region to the
nation. The highest percent of unemployed persons worked in government, followed by retail
trade, and then mining.
19Figure 4: Unemployment Percentages Across Major Industry Sectors
Source: Emsi Analyst, QCEW 2016.3 Data
Underemployment is another aspect to consider when describing the availability of
workforce. During the Great Recession in particular, businesses began hiring workers part-time.
Today, the service industry has become a lead employer of part-time workers. Virginia
Economic Development Partnership tracks underemployed workers, accounting for: discouraged
workers, marginally attached workers, workers who are part-time for economic reasons and not
by choice, multiple job holders, and underutilized workers. Underemployed workers in Area One
account for an additional 11% of workers.
20Figure 5: Unemployment versus Underemployment in Area One
12.0% 11.2% 11.2% 11.2%
10.0% 8.2%
8.0% 7.2%
6.5%
6.0%
4.0%
2.0%
0.0%
Area One LENOWISCO PDC Cumberland PDC
Unemployed Underemployed
Source: Virginia Economic Development Partnership, virginiaallies.org
As Figure 6 shows, Area One has an aging workforce, and fewer possible workers in
younger age groups to take the place of future retiring workers. Meanwhile, labor force
participation is higher among workers ages 20-44, at 66% compared to 49% for ages 45-65.
However, their unemployment rate is also significantly higher, 12% versus 4% unemployment,
which may allow some jobs to be filled as older works retire.
Figure 6: Population, Labor Force, and Unemployment by Age Group in Area One
16 to 19 years
20 to 24 years
25 to 29 years
30 to 34 years
35 to 44 years
45 to 54 years
55 to 59 years
60 to 64 years
- 5,000 10,000 15,000 20,000 25,000 30,000 35,000
Unemployed Labor Force Population
Source: U.S. Census, American Community Survey 2015 5-Year Estimates
Education attainment has increased by at least 9% among younger generations of
workers, particularly with respect to obtaining a high school diploma. Approximately 40 percent
of the region’s population that is 25 year and older have received at least some college. Fifteen
percent of those 25-34 years and those 35-44 years have a bachelor’s degree or higher. That
percentage drops by two percentage points (13%) for those 45-65 years old. A distinct difference
is among the number of women receiving postsecondary education. Mirroring national trends,
21younger women in the region tend to continue to a bachelor’s degree or higher than previous
generations of women. Today, the number of women receiving some college or more is ten
percentage points higher than the number of men receiving some college education or higher.
Figure 7 shows total education attainment numbers and education attainment by gender.
Figure 7: Education Attainment Counts and Gender Breakdown in Area One
Population 25 years and over 146,650
Less than 9th grade 17,894
9th to 12th grade, no diploma 17,949
High school graduate (includes equivalency) 50,660
Some college, no degree 30,553
Associate's degree 11,183
Bachelor's degree 11,892
Graduate or professional degree 6,519
Male Female Less than 9th grade
4% 5% 9th to 12th grade, no
7% 14% 11%
9% diploma
5% High school graduate
12% (includes equivalency)
10% Some college, no
13%
degree
19% Associate's degree
22% Bachelor's degree
31%
38% Graduate or
professional degree
Source: U.S. Census, American Community Survey 2015 5-year Estimates.
In addition to training and education for these workers, several regional stakeholders
have also named other challenges to workforce supply: childcare, transportation and healthcare.
These tertiary challenges prevent workers from obtaining and maintaining full employment. For
instance, a worker who cannot find an affordable, quality daycare for his/her children may need
to be absent repeatedly. Those without reliable transportation, or who cannot afford to repair
their cars, may not even be able to find a job. Finally, several factors including the region’s
economic decline have resulted in a significant number of workers with substance abuse and
mental health (e.g. depression) challenges. Without sufficient access to affordable behavioral
health facilities or groups, these workers are unlikely to find the help they need to maintain a
quality lifestyle and keep a job over the long-term.
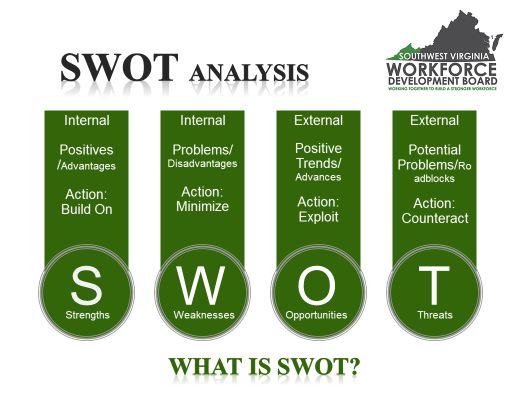
22SWOT Analysis
A SWOT (strengths, weaknesses, opportunities, and threats) analysis is a useful tool to identify
positive situations and tactics that should be continued, areas of concern that should be
addressed, opportunities that should potentially be pursued in the future, and potential threats
that should remain on the radar for planning purposes. As part of the planning process, LWDA I
conducted a SWOT analysis.
LWDA I formed a strategic planning committee and, using the model illustrated above,
conducted a SWOT analysis and surveyed businesses and program participants. A Board retreat
was also held to which partners and CLEO members were invited. The retreat was facilitated by
the Virginia Tech Office of Economic Development, which resulted in some additional
information concerning regional, organizational, and workforce system strengths, weaknesses,
opportunities, and threats. LWDA I looked at them in six distinct domains: people, resources,
ideas, marketing, operations, and finance.
23S
Strengths
Strengths
Southwest Virginia Culture
A key regional strength is the culture and character of the region. Despite economic
hardships, people overall love living in the region and are reluctant to leave. This is closely
related to a relatively high quality of life in terms of natural beauty and access to nature, low
stress lifestyle, and lower costs of living.
Training, Education, & Partnerships
The region’s training providers and higher education institutions are viewed as strengths
and the influx of training and other funding for workforce has led to new program development.
Traditionally, partners in Area One have worked together and have experienced less siloed
effects than is sometimes seen in other regions. This spirit of cooperation was born of necessity-
isolation of the region and lack of resources.
Fortunately, workforce partners tend to work together now more than ever, still partly by
necessity but also because their shared work, over the years, has led to greater partnerships in
funding; regional improvements due to successes; and the resulting realization that more can be
achieved together.
Area One is blessed with two community colleges, Southwest and Mountain Empire,
along with two four-year institutions, UVA Wise and Bluefield College. In addition to these
four institutions of higher education, there are 14 approved training providers available for our
WIOA participants to choose from in order to avail themselves of: Occupational skills training
in an occupation that is locally in demand, skills upgrading, on-the-job training, industry-
recognized credentials, pre-apprenticeship and apprenticeship training, and academic and career
preparation for training.
In addition, the Area now has the services of the Southwest Virginia Advanced
Manufacturing Center of Excellence (SVAMCoE). The two sites are located in Duffield,
Virginia, serving Planning District One, and Bluefield, Virginia, serving Planning District Two.
These training centers are SCHEV-approved and offer credentialing for advanced
manufacturing: AWS certification for advanced welding, NIMS certification for advanced
machining, and Siemens certification for Mechatronics II.
24These education and training resources are more than adequate to address the education
and skill needs of the workforce. Strong partnerships with the community colleges and with
SVAMCoE further enable the SWVAWDB to work with the institutions to develop new
opportunities and pilot projects if a unique demand arises. A case in point is the recent work
with Mountain Empire Community College to develop a specialized on-site welding training
experience for the POWER grant participants in Dickenson County to address the remote
geographic location and lack of transportation of participants. This project also involves a
partnership with SVAMCoE to assess skills at the end of the training, recommend credential
testing or further training, and linkages to employers.
GenEdge Alliance is part of a nationwide network of Manufacturing Extension
Partnership (MEP) centers that are cooperatively affiliated with the National Institute of
Standards and Technology, and the U.S. Department of Commerce. It is a partner, along with
SWVAWDB, in the ARC Heart Economic Transition Project (HEART) and can provide
technical assistance to any of our partnering manufacturing businesses. A more local
counterpart, Manufacturing Technology Council, is available to offer training to manufacturers
in the Area. Most specifically, it provided the Lean Six Sigma training for the entire Incumbent
Worker Grant program and is available for customized training.
A new initiative is underway to link a call-center employer with the welfare-reform
VIEW participants (TANF clients) who are looking for jobs with the SWVAWDB using grant
funding to assist with transportation and pre-employment training. Another custom-designed
initiative for individuals with barriers to employment involves a partnership with Adult Basic
Education’s PIVA project, the WDB and a regional jail. Implementation of the Just Hire One
initiative for reentry participants is scheduled to begin in PY 17. This initiative involves working
one-on-one with employers to engage them to hire one reentry participant with the provision
that, if the placement is successful, they will continue to give such participants a second chance.
Receipt of 6 new grants in the past year has greatly expanded the WDB’s capacity to
provide additional training and supportive services to the region. The Incumbent Worker Grant
has provided 50+ employees with Lean Six Sigma training; the Rapid Response Grant has
offered numerous innovative approaches to serve Dislocated Workers; the Pathways to the
American Dream offers the development of a new portal for distance learning; the POWER grant
provides training and supportive services money for individuals laid off from the coal-related
industries; the ARC HEART grant offers ways to assist the Area’s manufacturers with technical
assistance and supply-chain related expansion opportunities; and the Financial Stability Center
gives us ways to assist participants and businesses with financial issues, financial literacy, credit
repair, debt management, budgeting, etc.
Outreach & Marketing
Workforce and education partners are conducting marketing and outreach in newer and
more innovative ways, with the utilization of social media and more proactive approaches in
reaching out to jobseekers. LWDA I has new leadership and is focusing on board development,
25broadening leadership, and strengthening partner relationships as well as clarifying expectations
and responsibilities.
Business Services
Funding resources have increased significantly, and the LWDA I organizational capacity
is improving and growing as well. LWDA 1 and its partners are also working to engage
businesses more regularly and substantively and the formation of an additional business services
team is one example of this focus.
Area One currently has two business services teams (one in each Planning District), a
Director of Business Services and a part-time Business Coordinator. This unit has developed a
network of businesses and relationships with management that enables it to offer access to on-
the-job training, customized training, Incumbent Worker training, internships/work experience,
layoff assistance, workshops, job fairs, and research/data services in a professional, one-on-one
manner. Additional information about this program is available in the Business Services section
of this Plan.
W
Weaknesses
Weaknesses
Resistant Workforce
Several weaknesses have been identified. Job seekers are sometimes hard to reach, and
reportedly lack some of the soft skills desired by employers, and some struggle with prescription
and illegal drug abuse. The population of workers overall is both declining and aging in the
region, and many younger job seekers may not have the skills to replace retiring workers. For
some students and younger workers, there appears to be a stigma about middle-skills jobs such as
manufacturing or healthcare support jobs, channeling more talented young people to four-year
degrees and toward exiting the region, rather than training in skilled trades that are in high
demand.
Lack of Supportive Services
The region’s support resources such as transportation, childcare, healthcare, affordable
housing, or disability assistance are also reportedly insufficient to deal with demand. Without
reliable access to these needed services, job seekers face significant employment barriers.
26For example, some of the surveyed program participants talked about transportation as the
greatest barrier to overcome. (Please refer to graphic on page 40)
Slow Adapting Businesses
Employers in the region are reportedly slow to adapt to the changing workforce, not
recognizing some of the best ways to attract and retain millennial workers. One example of this
is a reluctance to utilize social media by many employers. Also, on the whole, employers are not
as demanding of credentials from their workforce as other areas of the Commonwealth.
Lack of Communication
In terms of system challenges, some of the weaknesses cited by LWDA 1 stakeholders and staff
included communication among workforce and education partners. While relationships have
improved in some instances in the region, coordination and effectiveness could be even better,
such as more open and regular information sharing and joint program development and problem
solving activities. In some instances, there are duplications of services and activities.
Awareness
Marketing and awareness of workforce resources and services continues to be a
challenge, as well. Despite more use of technology and social media, those efforts are not well
coordinated and targeted marketing and outreach approaches are needed. Even workforce
system and economic development partners have reported a lack of coordination among each
other, and a low awareness of the programs, services, training opportunities, and apprenticeships
that do exist. Some workforce stakeholders have mentioned a lack of purpose or clarity around
workforce and the mission of the WDB.
O
Opportunities
Opportunities
Dedicated Staff
New WDB board and staff members bring new ideas and new resources, and funding has
created opportunities for change and re-organization and service delivery improvement. There
are new opportunities for marketing and public awareness initiatives. Regional economic
development initiatives and planning efforts have raised the profile of workforce development in
the region.
27Partnerships & Regional Initiatives
To address industry threats, there are opportunities for coordination between businesses
and education providers to develop curricula for “sister skill sets,” or skills that can be applied to
a wide range of businesses. This alignment of business needs and education can also serve to
improve soft skill training and education on proper work habits. On a larger scale, there are also
ongoing opportunities to continually enhance quality of life and livability in the region. A high
quality of life can draw workers and businesses to the region, and continue to strengthen the
workforce.
Even more funding and resource opportunities can be explored to enhance stackable and
in-demand credentialing in the region. Best practices employed elsewhere can be used for
inspiration, such as sector partnerships seen in Colorado and Kentucky, career readiness
credentialing in South Carolina, and other examples such as integrated service provision
occurring in Texas. The current statewide focus on workforce also provides significant
opportunities for the Board to effectively fulfill its mission. Healthy partnerships with
neighboring workforce boards, and with the Virginia Board of Workforce Development, also
create great potential
T
Threats
Threats
Declining Population
The trends for ever-increasing automation in the workplace may be leading to fewer jobs
available overall. Job seekers trained in older production methods may face difficulty with job
changes. Declining population and job losses in manufacturing may lead more workers to out-
commute or relocate.
Traditional Mindset
Some job seekers are reluctant to enter training programs and take advantage of
workforce resources. There is a cultural mindset among some people that is reluctant toward
change, and tends toward more traditional practices: “We’ve always done it this way.” Fewer
opportunities for employment overall presents a challenge to training providers who cannot
promise their clients job availability. Widespread migration patterns from rural areas to larger
cities appear to be depleting the size of the workforce available.
28Regulations
Workforce partners also report threats that stem from state and federal-level regulation.
Regulations on workforce training and service provision are reported to be continually changing,
unpredictable, and inflexible, presenting a significant challenge to workforce system partners
seeking to create effective programming and educational opportunities. In some cases, just the
enrollment requirements are so cumbersome that customers gravitate toward other partner
programs rather than dealing with them. Regulations that are shifting and inflexible with WIOA
present a challenge for the Board.
Low Awareness
Low regional awareness of the Board, its responsibilities, and its initiatives also present a
significant challenge for Board members.
Vision and Goals
NAME: Southwest Virginia Workforce Development Board
VISION: “We envision meeting the needs of our businesses and workers by
enhancing skills to create a qualified, career-ready workforce that
reflects the Southwest Virginia values of honesty, dependability, and
resiliency.”
MISSION: “We will build a business-driven, employee-centered workforce system
to support economic diversity and development that will sustain the
quality of life in the region.”
VALUES: We reflect Southwest Virginia’s values of honesty, dependability, and
resiliency.
The SWVAWDB has adopted the following goals, based on data and SWOT analysis, to
move the area’s workforce development system toward the fulfillment of the Mission and Vision
and in consonance with the Combined State Plan.
29You can also read