Open data business models for media industry - Finnish case study - Information Systems Science Master's thesis Tomi Kinnari 2013 - Department of ...
←
→
Page content transcription
If your browser does not render page correctly, please read the page content below
Open data business models for media industry - Finnish
                                   case study

                                   Information Systems Science
                                   Master's thesis
                                   Tomi Kinnari
                                   2013

                                   Department of Information and Service Economy
                                   Aalto University
                                   School of Business

Powered by TCPDF (www.tcpdf.org)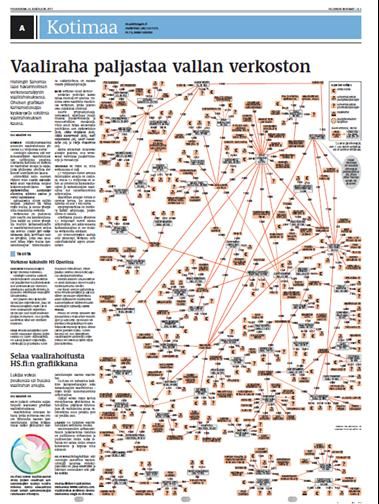
ABSTRACT

Governments and private companies have begun to make vast amounts of data resources
available to the public without usage restrictions, in the form of open data. For example,
Finnish governmental bureaus have made legal documents, statistics, geographical data,
traffic data, and environmental data freely available for public use. These new data sources
have enabled innovative services in several areas, and create a lucrative opportunity for
media companies. Open data can enrich media content, for example, with live data streams,
advanced visualizations, and context and location dependent information.

This thesis identifies opportunities open data provides for media companies by conducting an
extensive field study of the Finnish open data landscape. First, 15 companies pioneering in
open data use are analysed to determine their offering, revenue model and resources, and the
general value network in which they operate. These findings are then considered from the
media company perspective in order to identify opportunities that open data provides for
them.

The open data industry in Finland is still in its early stages, but some commercial success can
already be identified. This study grouped the examined companies into five profiles in an
open data value network: (1) data analysers, (2) data extractors and transformers, (3) user
experience providers, (4) commercial data publishers, and (5) support services and
consultancy. These five profiles are grounded on both; the empirical findings of this study as
well as the theoretical frameworks established by preceding academic papers.

For media companies this research found three opportunity avenues; (1) use open data as a
source in data journalism, (2) gather article ideas and content from the visual and numerical
data analyses conducted by third-party analysers, or (3) achieve costs savings by publishing
private data and using crowds to analyse it or creating user interfaces on top of it.

Keywords: open data, value network analysis, business models, media

                                                                                                1
ABSTRAKTI

Valtion yksiköt ja yksityiset yritykset ovat alkaneet avata omia tietovarantojaan yleisölle
ilman käyttörajoituksia, eli avoimena datana. Esimerkiksi Suomen hallinnolliset virastot ovat
avanneet lakitekstejä, tilastotietoa, maantieteellistä dataa, liikennedataa ja ympäristödataa
vapaasti käytettäväksi. Nämä uudet tietolähteet ovat mahdollistaneet innovatiivisia, uusia
palveluja ja sovelluksia useilla alueilla, ja ne ovat myös houkutteleva mahdollisuus
mediayhtiöille. Avointa dataa voidaan käyttää esimerkiksi mediasisällön rikastamiseen
reaaliaikaisilla datavirroilla, kehittyneillä visualisalisoinneilla tai paikka- ja tilanneriippuvalla
tiedolla.

Tämä tutkielma kartoittaa laajan suomalaisen kenttätutkimuksen avulla mahdollisuuksia, joita
avoin data tarjoaa mediayhtiöille. Aluksi analysoidaan 15 avoimen datan
edelläkävijäyrityksen tarjoama, ansaintamalli ja resurssit sekä yleinen arvoverkko, jossa
yritykset toimivat. Sen jälkeen nämä edelläkävijöiltä kerätyt löydökset tulkitaan
mediayhtiöiden näkökulmasta, jotta voidaan ymmärtää avoimen datan tarjoamat
mahdollisuudet medialle.

Avoimen datan toimiala on Suomessa edelleen varhaisessa vaiheessa, mutta ensimmäisiä
esimerkkejä kaupallisesta menestyksestä on kuitenkin nähtävissä. Tutkielma jaotteli nämä
yritykset viiteen profiiliin, jotka yhdessä muodostavat avoimen tiedon arvoverkon: (1) datan
analysoijat, (2) raakadatan käsittelijät, (3) loppukäyttäjän käyttökokemuksen tarjoajat, (4)
kaupalliset datan avaajat ja (5) tukitoiminnot ja konsultointi. Nämä viisi profiilia pohjautuvat
sekä tässä tutkielmassa tehtyyn kenttätutkimukseen että aikaisempiin akateemisiin tuloksiin.

Medialle tämä tutkielma löysi kolme mahdollisuutta hyödyntää avointa dataa: (1) käyttää
avointa dataa datajournalismin lähteenä, (2) hyödyntää kolmansien osapuolten tekemiä
visuaalisia tai numeerisia analyysejä uusien artikkeleiden innoittajana ja sisältönä tai (3)
tavoitella kustannussäästöjä joukkoistamalla oman tiedon analysointia ja uusien
käyttöliittymien luontia.

Avainsanat: avoin data, arvoverkkoanalyysi, liiketoimintamalli, media

                                                                                                   2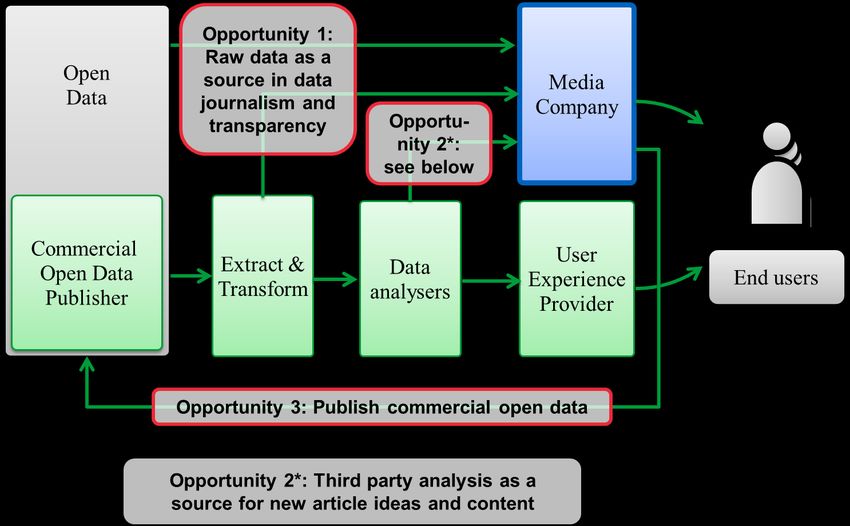
AKNOWLEDGEMENTS

I would like to express my very great appreciation to Matti Rossi for giving me the
opportunity to write this Thesis and for the support and help throughout the research and
writing process. I would also like to offer my sincerest thankfulness for Tekes Next Media
project for providing the financial support to conduct this research. I would also like to thank
Sanoma Oy and Helsinki Region Infoshare for their assistance and help. I am truly indebted
and thankful for the advice and feedback given by Juho Lindman throughout the process. I
owe sincere and earnest thankfulness for all the interviewees, without your helpful comments
and insight this Thesis could not have been done. I wish to thank Hannu Kivijärvi and the
entire Master’s Thesis seminar group for your valuable feedback. I would like to offer my
special thanks to for Virpi Tuunainen, Aalto University School of Business, and Aalto
Service Factory for providing the facilities to write the Thesis. In addition, I am obliged to all
of my colleagues who supported me during the writing process. Finally, I would like to thank
my family and friends for their support and inspiration.

                                                                                                3
TABLE OF CONTENTS
Abstract ....................................................................................................................... 1
Abstrakti ...................................................................................................................... 2
Aknowledgements ....................................................................................................... 3
Table of Tables ........................................................................................................... 7
Table of Figures .......................................................................................................... 7
List of Acronyms and Abbreviations ............................................................................ 8
1. Introduction ............................................................................................................ 9
1.1 Motivation for the research ............................................................................. 9
1.2 Open data as a research topic ...................................................................... 10
1.3 Structure of the study ................................................................................... 13
2. Open data and business models in literature ....................................................... 13
2.1 Open data ..................................................................................................... 13
2.2 Business model elements ............................................................................. 14
2.3 Open data business models in research ...................................................... 15
2.4 Open data definition in this paper ................................................................. 20
2.5 Media definition in this paper ........................................................................ 21
2.6 Economics of the media business ................................................................ 21
2.7 Open data and media business .................................................................... 22
3. Research design .................................................................................................. 24
3.1 Philosophical worldview ................................................................................ 24
3.2 Research question ........................................................................................ 25
3.3 Proposition and purpose of the research ...................................................... 26
3.4 Research strategy ........................................................................................ 26
3.5 Organizing the research fieldwork ................................................................ 28
3.5.1 Selecting the companies.................................................................... 29
3.5.2 Interview process and questions ....................................................... 31
3.6 Estimating the quality of the research design ............................................... 32
3.6.1 Construct validity ............................................................................... 33
3.6.2 External validity ................................................................................. 36
3.6.3 Reliability ........................................................................................... 37
4. Case studies ........................................................................................................ 38
4.1 HSL Reittiopas API ....................................................................................... 39
4.1.1 Description......................................................................................... 39
4.1.2 Analysis: Crowd-sourced client development .................................... 40
4.2 Case Duunitori.fi ........................................................................................... 42
4.2.1 Description......................................................................................... 42
44.2.2 Analysis: Create valuable user experience and monetize with
advertising (two-sided markets) ......................................................... 43
4.3 Case Mitamukaanlennolle.fi.......................................................................... 43
4.3.1 Description......................................................................................... 43
4.3.2 Analysis: Create valuable user experience and monetize with
advertising and licensing ................................................................... 44
4.4 Case pikkuparlamentti.fi ............................................................................... 45
4.4.1 Case description ................................................................................ 45
4.4.2 Analysis: Create valuable user experience and monetize with
advertising ......................................................................................... 45
4.5 Case ReittiGPS and Reitit ............................................................................ 46
4.5.1 Description......................................................................................... 46
4.5.2 Analysis: Create valuable user experience and monetize with one-
time fee .............................................................................................. 47
4.6 Case Hilmappi .............................................................................................. 47
4.6.1 Description......................................................................................... 47
4.6.2 Analysis: Create a valuable user experience and monetize with
annual subscription ............................................................................ 48
4.7 Case Kansanmuisti.fi .................................................................................... 48
4.7.1 Description......................................................................................... 48
4.7.2 Analysis: Create a valuable user experience, and monetize with
crowd-funding .................................................................................... 49
4.8 Case Hahmota Oy Tax-tree .......................................................................... 49
4.8.1 Description......................................................................................... 49
4.8.2 Analysis: Create visualizations and monetize by selling project work 50
4.9 Case Asiakastieto ......................................................................................... 50
4.9.1 Description......................................................................................... 50
4.9.2 Analysis: Algorithm-based analysing ................................................. 51
4.10 Case Cloud’N’Sci .......................................................................................... 52
4.10.1 Description......................................................................................... 52
4.10.2 Analysis: Algorithm-based analysing ................................................. 53
4.11 Case HS Open ............................................................................................. 54
4.11.1 Description......................................................................................... 54
4.11.2 Analysis: Crowd-sourced data analysing ........................................... 56
4.12 Case Louhos ................................................................................................ 57
4.12.1 Description......................................................................................... 57
4.12.2 Analysis: Extract and transform ......................................................... 58
4.13 Case Flo Apps .............................................................................................. 59
4.13.1 Description......................................................................................... 59
4.13.2 Analysis: Consultation and software projects .................................... 60
4.14 Case Logica.................................................................................................. 61
4.14.1 Description......................................................................................... 61
4.14.2 Analysis: Better services with machine-to-machine communication .. 62
4.15 General observations from the interviews..................................................... 63
55. Value network analysis ........................................................................................ 64
5.1 Data analysers .............................................................................................. 65
5.1.1 Data visualizers ................................................................................. 65
5.1.2 Algorithm based analysis ................................................................... 65
5.2 Extract and transform ................................................................................... 66
5.2.1 Extract and transform as integrated part of data analysing ................ 67
5.2.2 Extract & transform as separate business ......................................... 67
5.3 User experience provider.............................................................................. 68
5.4 Commercial open data publishers ................................................................ 69
5.4.1 Co-creation under open license ......................................................... 70
5.4.2 Co-creation under restricted license .................................................. 70
5.5 Support services and consultation ................................................................ 71
5.6 Summary of the value network analysis ....................................................... 72
6. Conclusions for media companies ....................................................................... 74
6.1 Opportunity 1: Raw data as a source in data journalism and transparency .. 76
6.2 Opportunity 2: Third-party created analysis as a source for new content and
article ideas .................................................................................................. 77
6.3 Opportunity 3: Publish commercial open data .............................................. 77
6.3.1 Publish data with no limitations for re-use ......................................... 79
6.3.2 Publish data with limited re-use ......................................................... 80
6.4 Summary ...................................................................................................... 82
6.5 Feedback from the interviewees (feedback round #2) .................................. 83
7. Discussion of the results ...................................................................................... 84
7.1 Theoretical contributions............................................................................... 84
7.2 Limitations of the results ............................................................................... 88
7.3 Future research ............................................................................................ 89
Appendixes ............................................................................................................... 90
References ................................................................................................................ 91
6TABLE OF TABLES
Table 1 List of analysed companies ......................................................................................... 30
Table 2 Case study tactics for the four design tests (COSMOS Corporation, as cited in Yin,
2003) ........................................................................................................................................ 33
Table 3 Different sources of evidence according to Yin (2003, pp. 85-96), and summary of
the evidence utilized in this Thesis .......................................................................................... 34
Table 4 Recapitulation of the value network profiles .............................................................. 73
Table 5 Value network comparison to the previous research .................................................. 85
TABLE OF FIGURES
Figure 1 Data catalogues around the world (Open Government Data Dashboard) ................... 9
Figure 2 Relative search volumes for “open data” in Google search engine. The number 100
represents the peak search volume (Google Trends) ............................................................... 11
Figure 3 Number of academic documents published per year (Web of Knowledge) .............. 12
Figure 4 Business model elements as defined by Rajala (2009) ............................................. 15
Figure 5 Linked data value chain, reproduced from “The Linked Data Value Chain: A
Lightweight Model for Business Engineers “ by Latif et al., 2009, p. 3 ................................. 16
Figure 6 Linked data value chain, reproduced from “Open Data Business Models” by
Tammisto and Lindman, 2011, p. 9 ......................................................................................... 17
Figure 7 Assemblage of open data complementarities, reproduced from “The Roles of
Agency and Artifacts in Assembling Open Data Complementarities” by Kuk and Davies,
2011, p. 11................................................................................................................................ 19
Figure 8 Data hub model adopted from Aitamurto et al. (2011), originally presented by
Kayser-Bril (2011) ................................................................................................................... 24
Figure 9 Research strategy ....................................................................................................... 28
Figure 10 Apps 4 Finland submission screening process ........................................................ 29
Figure 11 Research process ..................................................................................................... 35
Figure 12 An example newspaper article based on crowd-sourced analyzing. Source: HS
Next-blog post (Mäkinen, 10.2.2012) ...................................................................................... 55
Figure 13 Data analysers (profile 1) ........................................................................................ 65
Figure 14 Extract & Transform (profile 2) .............................................................................. 66
Figure 15 User experience provider (profile 3) ....................................................................... 69
Figure 16 Commercial open data publisher (profile 4) ............................................................ 69
Figure 17 Support services and consultation (profile 5) .......................................................... 71
Figure 18 Open data value network from the media context ................................................... 76
Figure 19 Monetizing value of data – limitations applied matrix ............................................ 79
Figure 20 Re-representation of the value network found out in this Thesis ............................ 87
7LIST OF ACRONYMS AND ABBREVIATIONS
A4F Apps 4 Finland (pronounced “apps for Finland”)
API Application programming interface
HTTP Hypertext Transfer Protocol
HS Helsingin Sanomat
M2M Machine-to-machine
RDF Resource Description Framework
URI Uniform Resource Identifier
81. INTRODUCTION
1.1 Motivation for the research
Open data is an ideology where governments and companies place their datasets on the
internet for anyone to use freely. Open data’s promises of increased transparency and
innovative services are attracting developers, managers and business people (Poikola et. al,
2010; Kuk & Davies, 2011). Governments and cities all over the world are considering what
datasets to open, and what effect the opening would have for the society. According to Open
Government Data Dashboard, as of October 5, 2012, there were 268 data catalogues listing
open data resources on country, state and city levels around the world (see Figure 1). These
catalogues help developers to find open data, but how the huge amount of data should be
utilized and what effect does it have to business? Especially, what kind of sustainable
businesses can be built on top of open data?
Figure 1 Data catalogues around the world (Open Government Data Dashboard)
Open data services and applications are largely provided by hobbyists and enthusiasts, who
are working with pro-bono mind-set (Kuk & Davies, 2011, pp. 8-10). It is important that
these services would be operating with viable business model and revenue logic. Without
sustainable business models, these services risk having a shorter life span, which, in the long
run, might endanger the entire open data ecosystem. Therefore, the goal of this paper is to
9conduct a systematic business model analysis in order to understand open data phenomena
from the business model perspective.
The particular research question is how media companies could utilize the benefits of open
data in their business. Media companies are a fascinating research subject because they are
facing several extraordinary transformations in the coming years. For example, decreasing
circulation of newspapers, paywalls in internet news portals, on-demand content streaming
and shifting of advertiser behaviour are just a few of the transformational forces that will be
shaping the industry.
The research question will be answered by first studying open data companies in general,
regardless of their industry, and figuring out the underlying value network and business
model on which they operate. Data for the business model analysis is gathered in the
empirical part of this paper, where 15 pioneer Finnish companies dealing with open data are
examined. These general findings are then reflected from media companies’ perspective in
order to understand their opportunities in the open data sphere. This top-down approach
ensures that open data business opportunities are understood objectively and holistically,
because the phenomenon is first studied in its own right without an interference from industry
specific limitations. Although the conclusions focus on media companies, the general
findings of the empirical part should benefit other industries as well.
1.2 Open data as a research topic
Open data is a popular topic at the moment, and a lot of hype and expectations have been
built around it. The increasing attention towards open data can be witnessed, for example, by
examining search activity in Google Trends. The amount of weekly “open data” searches in
Google search engine is plotted over the past 8 years in Figure 2 below. Eight years is the
maximum time scale Google Trends provides, and no data before this is available. Number
100 represents the peak search volume and number 0 no searches, respectively.
The graph can be interpreted by overlooking the short-time search volume fluctuation, and
focusing on changes in long-term search activity in the yearly average curve (see Figure 2).
First, between 2004 and 2007 the search activity has somewhat declined. Then between 2007
and 2010 it has remained quite constant. After 2010 the search activity has increased almost
in a linear fashion, and coincidentally, the last week included in the sample (the week
10beginning at 23.9.2012) had more search activity than ever before. Overall, the graph
illustrates well how the general awareness of open data has evolved over time.
Figure 2 Relative search volumes for “open data” in Google search engine. The number 100
represents the peak search volume (Google Trends)
Academic interest towards open data can be analyzed by examining the annual number of
published academic records relating to open data (see Figure 3 below). The data was acquired
from Web of Knowledge by counting the amount of annually released documents with “open
data” either in their title or abstract. Since no qualitative evaluation was done, this approach
is prone to ambiguity because the documents might have utilized the phrase “open data” in
another context as well. Regardless of the ambiguity, the graph is still a good general
indicator of the awareness and popularity of the topic in academic research.
According to the figure, the term open data has emerged in academic research in 1996
(Figure 3: “open data” in document abstract). Before 1996 there have been only couple
mentions, but after the year there have been publications released each year. In 2001 the
number of annual documents has slightly increased, but in the year 2006 and after it has
started to grow annually. Out of the documents released in 2011, almost 60 covered open data
in their abstract, and the trend seems to continue growing.
11First documents mentioning open data in their title have been released in 1978, but these old
records have used the term in a different context (Figure 3: “open data” in document title).
Along the years there have been occasional documents published, but the term has not started
to appear constantly until the year 2007. Since then the topic has grown in popularity, and in
2011 20 articles with open data in their title was found from Web of Knowledge.
The rising attention towards open data after the mid-00s correlates also with academic
interest towards linked data (Figure 3: “linked data” in document title). Linked data is a
specific technical form of open data, which was described and made well-known by Tim
Berners-Lee in his Linked data - Design issues (2006) article. After the article was published,
the linked data-related research has apparently skyrocketed. The rising interest towards linked
data might explain some of the attention towards open data and vice versa.
Figure 3 Number of academic documents published per year (Web of Knowledge)
However, when searching records with “open data” in their title and “business” within its
abstract (Figure 3: “open data” in document title and “business” in abstract), only 5
documents were found from Web of Knowledge altogether. For some reason, the business
research has not caught up with the speed of the open data movement yet. This Thesis aims to
start filling the gap of lacking business research of the open data ideology.
121.3 Structure of the study
Chapter 2 conducts a literature study from open data and business model analysis in general.
Chapter 3 introduces the research design including research question, research method, and
organization of the fieldwork. Chapter 3 also introduces methods on how to analyse quality
of the research design. Chapter 4 describes the case studies of the companies under
examination, and iteratively analyses their business models. This chapter establishes the
evidence on top of which the following analysis is founded on. Chapter 5 sketches the
underlying value network in which the companies operate. Chapter 6 answers to the research
question by reflecting the findings from the media companies’ perspective. Chapter 7
finalizes the Thesis with a discussion of the results and introducing topics for future research.
2. OPEN DATA AND BUSINESS MODELS IN LITERATURE
2.1 Open data
Open data is defined by the Open Knowledge Foundation as being accessible as a whole,
free-of-charge or at most with a reasonable reproduction costs, redistributable, reusable, in a
data format which does not cause technological obstacles, and without discrimination against
persons or groups nor against any particular fields of endeavor (Open Definition). This
definition is very popular, and it is utilized e.g. in a landmark Finnish book training to open
up data (Poikola, Kola, & Hintikka, 2010).
In addition to availability and licensing issues, there is also a technical dimension in the data
openness. Tim Berners-Lee in his (2006) World Wide Web Consortium paper outlines the
concept of linked open data. Linked data is constructed to include relations to other linked
data, thus forming a mesh of interrelated data. According to Berners-Lee, in order to create
linked data; the data should use Hypertext Transfer Protocol (HTTP) Uniform Resource
Identifiers (URI) as names for things; it should provide the information in a standardized
technical format, such as Resource Description Framework (RDF); and it should contain
links to other URIs. These universal references to other linked data make it easier to combine
larger sets of data from several different sources together. In 2010 he updated his paper to
include a 5-point starring scheme in order to encourage government data officers to open
their datasets, and perhaps to even compete with their level of data openness.
132.2 Business model elements
There is a wealth of academic papers written about business models over the decades, but still
– or perhaps because of that – there remains some ambiguity around the definition of the
business model concept. For example, Afuah (2004, p. 2) defines business model as a
framework for making money. In more detail “it is the set of activities which a firm performs,
how it performs them, and when it performs them so as to offer its customers benefits they
want and to earn profit” (ibid.). Another definition by Chesbrough and Rosenbloom (2002, p.
532) states that “business model provides a coherent framework that takes technological
characteristics and potentials as inputs, and converts them through customers and markets
into economic outputs”. These are just two of the numerous business model definitions.
Despite the several definitions, a consensus that “business model is a conceptual and
theoretical layer between strategy and business processes” can be generalized (Rajala and
Westerlund, 2007, p. 118).
The business model definition alone, however, does not answer to the question what exactly
should be examined when comparing companies in order to understand what differentiates
them from competition. Osterwalder in his (2004, p. 43) dissertation outlines nine building
blocks under four pillars, which together constitute the business model of a company. Other
authors have had similar views, but with different wording (Rajala and Westerlund, 2007). In
his (2009) dissertation Determinants of Business Model Performance in Software Firms,
Rajala proposes five business model elements based on an extensive literature study of prior
research. These elements are (see also Figure 4):
Offering is a value proposition that a software firm offers its customers and other
stakeholders, and with which it positions itself in the market.
Resources are the assets and capabilities that are needed to develop and implement a
given business model. They can be tangible (personnel, equipment, etc.) or intangible
(brand name, relationships, etc.). In essence, they are the internal source of advantage,
or the core competency of a company.
Relationships are the means to access external resources and capabilities.
Revenue model includes the revenue sources, pricing policy, cost structure, and
revenue velocity. It is the firm’s means to capture value out of its offerings.
14 Management mind-set distinguishes business model as something that stems from
the values, emotions, and attitudes of management; instead of cognitive, rational
thinking and planning.
Figure 4 Business model elements as defined by Rajala (2009)
Based on these elements, Rajala (ibid.) defines business model as
“concise representation of how an interrelated set of elements – the offering,
relationships, resources, revenue model and management mind-set – are addressed
to create and capture value in defined markets“.
Because Rajala’s (ibid.) work is specific to software companies, and because it composes
together a broad perspective from several authors, this Thesis will utilize Rajala’s five
business model elements to analyse and compare the open data companies.
2.3 Open data business models in research
There is some academic work done also from the business models and value chains relating
to open data. Latif et al. in their (2009) conference paper depict a linked data value chain
which has four entities: raw data provider, linked data provider, linked data application
provider and end-user (Figure 5). Raw data provider publishes raw data, linked data producer
utilizes the raw data to produce linked data, and finally the application provider utilizes the
linked data to produce a human readable output for human end-users, respectively. These
15roles are closely connected by three types of data artifacts: raw data, linked data, and human-
readable data. (Latif, Saeed, Hoefler, & Stocker, 2009)
Figure 5 Linked data value chain, reproduced from “The Linked Data Value Chain: A
Lightweight Model for Business Engineers “ by Latif et al., 2009, p. 3
Tammisto and Lindman (2011) researched how data service providers capture value by
conducting an explorative case study interviewing four respondents from three companies.
They utilized the roles proposed by Latif et al. (2009) as a foundation, but found that
consulting was an additional source of revenue for the open data companies (see Figure 6).
Therefore, according to Tammisto and Lindman (2011), the main revenue sources of open
data related activities were open data consulting, transforming the data into linked open data,
and developing applications on top of the data. The data can be published at any stage of the
data development process (see Figure 6). The data development process can also include an
additional stage – “data filtering” – that refers to removing the pieces of data that contain
private or other sensitive information from the datasets before publishing. (Tammisto and
Lindman, 2011)
16Figure 6 Linked data value chain, reproduced from “Open Data Business Models” by
Tammisto and Lindman, 2011, p. 9
Poikola et al. in their (2010) book have a more extensive approach, listing 10 roles in the
open data value chain. Seven of these roles are considered from the data publishing
perspective, and freely translated from Finnish they are: Data recorder, data refiner, data
aggregator, data harmonizer, data updater, data publisher, and registry maintainer. In
addition, they see three end-users for the data: Application developer utilizing the data as part
of his service; data interpreter utilizing data in his research, commercial, or democratic
activities; and finally a human, a company, or an organization as an end-user utilizing these
applications or interpretations.
Compared to Tammisto and Lindman (2011), Poikola et al. have used finer grain in their
value network representation. In addition to the roles mentioned by Tammisto and Lindman,
Poikola mentions also data updater, registry maintainer, data aggregator, data harmonizer,
and data interpreter as an end-user. Some of these roles could be seen to be included in the
Tammisto and Lindman (ibid.) value network as well, depending on the exact definition.
Tammisto and Lindman, on the other hand, pay emphasis on consultancy companies’ role in
the value network as an adviser, especially in the phases relating to data publishing.
Lehtonen in (2011) report Open data in Finland – Public sector perspectives on open data
depicts a process for open data utilization. Lehtonen does not explicitly call this process a
value chain, but in essence the meaning is the same. Lehtonen lists data filtering / data
17mining, data organizing, data visualization, and data interpretation and production as the four
steps in data utilization. This model is in line with the data aggregator, data harmonizer, and
data interpreter roles from the model presented by Poikola et al. (2010). Lehtonen only uses
different names for these activities.
Kuk and Davies in their (2011) research paper studied the role of agency and artifacts in
assembling open data complementarities, where the theory of complementarities suggests that
certain activities, when brought together, are more than the sum of their parts. The research
was conducted by examining hack-day events and their participants’ motivations. One of
their results is the assemblage of open data complementarities (see Figure 7), where the
resulting artifacts create a recursively independent artifact stack. The phases in this artifact
stack are cleaning of data, making the data linkable, writing software to analyse or visualise
the data, sharing the source code of the software in a revision control system such as github,
and finally letting other developers to innovate new services on top of the source code. Kuk
and Davies argue that the open data utilization process has similarities to the one witnessed in
open source projects, but they see some differences as well, especially in the licensing of the
outputs. Whereas open source projects focus on openly licensed output (the source code),
open data hacking focuses on openly licensed input (the data). The output of open data
processing, however, does not necessarily need to be openly licensed. (Kuk & Davies, 2011)
The difference with the approach taken by Kuk and Davies to the previously mentioned
scholars is the emphasis on the uncoordinated co-operation between the agents involved in
the process. This co-operation is organized around the intermediary artifacts (cleaned data,
linkable data, source code, shared source code, and service technologies), each of which
reinforces the value of the previous artifact. (Kuk & Davies, 2011)
18Figure 7 Assemblage of open data complementarities, reproduced from “The Roles of Agency
and Artifacts in Assembling Open Data Complementarities” by Kuk and Davies, 2011, p. 11
Some minor definitional differences and naming conventions aside, the value networks
proposed by Latif et al. (2009), Poikola et al. (2010), Tammisto and Lindman (2011),
Lehtonen (2011), and Kuk and Davies (2011) include similar roles. Poikola et al. (2010) have
described their value network using a greater technical detail, and thus have more elements in
their value chain. Tammisto and Lindman (2011) mentioned the important role of
consultancy within the value network, especially for the open data publishers. Kuk and
Davies (2011) proposed that the value chain elements (complementarities in their language)
are recursively independent and coordinated with help of the intermediary artifacts (see
Figure 7). Compared to the value network established by the previous scholars, Kuk and
Davies (ibid.) add the activity of sharing the source code in a public repository, and letting
other developers innovate on top of it.
This research will utilize the value network profiles established by these authors as a
foundation when interpreting the results from the interviews.
192.4 Open data definition in this paper
The open data definition introduced in Chapter 2.1 is problematic from the perspective of this
paper, because it would outline some case companies out of scope. For example, some of the
case companies scraped data from a website without an explicit legal permission from the
data owner. Many companies seamlessly mashed up commercial and open data together from
several sources in order to create a better user experience. Strictly speaking, these companies
would not be dealing with open data.
However, in some instances this “hacky” usage of the data has helped the data owner to see
the potential of its data re-usage, and ultimately steered the data owners to alter their position
on data re-usage permissions and even to create application programming interfaces (APIs) to
let developers access the data easier. This do-it-yourself or even hacker-type of activism is
very common in the open data community, and since it also has business consequences, it
should be included in this study (Kuk & Davies, 2011). Therefore, despite the contradiction
with (Open Definition), this study considers a broader definition for the open data.
Thus, in this Thesis open data is defined as:
Data, which is accessible through Internet in a machine readable format. It does not
necessary have to be completely free of charge or free or licenses, but it should
allow experimenting with the data, and even running a small-scale-business without
restrictions. Technically the data can be in a linked- or in any other machine
readable format.
Machine readable, in this context, means any format, which is readable by a computer. This
includes, for example, comma-separated values (.csv), Excel spread sheet (.xls), or even PC-
axis (.px) formats. In addition, all websites and text documents are considered machine
readable as well. However, a scanned paper document (.pdf) or any image are not machine
readable, because a computer can only show these files, but cannot easily make sense of its
contents.
This definition is a bit different from the one adapted by Poikola et al. (2010), but it is very
useful in the context of this paper since business consequences of open data are being studied.
202.5 Media definition in this paper
Oxford English Dictionary defines media as “the main means of mass communication, esp.
newspapers, radio, and television, regarded collectively; the reporters, journalists, etc.,
working for organizations engaged in such communication” (Oxford English Dictionary).
According to Denis McQuail (2010, p. 4), mass media and mass communication were coined
in the early twentieth century to describe what was then a new social phenomena of
communicating to many in a short space of time from a distance. The early forms of mass
media (newspapers, magazines, phonogram, cinema, and radio) are still largely recognizable
today, only the scale has increased and more diversification has emerged. (McQuail, 2010)
However, mass media is no longer the only means in society-wide mass communication; they
have been supplemented by a new type of media. McQuail recognizes that Internet and
mobile technologies have establishes an alternative network of mass communication.
McQuail describes this new media being more extensive, less structured, often interactive as
well as private and individualized. (McQuail, 2010)
This document recognizes media as all channels for mass communication, that is, traditional
mass media and new media. Media company is therefore any organization involved in mass
communication through these channels, be it television, radio, newspaper, magazine, social
media, outdoor media, etc.
2.6 Economics of the media business
According to Picard (1989, as cited in Albarran, 2010) a unique aspect of the media industry
is the two separate but interrelated markets that need to be catered: Audience and advertisers.
Albarran (2010) refers this as dual product market, but a more commonly used term would be
two-sided market (Rochet & Tirole, 2003; Parker & Van Alstyne, 2005). The two-sided
market is affecting the revenue models of most media industries. For example, local
broadcast TV, radio, newspapers and magazines all have advertising as their primary income
(Albarran, 2010, p. 42).
Another peculiar aspect of the media industry is strong cross-elasticity of demand. Cross-
elasticity simply means consumers’ tendency to settle for a comparable substitute product in
case their primary choice is not available. For example, if we drive to local movie theatre to
find out that the film we want to see is full, we can either drive back to home or to find
another activity. Many people will buy tickets to another movie, since they already are in the
21theatre. Since there are also many choices for different media content, the cross-elasticity of
demand leads in to fragmentation of the audience in to smaller and smaller segments. The
problem is further magnified with digital platforms, making it even easier for the audience to
choose when and how they consume the content. (Albarran, 2010, p. 41)
Third defining aspect of the media business is the newly emerged multi-platform media
enterprises. The modern horizontally and vertically integrated media enterprises are no longer
restricted to one distribution channel, but instead they deliver the same content through an
array of new platforms including Internet, Video on demand, mobile platforms, and social
media sites. This transition has been driven by a change in audiences’ behaviours including
adoption of new technology and demand for cross-platform services. (Albarran, 2010, pp. 69-
83)
These multi-platform media enterprises utilize similar revenue models as the traditional
media: advertiser-supported, subscriptions, or pay-per-use. In the advertiser-supported model
the content is usually free, but advertisements are placed within the content (Albarran, 2010).
This is a two-sided markets business model, where free content is subsidized with
advertisements (Andersson, 2009). Subscription based model has been recently applied to
Wall Street Journal Online and The New York Times online, and it will be employed to
Helsingin Sanomat online content as well (Albarran, 2010; The New York Times Company,
2011; Helsingin Sanomat, 2012). In the pay-per-use model the user pays only for the obtained
content, such archival content of newspapers or magazines (Albarran, 2010).
In order to ensure cross-media content for the consumers, some media companies have made
strategic alliances with internet ventures including web portals, niche websites and Internet
service providers. In addition, alliances with technology partners such as On2 Technologies
or Akamai Technologies Inc. have become more popular to provide services in broadband
video management and online media content syndication and distribution. (Albarran, 2010,
pp. 69-83)
2.7 Open data and media business
Media companies usually relate open data in to data journalism. Data journalism utilizes
public information sources in enhancing articles and even creating new article ideas. Data
journalism is said to be a “new camera” for the journalists (McCandless, 2012 p. 4) or
“equipping yourself with the tools to analyse it [data] and pick up what’s interesting”
22(Berners-Lee, 2012 p. 6). Data journalism is another way to scrutinize the world, and it is
becoming more and more important as the amount of available data has surged (O’Murchu,
2012, p. 10).
Aitamurto, Sirkkunen and Lehtonen in their Trends in data journalism (2011) report state,
that reporters at US daily newspapers routinely turn to local, state and federal government
websites to hunt for data that they can use in their stories. The journalists see data journalism
as a way to find hidden stories and to increase transparency in the journalistic process.
Aitamurto et al. say that news organizations are searching for sustainable business models to
support data journalism. Many have visions of becoming a number-one data store.
Lehtonen in her (2011) report Open data in Finland – Public sector perspectives on open
data sees that the role of media in the open data ecosystem is to work as a mediator. Media
was seen to gather and filter diverse information, and then winnow out the parts serving the
needs of public. The benefit of open data was seen on the one hand to provide better and
more reliable stories; and on the other hand to improve transparency in journalism,
administration and decision making. In addition, Lehtonen also proposes that media could
open its own data for wider re-use.
The idea of media as a data publisher was taken onwards in the report by Aitamurto et al.
(2011). They describe a data hub model (Figure 8), originally presented by Kayser-Bril
(2011), where the media house collects data from different sources and makes them
accessible to outside end-users, developers and organizations interested in data. The data
should be open for re-use through application programming interfaces. According to an
article by Lorenz, Kayser-Bril, and McGhee (2011), by becoming this hub of data, media
companies would turn themselves into a center of trusted data, able to do complex analysis.
Lorenz et al. propose that instead of “attention market”, media should think themselves to be
at “trust market”.
23Figure 8 Data hub model adopted from Aitamurto et al. (2011), originally presented by Kayser-
Bril (2011)
3. RESEARCH DESIGN
Research design is in a way a blueprint of the research to be done. It deals with four
problems: what questions to study, what data is relevant, what data to collect, and how to
analyse the results (Philliber, Schwab, & Samsloss, 1980, as cited in Yin 2003).
The chapter starts by introducing a general philosophical worldview on which the entire
research is leaning on. Then the chapter continues to define the research question, purpose of
the research, research method, and organization of the empirical fieldwork. Finally, the
chapter establishes a criterion for evaluating the quality of the research design.
3.1 Philosophical worldview
Philosophical worldview, as explained by John W. Creswell in his (2009) book Research
design, is the set of philosophical ideas which are often hidden in research, but still influence
its results. Some call them epistemologies and ontologies, others call them research
paradigms or research methodologies (Creswell, 2009, p.6). Philosophical worldview
represents a distillation of what we think about the world, but cannot prove (Lincoln, &
Guba, 1985).
This Thesis is founded on social constructivism philosophical worldview. The constructivist
philosophy assumes that individuals seek understanding of the world in which they live and
24work. Creswell explains (2009 p.8), that the more open-ended the questioning, the better,
because then the researcher listens to what people say or do in their life setting. Creswell says
that the researcher’s intent is to make sense of (or interpret) the meanings other have about
the world. Rather than starting with a theory, inquirers generate or inductively develop a
theory. The benefit of a constructivist school of thought is the ability to describe and learn
from a real world social phenomenon, without the need to exhaustively understand and model
it. (Creswell, 2009).
In general, the social constructivism belongs to postpositivistic worldview and admits that,
especially in social sciences, there are (1) no ultimate truths to be found and that the (2)
believes of the inquirer always affect to the end-results. Sometimes these two aspects are
intertwined as well; two inquirers with different social and cultural backgrounds observing
the same social phenomena might end up to two different conclusions.
This bias might be caused by prejudice of the inquirer towards his research topic, and it
should be taken into account when designing the research. Since this Thesis is written by one
individual, the risk of biased observations and conclusions is high. Chapter 3.6 will introduce
measures that were taken in order to reduce bias in the research results.
3.2 Research question
The research question of the Thesis is “how media companies can utilize open data in their
business”. The research question is tackled by first studying Finnish open data companies in
general, and then relating these findings to the context of media companies. Thus, first two
sub-questions need to answered:
1) What business models are the open data companies in Finland utilizing?
2) How have the companies utilized the benefits of open data in their business?
In other words, in order to understand the effects of open data phenomenon for the media
industry, the phenomena will be first explored from an overall perspective and the media
viewpoint will be considered after the overall analysis. This wide-to-narrow approach ensures
that wide variety of business models are considered, and then either applied or discarded
depending on their applicability to media business.
An alternative research strategy would have been to start from the media’s current business
practices, and then applying open data thinking within those premises. This research strategy,
25however, is rejected because it might constrain thinking and ignore some more radical
business opportunities. Therefore, the wide-to-narrow explorative strategy is utilized instead.
3.3 Proposition and purpose of the research
Since the research is exploratory in nature, it does not carry any particular hypothesis or
proposition with it. Instead, the Thesis constructively examines what effects the availability
of open data has had to Finnish companies, and tries to report the results as objectively as
possible. The purpose of the Thesis is therefore to first explore the business effects of the
open data phenomenon in general, and then make conclusions from the more specific media
viewpoint.
The only hypothesis, which can be thought of, is that open data has had at least some effect in
the businesses of the companies utilizing it. What exactly this effect has been will be
examined during the fieldwork, and to support objectivity, no hypothesis or propositions of it
will be presented beforehand.
Some questions, which still need to be answered before a case study can be conducted, are a)
how to define the case being studied, b) how to determine the relevant data to be collected,
and c) what should be done with the data once collected. (Yin, 2003)
3.4 Research strategy
Since the research questions are “what” and “how” -type, they are qualitative in nature. They
could be studied with a number of research methods, including experiment, survey, archival
analysis, history, or case study. Because the open data phenomenon is contemporary, only
experiment, survey and case study can be considered. Experiment would require control of
the events, which is not feasible for this study, leaving either survey or case study as proper
research methods. (Yin, 2003)
The research strategy selected for thisThesis is exploratory multiple case study. In his (2003)
book, Case study research, Robert K. Yin explains that case studies are particularly useful
when studying contemporary phenomena, when the investigator has little control over the
events and when “how” or “why” questions are being posed. According to Yin, case studies
are useful in that they offer direct observations of the events being studied, and also
interviews of the persons involved in the events.
26You can also read