Webinar on Digitalization - Group of Experts on National Accounts Organizers: United States and Eurostat - unece
←
→
Page content transcription
If your browser does not render page correctly, please read the page content below
Working paper 3.2
                                                 8 July 2020

Group of Experts on National Accounts
               September 2020

      Webinar on Digitalization
        14 September 2020, 13:30 - 16:30
  Organizers: United States and Eurostat

PRICE AND VOLUME MEASUREMENT OF GOODS
 AND SERVICES AFFECTED BY DIGITALISATION
PRICE AND VOLUME MEASUREMENT                                                            OF        GOODS              AND          SERVICES
AFFECTED BY DIGITALISATION

Introduction

This paper presents a draft guidance note on price and volume measurement of goods and
services affected by digitalisation. Chapter 1 introduces the challenges for the national
accountants, based on concrete examples; chapter 2 describes how to source current price
output data; chapter 3 describes possible options for price deflation of existing assets and
products and for the measurement of digital intermediaries (platforms); chapter 4 proposes
preliminary recommendations on conceptual aspects regarding the treatment of digital
platforms, and chapter 5 reviews methods to address fast-paced price change for e-commerce
products.

Contents
Questions for Review.............................................................................................................................. 4
1. Introduction to the issue ...................................................................................................................... 5
2.     Sourcing current price output data on digital products ................................................................... 8
     2.1.     Existing Material ..................................................................................................................... 8
     2.2.     Options Considered ............................................................................................................... 14
     2.3.     Recommended approach – conceptual aspects ..................................................................... 16
     2.4.     Recommended approach – practical aspects ......................................................................... 17
     2.5.     Changes required to the 2008 SNA and other statistical domains ........................................ 17
3.     Price deflation and volume estimation of existing assets and products ........................................ 19
     3.1.     Existing Material ................................................................................................................... 19
     3.2.     Options Considered ............................................................................................................... 24
     3.3.     Recommended Approach – Conceptual Aspects .................................................................. 32
     3.4.     Recommended Approach – Practical Aspects ...................................................................... 40
     3.5.     Changes required to the 2008 SNA and other statistical domains ........................................ 42
4.     Price deflation and volume estimation of new digital goods, services, and assets ....................... 43
     4.1.     Existing Material ................................................................................................................... 43
     4.2.     Options Considered ............................................................................................................... 48
     4.3.     Recommended Approach – Conceptual Aspects .................................................................. 52
     4.4.     Recommended Approach – Practical Aspects ...................................................................... 53

                                                                                                                                                     2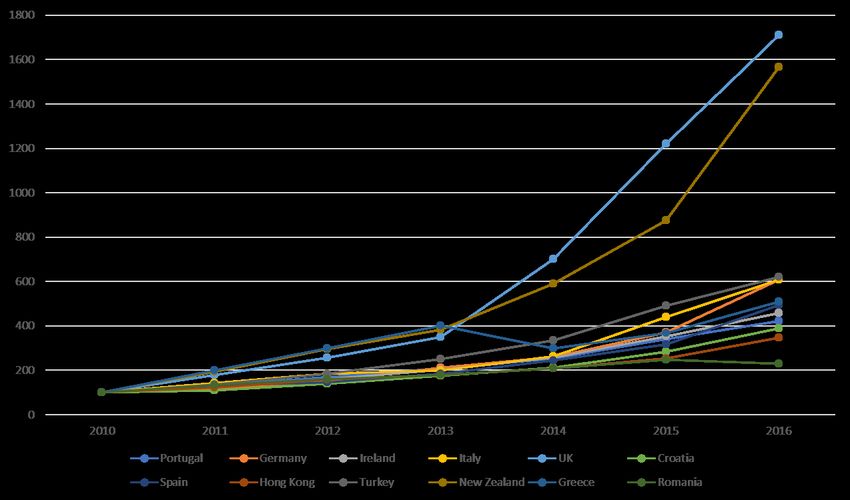
4.5.       Changes required to the 2008 SNA and other statistical domains ........................................ 54
5. Addressing rapid change in e-commerce price data ......................................................................... 55
   5.1.       Existing Material ................................................................................................................... 55
   5.2.       Options Considered ............................................................................................................... 57
   5.3.       Recommended approach – conceptual aspects ..................................................................... 57
   5.4.       Recommended approach – practical aspects ......................................................................... 58
   5.5.       Changes required to the 2008 SNA and other statistical domains ........................................ 58
Annex A: Deflation of existing products .............................................................................................. 59
Annex B: Biases in traditional SPPI approaches .................................................................................. 73
Annex C: Application of Hedonics on broadband by the US Bureau of Labor Statistics .................... 75
Annex D: Classification issues around digital intermediaries .............................................................. 77
Bibliography ......................................................................................................................................... 82

                                                                                                                                                       3
Questions for Review

The following document presents a draft guidance note on the measurement of prices and
volumes which have been affected by digitalisation. In preparing this report the authors have
worked to consolidate the existing research and capture existing and developing consensus.
There remains a number of areas where the authors would be keen to collect additional
information or viewpoints to inform a final draft. These are:
   1. Can any country provide further insights on how they assemble current price data on
      nominal output of digital products which overcomes the challenges of rapid product
      development, and potentially rapid shifts in price and weight in the basket, to feed
      into Chapter 2?
   2. In Section 2.2 we identify three approaches to measure current price data for digital
      products given many platforms and providers of new digital products such as digital
      intermediaries tend to be located in specific territories:
          a. an international organisation or national statistical agency in the territory collect
              the relevant data from them and disseminate via data sharing arrangements to
              other international/supranational organisations or national statistical agencies.
          b. collaborating with specialized third-party market research firms to collect the
              input data and then make the necessary adjustments before using these data for
              compiling national accounts.
          c. Countries could look to domestic estimates with substitute mirror trade data for
              particular categories produced by the host NSO in that territory
      Can anyone provide evidence of the successful application of any of these approaches?
   3. Chapter 3 reviews existing best practice guidance on how to deflate existing well-
      defined goods and services in the national accounts. Any additional sources which
      could augment this chapter would be appreciated.
   4. Section 3.2.7. considers the deflation of databases dependent on the treatment of data.
      Opinions relating to this question, or examples from NSO would be appreciated to
      provide alternatives for the guidance to consider.
   5. Section 3.3.4 provides options and analysis of options for telecommunications services,
      which propose bringing the treatment of this service in line with electricity. Opinions
      on this treatment are requested.
   6. Section 3.5.1 is dependent on decisions reached elsewhere in the digitalisation task-
      team on the treatment of data in the national accounts. Views on this issue should be
      directed accordingly.
   7. In section 4.1.2, we discuss how to treat the instance where one room in a home is
      rented out through Airbnb. Should this room be excluded in the calculation of the
      imputed rental price, or should an adjustment be applied, and does this affect the weight
      of owner-occupied housing in the CPI?
   8. In section 4.1.3, we discuss cloud computing and recommend using quality adjusted
      price indexes to deflate values developed using hedonic models which capture the
      variety of attributes. We would appreciate any information from NSOs which have
      attempted such an approach, or any alternatives.

                                                                                                4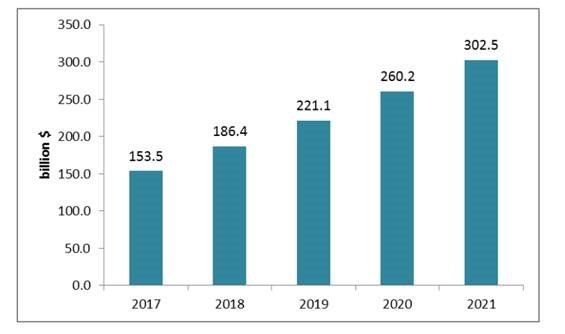
Price and volume measurement of goods and services affected by
digitalisation - draft guidance note

1. Introduction to the issue
Digitalisation, the process of goods and services being delivered in new and innovative ways
utilising digital technology, is having a wide-reaching and deep impact on many parts of the
productive economy and how we measure it.

Digitalisation is the representation of information in bits. This technology has reduced the cost
of storage, computation and transmission of data. 1 However, this is not the end of digital’s
impact. As Schreyer (2019) states, the provider of a digital service such as Facebook or Google
or the consumer herself combines capital or intermediate services from digital services with
household time to produce own-account entertainment or communication services. This
similarly applies to businesses.

Thus, digital goods and services are key to our understanding of how modern economies work,
and therefore we need to consider how best to capture their effect in national accounts. Whilst
the other guidance notes in this series address particular instances of the impact of the digital
economy, and how we measure activity in current price terms, this paper casts a wider net over
how we derive prices, deflators and ultimately volume measures both for these products in the
core and narrow scope, as illustrated below, but also in the broad scope those who are affected
by digitalisation.

Figure One: The ‘digital’ economy using a tiered approach

Source: The Digital Economy Report, 2019, UNCTAD – adapted from Bukht and Heeks, 2017

1
    Goldfarb, Avi and Catherine Tucker. (2017). Digital Economics, NBER Working Paper no. 23684

                                                                                                  5
It should be noted that the SNA does not have a supporting manual which specifically addresses
how best to tackle issues of prices and volumes across the broad sweep of ‘traditional’ goods
and services. This guidance note however, does not inhabit a guidance vacuum: the most
noticeable contribution is Eurostat’s ‘Handbook on prices and volumes measures in national
accounts’ 2, although this rests on four other manuals:
• the ‘Manual on Producer Price Indices’ prepared by the IMF 3,
• the Eurostat-OECD ‘Methodological Guide for Developing Producer Price Indices
for Services’ 4, and
• the ‘Manual on Consumer Price Indices’ prepared by the ILO 5
• the ‘Export and Import Price Index Manual’ prepared by the IMF 6
This guidance note takes these manuals as given, but looks to answer three particular questions
in relation to the specific instance where digitalisation is having a material impact on
measurement of deflators and volumes, and where additional guidance may be beneficial:
• What does ‘best practice’ look like in the context of products which have seen a strong
digital influence?
• For countries which cannot either afford the ‘best practice’, or do not have access to the
necessary data what does ‘acceptable practice’ look like, and
• Given the particular nature of these products, are there current, well-recognised,
practices which are not valid/optimal in this context and which should be avoided, even
if they are entirely suitable in relation to other products?
To navigate this paper, we address the following areas where the impacts of digital in turn:
• Sourcing current price output data on new digital products
• Price deflation and volume estimation of existing assets and products, including
whether the digitally enabled services are the same or different products compared to
their traditional competitors, particularly:
o Telecommunications
o ICT hardware
o ICT software
o Intangible Assets
o Other goods and services of a non-digital nature (e.g. taxi or accommodation
services)
• Price deflation and volume estimation of new digital goods, services, and assets 7,
including:
o Digital intermediaries
2
See https://ec.europa.eu/eurostat/web/products-manuals-and-guidelines/-/KS-GQ-14-005
3
See http://www.imf.org/external/pubs/ft/ppi/2010/manual/ppi.pdf
4
See http://www.oecd.org/publications/eurostat-oecd-methodological-guide-for-developing-producer-
priceindices-for-services-9789264220676-en.htm
5
See https://unstats.un.org/unsd/statcom/51st-session/documents/BG-Item3f-IWG-price-statistics-E.pdf for
2020 draft update by ILO, IMF, UNECE, Eurostat, OECD, and World Bank
6
See https://www.imf.org/external/np/sta/xipim/pdf/xipim.pdf
7
Where these have a non-zero and positive price
6o Cloud computing services
• The challenges presented in rapidly changing price data particularly in non-survey data
This paper excludes from its scope the following:
• New digital products with a zero cash price at the point of delivery, as a parallel paper
is tackling these.
• The finance sector. Whilst this is a sector which is heavily digitalised and has a
multitude of issues relating to measuring prices and volume (FISIM etc), there is a
parallel paper looking at crypto-assets / fintech and other financial matters which is
better placed to consider these issues.
The resolution of the international flow of cloud computing services is considered out of scope as
the ‘Globalisation’ team are better placed to consider this, but the deflation of cloud computing is
addressed below.
72. Sourcing current price output data on digital products
2.1. Existing Material
The ability of digital services to ‘go viral’ raises significant questions about how statisticians
track current price output data, particularly when sales may be through discreet websites / on-
line stores which may be too small, until the product gains rapid market-share to be captured
in a survey, or where the provider may not be domestic. A classic example is the Pokemon Go
phenomenon where sales of a particular computer game devised in one country exploded in a
short time period around the world in 2016, Whilst this individual product would obviously be
grouped within software, this example signposts the key challenges which statisticians
currently face:
• By going from being irrelevant in price collection terms to becoming of noticeably more
significant weight, if only for a short period, there is an obvious question of how to
capture this firm in surveys and how to update weights for aggregation to the whole-
economy level.
• By being sold via ‘appstores’, which themselves might not necessarily be domestic in
nature, it is obvious that the sourcing of data on these rapidly changing sales numbers
is a challenge which requires statistical agencies to actively interact with these
alternative ‘market-makers’. 8
In line with other products, given the preferred method to obtain volume measures of digital
products is by deflating their current-price output by appropriate price indices, it is essential to
discuss how to obtain the current-price output of these products.
2.1.1. Cloud computing – an example
A core example here is cloud computing, where available estimates indicate a dramatic rise in
nominal output, which is forecast to continue; see Figure Two. While there are differences in
the extent to which adoption is taking place across countries, the percentage of businesses that
purchase any cloud services can be above 40% for some countries and is above 20% for the
EU-28 countries, as shown in Figure Three.
As much of cloud computing is an intermediate input to production, it is hard to track in the
statistical system. Specifically, the data do not typically distinguish between cloud services and
traditional services and whether services are produced internally or purchased, or generated at
the “edge” (Byrne, Corrado and Sichel 2018). 9
8
See also the parallel papers from the Globalisation task team.
9
A large increase in the volume of data means that it is not feasible to transmit all of it to the cloud for
processing in real time. Hence, businesses and governments locate the processing and storage data collections
close to internet providers networks, giving rise to the terminology “edge computing”, reflecting this proximity.
This data streamlining solution allows the transmission of only higher-value data to a cloud centre for further
use.
8Figure Two: Global cloud market revenue forecast, 2017-2021.
Source: Gartner (2018). Reproduced from Coyle and Nguyen (2018, p. 3)
It is clear rapid product turnover and increasing product varieties are a feature of cloud
computing services. These features cause measurement problems for even for regular products,
but here there is also an increase in the use of such services, highlighting the need to focus
attention on improving measurement.
Cloud computing services can be thought of as a substitute for investment in computer and
communications hardware by firms, as well as the development of own-account software.
Essentially, fixed capital investment is replaced by the purchase of an intermediate input, cloud
computing services.
There are a diverse range of services provided, which can be categorized into the following
product classes (Byrne, Corrado and Sichel 2018; p. 6):
• Infrastructure as a Service (IaaS) – provides processing, storage, networks, and other
fundamental computing services, where the consumer can deploy and run arbitrary
software, including operating systems as well as applications. The consumer neither
manages nor controls the underlying cloud infrastructure but has control over
operating systems, storage and deployed applications, and possibly some control of
select networking components.
• Platform as a Service (PaaS) – provides ability to deploy consumer-created applications
created using programming languages, libraries, services, and tools. The consumer
neither manages nor controls the underlying cloud infrastructure including network,
servers, operating systems, or storage but has control over the deployed applications
9• Software as a Service (SaaS) – provides the capability of running providers’ application
on a cloud infrastructure. The applications are accessible from various client devices
through either a thin-client interface (e.g. web browser) or a programme interface. The
consumer neither manages nor controls the underlying cloud infrastructure including
network, servers, operating system, storage, or even individual application capabilities,
apart from limited user-specific application configuration settings.
• Function as a Service (FaaS) – Provides the capability of deploying functions (code) on
a cloud infrastructure where an Application Programme Interface (API) gateway
controls all aspect of execution. The consumer (who would be a software developer) no
longer manages nor controls the underlying cloud infrastructure including networks,
servers, operating systems, storage or the computing programme.
Figure Three: Percentage of enterprises that buy any cloud service, comparison by EU
countries, 2015.
Source: Eurostat. Reproduced from Coyle and Nguyen (2018; p. 10).
10There are a huge range of options available to consumers for each of the categories. For
example, Amazon Web Services (AWS) provides a range of services across four regions in the
U.S., with different prices by region. Their services include EC2 – Elastic Compute Cloud
(renting a virtual machine from AWS), RDS – Relational Database Service (renting database
software with a virtual machine) and S3 – Simple Storage Solution (renting hard disk space).
Various services and pricing options are available within each. As an example, Coyle and
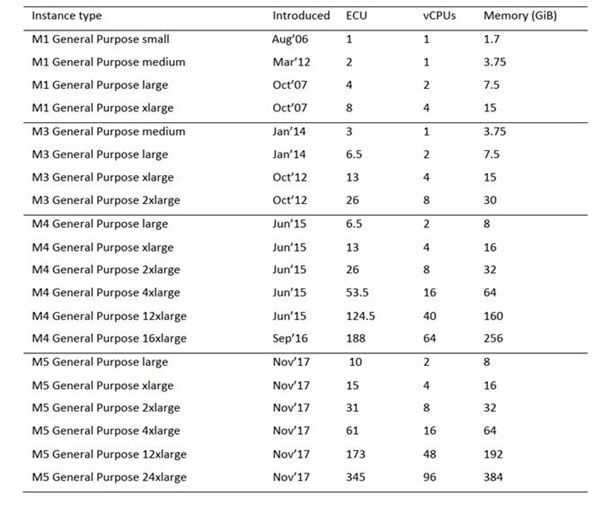
Nguyen (2018, p. 24) provide the information for EC2 compute products from AWS in Table
1, where compute products are called “instances”:
Table 1: Overview of AWS EC2 General Purpose Instance Types
Source: AWS press releases.
AS such it is clear that before we can consider how to effectively tackle prices and volumes, it
is key for statisticians to take care to address how they assemble high quality nominal output
data, or in the absence of this, how they extract sufficient insights from their existing data to
be able to tackle measurement of the digital sector. Examples of country practices are presented
below, together with a discussion of the conceptual and empirical issues which need to be
addressed. Some of the country examples also discuss the methods used to obtain the current-
11price output of new digital products, such as those provided by digital intermediaries. A
proposed strategy to address these issues is also outlined.
2.1.2. United States of America
The US Bureau of Economic Analysis (BEA) 10 has constructed estimates of the US digital
economy within a supply‐use framework following a three step process. First, BEA developed
a conceptual definition of the digital economy. Second, BEA identified specific goods and
services categories within BEA’s supply‐use framework relevant to measuring the digital
economy. Third, BEA used the supply‐use framework to identify the industries responsible for
producing these goods and services, and estimated output, value added, employment and
compensation for these industries. The BEA included in its definition of the digital economy
(1) the digital‐enabling infrastructure needed for a computer network to exist and operate, (2)
the digital transactions that take place using that system (“e‐commerce”), and (3) the content
that digital economy users create and access (“digital media”).
The data sources for the current-price output depend on whether the year in question in a
benchmark year for the input-output tables. In benchmark years, the key data source is the U.S.
Census Bureau’s Economic Census, which is conducted once every five years. In non-
benchmark years, the key data source is the annual surveys that cover selected industries, such
as manufacturing and services.
2.1.3. Australia
The Australian Bureau of Statistics (ABS) has developed preliminary experimental estimates
of digital activity in the Australian economy using the US Bureau of Economic Analysis
approach. Under this approach, digital products were selected from ABS supply-use tables for
three broad digital activities (digital enabling infrastructure, digital media and E-commerce),
after which the industry sources were identified for these digital products.
The current price estimation of the digital activities involved modelling the relevant digital
products; compiling the gross output, intermediate consumption and value added of the digital
activities within the source supply-use industry classifications (SUICs); and aggregating the
estimated inputs and outputs across the industries.
Within some of the selected supply-use product classifications (SUPCs), only certain
components were relevant to the conceptual measurement of digital activities. To ensure
consistency within the established scope, the supply-use gross output of such components were
modelled using other data sources such as ABS input-output table, NAB online retail sales
index (NORSI), retail turnover by industry group and ABS Business Characteristics Survey
(BCS).
Next, the digital activities were estimated in each of the identified primary and secondary
industries. In a particular SUIC, digital gross output was estimated as the sum of the selected
and modelled products. Due to the lack of information on the production processes, the industry
production function for the digital products was assumed to be identical to the “non-digital”
10
See Barefoot et al (2018)
12counterpart. Hence, the associated digital value added was estimated as the total value added
weighted by the share of the estimated digital output in total output. Total intermediate
consumption for the production of the digital products was calculated as the difference between
the digital gross output and digital value added, which was then proportionately split amongst
SUPCs.
Gross output, intermediate consumption and value added by digital activity were estimated as
the sum of the relevant products across the source SUICs. 11
2.1.4. Canada
In 2019, Statistics Canada released the results of a study on the provisional estimates of private
short-term accommodation in Canada. Private short-term accommodation is defined as the
listing and rental of privately-owned dwellings on a short-term basis via an intermediary digital
platform. The input data for the study were acquired from a third-party market research firm
that specializes in providing data analytics for private short-term accommodation rental
platforms. The acquired data included public information, such as the listing type and rental
price, that the firm collects, via web scraping, from various short-term rental platforms. The
third-party firm also provided additional market information, such as estimated occupancy
rates and earned revenue, that they derived using their own proprietary methods. 12 The
experience of Statistics Canada suggests that, besides using traditional surveys, national
statistical offices should explore alternative data sources such as third-party firms to collect
input data to estimate the current-price output of digital products.
2.1.5. Japan
Japan has conducted a study to construct a digital supply and use table (SUT) for 2015 using
the framework for the digital SUT which was developed by the OECD. From the national
benchmark SUTs and input-output tables, the current-price output of industries operating in
the digital economy were identified and estimated.
A number of approaches were used to measure the current-price output of the industries and
products in the digital economy, with each approach dependent on the industry or product
concerned. For digitally enabling industries, the standard SUT (which was constructed using
economic censuses as one of the data sources) was used to identify these industries and the
corresponding current-price output. In the case of e-tailers (i.e., retail establishment with online
sales ratio of 50% or more) and firms dependent on intermediary platforms, economic census
data were used to identify these units using indicators such as the share of Internet transactions
of retailers and share of e-commerce before their current-price output was calculated. The
current-price output of e-tailers was obtained by multiplying their margin rate by their sales
revenue at the most detailed level possible. The current-price output of firms dependent on
intermediary platforms was obtained by summing up the current-price output of the individual
firms. In the case of digital platforms and digital only firms providing finance/insurance
services, additional survey results were used to identify these firms and obtain their
11
More information on the methods used is available from “Measuring digital activity”.
12
More information on the detailed methodology and limitations encountered is available on
https://www150.statcan.gc.ca/n1/pub/13-605-x/2019001/article/00001-eng.pdf.
13corresponding current-price output. In addition, ICT services were split into (1) cloud
computing service (paid), (2) digital intermediary service (paid), and (3) internet-ad space
provision service by dividing and re-organizing Internet-related services. For these services,
the sub-divided Benchmark Make and Use tables were used as the basis for estimation. For the
third service, the ratio of ad revenues estimated from the “basic survey of telecommunication
industry” was used as the basis for estimation. With regard to digital intermediary service
(paid), the amount was based on the report on sharing economy services by the Cabinet Office.
The Japanese experience shows how to some extent the current-price output of the digital
economy can be obtained using existing data sources.
2.2. Options Considered
There are at least three key challenges in tracking and measuring the current-price output of
digital products:
• Most of the businesses which produce digital products have complex and non-
traditional legal structures and business models. This makes classifying the economic
activity and agents very challenging. For example, digital intermediaries perform an
important facilitation process which must be appropriately accounted for within the
SNA. The facilitation activity is distinct from the actual goods or services exchanged
between producers and consumers. As a result, even where the national accounts may
capture the economic activity, care must be taken to ensure it is classified
appropriately.
• There are important questions about where some of the economic agents providing the
final services which may be ‘digitally-enabled’ 13 are located vis-à-vis the production
boundary. Household production of such services would not be identified in traditional
business surveys, but it is an open matter of debate whether such activity should be
captured in the household sector within the national accounts and how best to do this.
Nevertheless, since most of this production is delivered by households engaging in
non-traditional production activities, traditional data sources are likely not picking up
this activity.
• Large proportions of the economic activity are with economic agents in different
countries. For example, most sharing businesses are not incorporated or registered in
the territories where they conduct their business; thus they are classified as non-
residents in the national accounts. As a result, their economic activity is out of scope
of business surveys of the territories in which they operate.
To address the above-mentioned issues, the following strategies can be considered. One, a
typology of digital intermediary platforms may need to be developed to facilitate their
classification and the subsequent development of recommendations on how to classify and
13
That is, have only come into being because the digital market-place has enabled their emergence – this may
cover Airbnb and other ‘room-rental’ models or Uber where households use their domestic car to deliver taxi-
style services
14record their transactions in the national accounts. This is under consideration in the ISIC review
and this guidance will need to be updated to reflect the outcome of this.
Secondly, given the proliferation of household participation in digitally-enabled production
activities (such as Uber or Airbnb), household surveys may need to be expanded to include
questions on household production. Alternatively, if resources permit, special digital economy
surveys such as those conducted by Statistics Canada can be considered 14.
Thirdly, given that many platforms and providers of new digital products such as digital
intermediaries tend to be located in specific territories, it may be most efficient and effective
for the international organisation or national statistical agency in the territory in which the
platform or provider is located to collect the relevant data from them. After that, the
international/supranational organisation or national statistical agency concerned should, if
necessary, adjust the data collected so that they can be used for compiling national accounts
and share these data with other national statistical agencies of countries that consume/import
the digital services. This would require data sharing arrangements between
international/supranational organisation or national statistical agencies to be strengthened and
enhanced. Similar data exchange arrangements are already in place, for example, in Europe for
the EuroGroups Register.
Under this arrangement, Eurostat collects input information on enterprise group members and
on their relationships from the national statistical business registers of EU countries and
participating EFTA countries, and from commercial sources. After consolidation and
validation, the register contains the global structure of the multinational enterprise groups.
National register staff and statistics compilers are given access to all units of the multinational
enterprise groups, if at least one of the group’s units is within their national territory. These
populations can be used for national survey frames.
A practical example to be mentioned is that Eurostat has reached an agreement with Airbnb,
Booking, Expedia Group and Tripadvisor on data sharing. 15 This allows Eurostat to publish
data on short-stay accommodations offered via these platforms across the EU, although it is as
yet uncertain whether this can be extended to current-price output. The intention is to share
with the national statistical institutes the sum of the four platforms, but not confidential
individual data. Agreements on this exchange are currently under preparation. The variables
transmitted will be on occupancy data only, but not prices or values. Nonetheless, such data
sources can be a very useful and consistent basis for further estimates for national accounts
purposes.
As an alternative, national statistical agencies can consider collaborating with specialized third-
party market research firms to collect the input data for digital intermediary platforms and
providers of new digital products and then make the necessary adjustments before using these
data for compiling national accounts. Also, countries could look to substitute mirror trade data
for particular categories with that from other countries (so for example, the UK could use the
14
see https://www150.statcan.gc.ca/n1/daily-quotidien/180829/dq180829b-eng.pdf
15
See press release: https://ec.europa.eu/commission/presscorner/detail/en/ip_20_194
15American estimate of computer game exports to the UK as their measure of imports of this
category of products.) This approach would require countries to be in agreement in the version
of the BPM manual they comply with and detailed agreement around definitions and time
periods which would likely require detailed negotiations but may side-step data-sharing
concerns.
2.3. Recommended approach – conceptual aspects
In principle, a variety of traditional and emerging data sources are available to derive the
current-price output of digital products. These include economic censuses, enterprise surveys,
household surveys, special surveys targeted at specific digital products and web-scrapped data
from relevant third-party data providers. To the extent that these data sources capture
information on locally-produced digital products which were previously not accounted for in
the national accounts, the incorporation of their results in the national accounts will likely result
in an increase in nominal GDP and GNI, or a movement of GVA between industries, or their
trade data.
Databases
In relation to databases there remains as StatCan (2019) explains an outstanding conceptual
question:
‘The 2008 SNA specified that databases should be valued on a sum of costs basis and only
reflect the cost of preparing data in the appropriate format but not the cost of acquiring or
producing the underlying data. In line with business accounting rules, data are considered
non-produced assets and appear residually under goodwill only when a market purchase of a
firm occurs. However, recent growth in the digital economy and in the monetisation of data
holdings by firms has raised concerns regarding the lack of visibility of data in the national
accounts.’
Whilst this means that the cost of labour and capital inputs to create databases, this model fails
to reflect the value of data being incorporated into the database. Data is not currently one of
the traditional categories of intangible assets outside the National Accounts, so can be
considered in isolation from these. This leads to two clear options:
• Revising the method for calculating the value of databases to include the value of the
data incorporated into these databases, or:
• Leaving the method for creating databases as it currently stands, but creating a new
intangible asset, data, which will reflect the value of the data, noting that this data could
be included in multiple databases, sold to third parties or used for product development.
The parallel group on data and free digital services is developing a solution which may affect
the nominal measurement of databases, so this section is pending completion once this decision
is reached.
162.4. Recommended approach – practical aspects
The choice of which data source to use would largely depend on the amount of resources
available to national statistical agencies and whether the units providing the digital products
are within the scope of surveys. Special regular surveys would most likely require more
resources. On the other hand, existing surveys may not be disaggregated enough to directly
capture estimates of digital products and activities. As a result, estimates of digital products
and activities are obtained indirectly using various assumptions. One solution is to consider
expanding the level of detail in existing surveys to get direct estimates of digital products and
activities.
Also, many economic agents providing the digital products are not incorporated or registered
in the territories where they conduct their business. As a result, they may be out of the scope
of the business surveys of the territories in which they operate. One solution is for the
international organisation or national statistical agency in the territory in which the economic
agent is located to collect the relevant data from them for sharing with other data compilers. In
this respect, data sharing arrangements may need to be developed or existing ones enhanced
and strengthened.
2.5. Changes required to the 2008 SNA and other statistical domains
The recommendations in the section are unlikely to require changes to the SNA itself, but can
be viewed as additional supplementary guidance which provides further detail to support the
successful implementation of the SNA, except in one area.
The 2008 SNA explicitly references the recording of data in the context of the discussion on
databases in paragraphs 10.113 (author’s underlining):
10.113 The creation of a database will generally have to be estimated by a sum-of-costs
approach. The cost of the database management system (DBMS) used should not be included
in the costs but be treated as a computer software asset unless it is used under an operating
lease. The cost of preparing data in the appropriate format is included in the cost of the
database but not the cost of acquiring or producing the data. Other costs will include staff time
estimated on the basis of the amount of time spent in developing the database, an estimate of
the capital services of the assets used in developing the database and costs of items used as
intermediate consumption.
However, in the following paragraph where the value of the data acquired is included within
the market value, it is then in scope:
10.114 Databases for sale should be valued at their market price, which includes the value of
the information content. If the value of a software component is available separately, it should
be recorded as the sale of software.”
Dependent on the treatment of databases and data proposed in other papers, this inconsistency
may be addressed.
1718
3. Price deflation and volume estimation of existing assets and
   products

     3.1. Existing Material
The digital economy and digital goods, services and assets are not new phenomena. Large parts
of the productive economy have been employed in and around these activities for a long time
and the SNA and supporting manuals recognise that. The existing SNA approach, and a brief
summary of the extensive research into these issues undertaken in recent years, both within the
economic measurement and academic communities is provided, by topic below:

This section addresses two parallel challenges:
   • Even within existing digital products, such as ICT hardware, software and
       telecommunications, properly accounting for rapid product innovation is difficult,
       particularly if the pace of change has become more rapid. As such, we need to assure
       our existing methods are fit for purpose.
   • Digital goods, services and assets play an increasingly important part in the production,
       retailing, and intermediation of other more traditional goods. It is important to ensure
       estimates of prices and volumes of these products reflect this appropriately.

Digitalisation is important because it has the potential to impact on some specific products in
four ways where general principles may be beneficially articulated / re-articulated:

     • Quality change - The large and fast changes in the quality of the products produced
       and consumed may be hard to identify and capture 16.
    • Outlet substitution bias - Within the existing classification of products almost
       anything could be affected in some way by digitalisation through classic outlet
       substitution effects; on-line consumer prices may differ from ‘bricks and mortar’ prices
       as the logistics, warehousing and commercial property costs of these two business
       models can differ significantly.
    • Customisation – Digitalisation allows products to become more and more customised,
       reflecting the preferences of the consumers, but potentially affecting the homogenous
       nature of the product, and
    • Bundling - The bundling / coming together of products in new combinations (for
       example, mobile phones, torches, bankcards, maps, and pedometers into smart
       phones).
Taking each of these in turn:

3.1.1. Quality change of existing products
When any product changes price this can be for one of two reasons: either this reflects an
upwards movement in the price-level of the same product between two time periods, or because

16
  “The quality of a product is defined by its (physical and non-physical) characteristics. In principle,
whenever a characteristic of a product changes, it is to be considered a different quality of the product.
These changes in characteristics are to be recorded as changes in volume and not as changes in price”
ESA 2010, par. 10.18.

                                                                                                             19
something in the nature, or quality, of the product has changed which causes consumers to
place a different value on the good, reflecting their valuation of the utility they gain from the
product. As such, to construct a price index which measures price change through time, price
statisticians use various methods to strip out quality change to be able to compare prices on a
‘like-for-like’ basis.
Digitalisation has made this more complex because rapid quality change and product
innovation are key characteristics of the digital revolutions. This process has also become more
ubiquitous: no longer do we only see this in laptops, PCs, smartphones and digital camera, this
process increasingly affects all sorts of other goods and services: for example, a fridge which
is now part of the ‘internet of things’ and can communicate with your smartphone to tell you
that you are short on milk and need to buy some. These quality changes raise the following
specific questions:
• Classification of products: Is an ‘internet-connected fridge’ the same product as a
traditional fridge or should it be treated as a different product? Does this depend not
just on the physical attributes of the product but also the price behaviour observed? One
of the interesting aspects of the digital agenda is not where one product is replaced by
a different product, but where two products are becoming the same product – cameras
and mobile telephones both becoming components of mobile telephones. As such, the
treatment of these and how they interact together in terms of deflators is a key question.
This creates a challenge to updating international classifications while preserving
continuity for statistics.
• The applicability of traditional price measurement approaches: Rapid change in
technology goods means it is vital we identify strong methods to control for quality
change, recognising that even well-established methods may have limitations.
o Can hedonic models be produced efficiently as part of routine production: the
variables included in the model, as well as their value might change dramatically
over time? 17
o Does quality change apply equally across all products in the class? Looking to
mobile telephone contracts where quality change is more commonly observed
in more expensive, rather than ‘entry-level’ contracts, this suggests that
countries using a ‘basket of consumers’ approach for this product may
potentially deliver biased results. This approach, using price data for the
cheapest contract which meets the requirements of a set of consumers is likely
to be biased towards entry-level contracts, and therefore under-estimate quality
change and hence over-estimate price change and deflators.
Should such approaches be discouraged for some digital products, and what
alternative methods of adjusting for quality might be considered both more
effective and more pragmatic in terms of delivery?
17
The OECD published a Handbook on Hedonic Indices and Quality Adjustment in Price Indices
(http://www.oecd-ilibrary.org/science-and-technology/handbook-on-hedonic-indexes-and-qualityadjustments-
in-price-indexes_643587187107), in which the technical aspects of hedonics are elaborated
as well as a comparison is made with other quality adjustment methods.
20• When old products become substitutes for one another / become the same product:
One of the key challenges of the digital revolution is that any of the data-driven services
(video, music, telephony, text messaging, email, electronic money transfer etc) which
the national accounts currently record as separate products has the potential to find a
new competitor emerge which can be a virtual identical substitute from a different
product. For example, Skype, which is considered ‘software’ is a perfect substitute for
normal telephony, either using fixed line or satellite technologies. Whatsapp is a perfect
substitute for ‘text’ or SMS messaging, a telecommunications service, but Whatsapp
again is considered an ‘app’ or software product. Both new products are free, therefore
bringing them into the same product would produce clear deflation issues, but this
problem extends to services like Uber and Airbnb. These intermediaries, charging a
different price for a slightly different service which acts as a close substitute for
traditional taxis and hotels, are addressed below.
• Does the value of a digital device (item of ICT hardware) change with the quality
of the apps which can be downloaded onto it? The digital revolution means that many
of the devices which we purchase today (Phone, computer, tablet, television, sat-nav,
smart-watches, ‘Alexa’ style virtual assistants etc) have only a fraction of their
functionality inherent in their make-up 18. The rest of the ‘functionality’ is
purchased/sourced as services which can be accessed via the data which are received
by the device. Should the value placed on the device vary by the quality of the apps
which can be downloaded or should the value of the apps be attributed to the industry
which has created the app? Is value created in these products in a multiplicative rather
than additive model? This issue interacts heavily with the debate on free digital
services, as many of these services are downloadable and usable (at least in a basic
form) without charge.
3.1.2. Outlet substitution bias 19
There is no consensus on how to deal with the outlet substitution bias problem. For example,
in the case of retail outlets, where the problem was first discussed, the intra-agency CPI
manual 20 states:
‘Reinsdorf (1993) estimated the degree of new outlet bias by comparing average prices at
outlets entering and disappearing from US CPI samples. There has been little or no
empirical work, however, on the measurement or consumer valuation of outlet quality such
as product variety, location, car parking, and customer services. As a consequence, there is
little evidence on how to evaluate the accuracy of new outlet bias estimates.’
While statistical agencies incorrectly assign all of the price difference to quality differences,
conceptual exercises that try to assess the magnitude of the bias (like Nakamura et al) assume
18
And even this is potentially more limited than one may immediately imagine – phones beings used as mini-
tablets without phone capability (i.e. without a SIM).
19
See Nakamura, Diewert, Greenlees, Nakamura, and Reinsdorf. (2015). for a recent review of this problem and
the potential biases in indexes obtained from traditional approaches.
20
Para 11.63, Consumer Price Index Manual: Theory and Practice (2004)
By International Labour Office, OECD, International Monetary Fund, The World Bank, The United Nations
Economic Commission for Europe, Statistical Office of the European Communities, Luxembourg
21the polar opposite: they assume that the goods are perfect substitutes (i.e., no quality
difference).
As Dollt & Konijn (2018) explain, for lack of better information, statisticians traditionally
assume most substitution between outlets is regarded as volume change driven by quality
differences. This methodology has often been criticised 21 as new outlets are often cheaper than
the old ones, which is automatically interpreted as meaning that they provide a lower quality
service, rather than a cheaper one. The decline in expenditure caused by shifting to cheaper
outlets is entirely and arguably erroneously treated as a decline in the quality of the services
and thus leads to a reduction of the volume of GDP.
The example of Travel Agents
One example which is frequently discussed (see Bean 2016) relates to travel agencies, which
historically sold travel agency service via physical commercial properties (shops) where this
has moved increasingly into being an on-line activity. There is a question which arises about
whether this reduces the volume of GDP because the household are now undertaking their own
travel agency services through digital devices.
Considering the cost of providing travel agency services as being built up from staff, IT and
property costs. The transition from traditional to digital means has shifted these costs as
follows:
Input Traditional Digital
Labour High Low
IT Capital Low High
Property Capital High Low
Imagine a scenario where the travel agency moves from traditional to digital delivery: it is still
providing the service and the same volume of holidays can be purchased, but the production
cost of the agency / intermediation services are now significantly lower. The impact of
digitalisation in this case is exposed through the price deflator (exposing the improved
efficiency), rather than volume. As such the key implication is that to capture and appropriately
weight the volume of services delivered requires the price deflator to reflect the new outlet /
production technology, noting the key question raised in Eurostat (2018), which is whether the
quality of the two travel agency services are equivalent, or whether consumers receive
additional benefits from interacting with a human? Given the shift observed in the market,
answer appears to be that if there is a benefit it is less than the value of the cost saving in the
eyes of the consumer.
As noted by Dollt and Konijn (2018):
21
See Nakamura et al (2015), which assumes the goods are perfect substitutes, that is there is no quality change
resulting in changes in volume
22‘…through the internet and other technological advances, new or alternative goods and
services can be produced in a more efficient way than their traditional counterparts, i.e. at
lower prices. These new products are often seen by consumers as improvements to the existing
products on offer, at least in some of their characteristics. 22 However, national accounts and
price statistics generally assume that price differences can be taken to equal quality
differences, i.e. a higher price must imply a higher quality. This fundamental assumption seems
less and less appropriate in the modern digital economy.’
This guidance note therefore identifies that in such circumstances, national accountants and
price statisticians need to work in close tandem to ensure price deflators compares like-for-like
transactions so that current price data is appropriately deflated to give the correct volume of
activity. At the heart of this is the requirement to discretely collect data on digital and physical
transactions to capture the different price change and price levels of a common transaction in
both its physical and digital manifestation.
3.1.3. Customisation
All products can be customised in some way (for example, I could put a towbar on my car),
but with digital products the capacity to be customised is often one of the selling points. In this
instance, the product which is purchased has customisable qualities, but these are the same for
all consumers at the point of purchase. How the product is subsequently altered is akin to how
I might treat an apple. I might eat it raw, I might chop it up and put it in a pie, I might use it to
make apple sauce. National Accounts does not have an interest in the customisation of the
apple, and this principle should be extended to digital goods and services.
The key issue in this context, however, is where customisation occurs at the point of purchase,
most obviously seen in customised software. As stated in Bean (2016) 23:
‘….measuring the output and prices of services is inherently more difficult than for goods as,
in contrast to goods, the basic unit of production for services is often hard to define. Services
are frequently tailored to a particular consumer’s requirement and such customisation makes
it hard to compare like with like and thus to construct an appropriate price index.’
3.1.4. Bundling
Bundling, or the selling of multiple products under a single price is a standard problem for
price statisticians. In the case of digital, problems can emerge in the different classifications of
products for consumer and producer price series, particularly where bundles may include both
goods and services. 24
An example is telecommunications: in the UK, for example, both CPI and SPPI measures are
created. However, the CPI product level index captures both goods and services (phones and
phone contracts, despite the product group to be deflated only including services. The CPI and
22
The same item may cost less on, say, Ebay, than in a brick-and-mortar store, but Ebay may provide a better
buyer protection service if there are disputes between the buyer and seller after the sale.
23
Para 2.41
24
For example, a paid subscription to Amazon Prime includes benefits such as free two-day delivery, streaming
music and video, and other benefits. If the price of Amazon Prime were to change, there will be a need to
determine the source(s) of this price change.
23the product group that is deflated are also classified using different systems that do not easily
map 25. The CPI is based on the Classification of Individual Consumption According to Purpose
(COICOP) while the National Accounts product classification is based on the Classification of
Products by Activity (CPA). The SPPI classification is based on CPA. Obviously in such
circumstances it is important for countries to make the best, pragmatic decisions they can to
correctly marry price deflators with the product group to be deflated using standard approaches,
such as identifying standalone smartphone costs to strip these out from the bundle to observe
the value of the contract.
Annex A elaborates on these issues in the context of four key studies on price indexes for digital
goods and services that were recently conducted.
3.2. Options Considered
This section looks to existing goods and services which have been affected by digitalisation.
The following table outlines the headline CPC codes which we will consider
Two Two digit title Detailed CPC class / subclass Digital good / service
digit or Traditional service
CPC affected by
group digitalisation
45 Office, accounting
and computing
machinery
45.2 Computing machinery and parts Digital good / service
and accessories thereof, particularly
45.22 (laptops) and 45.23 (PCs)
47 Radio, television and
communication
equipment and
apparatus
47.215 Digital Cameras Digital good / service
47.222 Telephones for cellular Digital good / service
networks or for other wireless
networks
47.8 Packaged software Digital good / service
61 Wholesale Trade Traditional service
affected by
digitalisation
62 Retail Trade Traditional service
affected by
digitalisation
25
Telecommunications presents particular challenges around bundling of goods and services. Various
accounting bodies have reviewed their accounting rules in recent years with some jurisdictions requiring firms
to separate revenue earned from phones from revenues earned for contract services. See
https://assets.kpmg/content/dam/kpmg/xx/pdf/2016/09/revenue-for-telecoms-issues-in-depth-2016.pdf as an
example. Some regulators also require data to be presented in particular ways.
24You can also read


