Analysis of the Offshore Wind Energy Industry - CREATING THE CLEAN ENERGY ECONOMY
←
→
Page content transcription
If your browser does not render page correctly, please read the page content below
CREATING THE CLEAN ENERGY ECONOMY

Analysis of the
Offshore Wind
Energy Industry
Creating the Clean Energy
Economy
Analysis of the Offshore Wind Energy
Industry

Primary Authors
Jennifer Todd is an Economic Development Associate at IEDC. Jess Chen is a Research Fellow and
a PhD candidate at American University. Frankie Clogston is an IEDC Consultant and a PhD
candidate at Johns Hopkins University.

Primary Editors
Liz Thorstensen, Vice President of Knowledge Management & Economic Development Practice, Tye
Libby, Associate, Knowledge Management and Development

Acknowledgements
IEDC is grateful to the Rockefeller Brothers Fund for its generous support of this research project.

Special thanks Lauren Avioli, Emily Brown, and Patrick McHugh for research support, and Mishka
Parkins, who provided technical assistance for the creative design of the report.

© Copyright 2013 International Economic Development Council

This report was made possible by a grant from the Rockefeller Brothers Fund.
International Economic Development Council
IEDC is the world's largest membership organization serving the economic development
profession, with over 4,500 members, and a network of over 25,000 economic development
professionals and allies. From public to private, rural to urban, and local to international, our
members represent the entire range of economic development experience. IEDC is dedicated to
helping economic developers do their job more effectively and raising the profile of the
profession. When we succeed, our members create more high-quality jobs, develop more vibrant
communities, and generally improve the quality of life in their regions.

The issue of sustainability has been designated a strategic priority by the IEDC Board of
Directors. Further, sustainability and policy responses to climate change are growing issues for our
members. Through a range of services, including: conferences, training courses, webinars,
publications, research and technical assistance efforts, we are striving to be on the cutting edge
of understanding the opportunities and challenges stemming from sustainability, climate change
and economic transformation. For more information about IEDC visit www.iedconline.org

                                         Paul Krutko, FM
                              President and Chief Executive Officer,
                                        Ann Arbor SPARK
                                   Chairman of the IEDC Board

                                     Jay C. Moon, CEcD, FM
                                       President and CEO,
                              Mississippi Manufacturers Association
                           Immediate Past Chairman of the IEDC Board

                                     Jeffrey A. Finkle, CEcD
                                         President & CEO
                           International Economic Development Council

                         International Economic Development Council
                               734 15th Street NW / Suite 900
                                   Washington, DC 20005
             www.iedconline.org | Phone: (202) 223-7800 | Fax: (202) 223-4745
TA B LE O F CO NT E NTS
Introduction to Offshore Wind Energy ....................................................................................................... 4
Job Creation Potential of Offshore Wind Energy............................................................................... 7
The State of the U.S. Offshore Wind Market .................................................................................... 15
Hurdles and Solutions: Offshore Wind Energy Market ........................................................................ 55
Supply Side Issues – How to Overcome High Costs .......................................................................... 56
Demand Side Issues – Finding or “Making” the Market ................................................................... 71
The Regulatory and Policy Environment .............................................................................................. 74
Political Hurdles........................................................................................................................................ 78
Hydroelectricity: Parallels to the Offshore Wind Industry............................................................... 83
Appendix ......................................................................................................................................................... 91
INTERNATIONAL ECONOMIC DEVELOPMENT COUNCIL 3INTR O DU CTIO N T O O FFSH O R E
WIN D E N ER G Y
Offshore wind power offers an inexhaustible energy source and, in the U.S., is located close to
major population centers where demand for energy is highest. To date, this market has been
insufficiently tapped. The U.S. has yet to produce a single megawatt (MW) of energy from an
offshore wind source. The success of the domestic onshore wind industry foreshadows some of the
potential of offshore wind.
This chapter hopes to spur action that will unlock this potential. The first section discusses the
benefits of offshore wind energy in detail as well as hurdles to market development. The final
section proposes tactics that can help overcome these hurdles.
The Importance of Offshore Wind Energy to Economic Development
There is evidence that offshore wind energy will create new jobs and economic investment.
Offshore wind generates more jobs per megawatt than onshore wind and other fossil fuels due to
the labor associated with manufacturing, operating, and servicing the wind farms. As the
European Wind Energy Association (EWEA) states, the offshore wind industry has an “additional
employment effect” due to the higher cost of installing, operating, and maintaining offshore wind
turbines than land-based ones.1
It is also likely that offshore wind job creation will come at a time and to those places where it is
particularly needed. As the U.S. Department of Energy (DOE) indicates, many of the jobs for the
new offshore industry will potentially be located in economically depressed ports and shipyards.
These locations will serve as fabrication and staging areas for manufacture, installation, and
1 European Wind Energy Association. (2009, January). Wind at Work: Wind energy and job creation in the EU, p.
22. Retrieved from:
http://www.ewea.org/fileadmin/ewea_documents/documents/publications/Wind_at_work_FINAL.pdf
INTERNATIONAL ECONOMIC DEVELOPMENT COUNCIL 4maintenance of offshore wind turbines.2 These areas can particularly stand to gain jobs in a new offshore wind industry, since they have experienced a double blow from the downturn in manufacturing and the recent recession. Summary of Hurdles and Solutions The development of offshore wind energy is not without significant hurdles. Hurdles can be grouped under four categories. Supply-side hurdles are related to the high capital, operating, and financing costs of offshore wind projects. This creates a demand-side hurdle in which high costs are passed on to the purchaser of the offshore wind energy, thereby reducing demand. In addition, there are regulatory and policy hurdles due to the lengthy and complicated permitting process for offshore wind projects. Larger political hurdles surround the future of energy policy and government subsidies in the midst of economic recovery. Yet, these hurdles can be tackled over time through a coordinated strategy and action by multiple stakeholders. Section 3 of this report discusses in detail the strategies that economic developers can pursue to engage these stakeholders and kick start the offshore wind energy market. The table below presents a brief summary of the primary hurdles to offshore wind energy and their potential solutions. 2 U.S. Department of Energy. (2011, February). A National Offshore Wind Strategy: Creating an Offshore Wind Energy Industry in the United States, Retrieved from http://www1.eere.energy.gov/windandhydro/pdfs/national_offshore_wind_strategy.pdf. INTERNATIONAL ECONOMIC DEVELOPMENT COUNCIL 5
Hurdles to Development and Solutions

                                                     Regulatory and
     Supply-side              Demand-side                                       Political
                                                         policy

1) Invest in turbine       1) Support “carve-       1) Streamline the      1) Align
    R&D (such as              outs” for offshore        approval process      communication
    incubator)                wind                   2) Improve               strategies
 2) Assist in regional     2) Structure incentives      coordinated        2) Use proactive
    grid planning             in RPS                    review                growth strategies
 3) Identify synergies     3) Provide production 3) Support tax credit        in a recession
    with existing             incentives (i.e. ITC)     programs           3) Engage and
    industries (i.e. oil   4) Establish                                       respond to
    and marine-               government                                      opposition
    based)                    procurement                                     stakeholders
 4) Create stimulus           program                                      4) Public education
    for ship-building                                                         to garner
 5) Support financing                                                         understanding
    streams for                                                               and support for
    investors                                                                 offshore wind
 6) Identify/retool
    existing
    businesses in
    supply chain
 7) Provide
    workforce
    training with local
    partners
 8) Attract FDI and
    forge foreign
    partnerships

INTERNATIONAL ECONOMIC DEVELOPMENT COUNCIL                                                    6
JO B CREATION POTENTIAL OF OFFSHORE WIND ENERGY Table 1 summarizes some of the most widely referenced projections for job growth in the offshore wind industry in Europe and the United States through 2020 and/or through 2030. No doubt, job projection numbers vary and are always being updated. Therefore a primary purpose of Table 1 is to show the range of projections by industry expert, thereby establishing a barometer for the employment potential of the industry and a benchmark for analysis. INTERNATIONAL ECONOMIC DEVELOPMENT COUNCIL 7
Table 1: Economic Development and Job Creation Projections in Europe and the United States
                                                                                                Jobs/         By
             Place                        Source            # of Jobs            Capacity
                                                                                                 MW          Year
    Europe                       EWEA 2009              215,637               300GW           7              2030
    Europe                       EWEA 2011              169,500               40GW            42             2020
    Europe                       EWEA 2011              300,000               150GW           20             2030
                                 Institute for Public
                                 Policy Research
    United Kingdom               2009                   70,000                32GW            22             2020

    United Kingdom               renewableUK 2011       45,000                18GW            25             2020

    United Kingdom               Carbon Trust 2008      40,000-70,000         29GW            14-24          2020
                                 SQW Energy 2008,
                                 Institute for Public
                                 Policy Research
    United Kingdom               2009                   23,000                N/A             N/A            2020
    Germany – North              Various secondary
    Coast                        sources                30,000                12GW            25             2030
                                 Department of
    USA                          Energy 2011            43,000                54GW            8              2030
                                 Department of                                200 MW/yr -
    USA – Atlantic Coast         Energy 2012            1,500-7,500           1GW/yr          N/A            2020
    USA – Mid-Atlantic           IHS Inc./Atlantic
    Region                       Wind Connection        17,000                7 GW            N/A            2026
                                 LEEDCO/Nortech
    Lake Erie, Ohio              2010                   8,000                 5GW             16             2030
    Maine Deepwater              The University of
    Plan                         Maine 2011             7,000-15,000          5GW             14             2030

Sources: 3,4,5,6,7,8,9,10,11,12,13,14,15,16,17

3 European Wind Energy Association. (2009, January). Wind at Work: Wind energy and job creation in the EU.
Retrieved from:
http://www.ewea.org/fileadmin/ewea_documents/documents/publications/Wind_at_work_FINAL.pdf

INTERNATIONAL ECONOMIC DEVELOPMENT COUNCIL                                                                      8
Job Projections by Classification Job creation studies utilize different methods of measurement for jobs and disaggregate jobs into different categories and classifications. The most common measurements and classifications that will be discussed below are as follows: ● Direct/indirect, ● Permanent/temporary, ● Jobs/job-years, and ● Sector/occupation. 4 European Wind Energy Association (2011). Wind in our Sails. Retrieved from European Wind Energy Association website: http://www.ewea.org/fileadmin/ewea_documents/documents/publications/reports/23420_Offshore_report_web.p df 5 Ibid. 6 Bird, Jenny. (2009) Green Jobs: Prospects for Creating Jobs From Offshore Wind in the UK. Institute for Public Policy Research. Retrieved from: http://www.ippr.org/images/media/files/publication/2011/05/green_jobs_1686.pdf 7 Willow, Christopher & Valpy, Bruce. (2011 June). Offshore Wind: Forecasts of future costs and benefits, p. 8. Retrieved from RenewableUK website: http://www.bwea.com/pdf/publications/Offshore_report.pdf 8 Carbon Trust (2008). Offshore wind power: big challenge, big opportunity. London: Carbon Trust. 9 SQW Energy (2008). Today’s investment-tomorrows asset: skills and employment in the Wind, Wave and Tidal Sectors. Report to the British Wind Energy Association. Retrieved from: http://www.bwea.com/pdf/publications/BWEA%20Skills%20Report%20FINAL%2016oct.pdf 10 German Delegate . (2011, January). Ocean Energy: Germany. Ocean Energy Systems: An IEA Technology Initiative. Retrieved from: http://www.ocean-energy-systems.org/country-info/germany/ 11 “Germany OKs Huge Offshore Wind Farms.” (2009, September 21). Bloomberg Businessweek. Retrieved from: http://www.businessweek.com/globalbiz/content/sep2009/gb20090921_980817.htm 12 AFP. (2009, September 16). “Germany paves way to offshore wind farms.” Retrieved from: http://www.google.com/hostednews/afp/article/ALeqM5hq9p69qXzm9itIHk81grGxnV_Kfw 13 .S. Department of Energy, National Renewable Energy Laboratory. Musial, Walter, NREL and Bonnie Ram, Energetics. (2010, September). Large-Scale Offshore Wind Power in the United States: Assessment of Opportunities and Barriers. ( NREL/TP-500-40745). Retrieved from: www.nrel.gov/wind/pdfs/40745.pdf. 14 Hamilton, B., Lantz, E. & Paidipati, J. (2012). Offshore Wind Jobs and Economic Development Potential. National Renewable Energy Laboratory. Retrieved from http://usoffshorewind.org/wp-content/uploads/2012/05/USOWC- Offshore-JEDI-Webinar.pdf 15 IHS Inc. (2012, February). Assessment of the Economic Benefits of Offshore Wind in the Mid-Atlantic [Powerpoint]. Atlantic Grid Development. Retrieved from http://www.atlanticwindconnection.com/ferc/Oct2012/IHS_Study_AWC_EI_Review_MidAtlantic.pdf 16 Elston, Susan et al. (2011, February 23). Offshore Wind Feasibility Study, p. I-3-I-5. University of Maine and James W. Sewall Company. Retrieved from: http://www.deepcwind.org/offshorewindreport 17 Kleinmhenz, Jack and Smith, Russ. (2010, July). The Potential Economic Impacts in Ohio Associated with the Emergence of a Lake Erie Offshore Wind Industry. Retrieved from Nortech website: http://www.nortech.org/images/stories/_pdf/LEEDCo_Economic_Impact_Study_FINAL.pdf. INTERNATIONAL ECONOMIC DEVELOPMENT COUNCIL 9
Direct and Indirect Jobs
It is not always clear if projections of jobs include direct and indirect jobs and how indirect jobs
are measured. The most widely referenced job study (and the one on which U.S. projections are
based) is the 2009 EWEA job projection, which includes direct and indirect jobs.18 In that report,
151,000 jobs are projected for the offshore wind industry in Europe by 2020 and 215,000 by
2030.

However, the 2009 EWEA report only gives a breakdown for the share of indirect and direct
jobs for the wind industry at-large, inclusive of offshore and onshore both in 2007. Of the
151,300 wind industry jobs in 2007, 108,600 jobs (72%) are direct and 42,700 jobs (28%) are
indirect. If it is assumed that the direct-indirect jobs breakdown is similar for offshore wind as for
the entire wind industry, applying the 28% share to the 215,000 jobs projected for Europe by
2030 yields 154,000 direct jobs and 61,000 indirect jobs in offshore wind. The indirect jobs all
come from manufacturing and installation in the EWEA study referenced above and not from
installation, O&M, or other areas.

One could also apply this percentage to job projections in the U.S. However, this extrapolation is
subject to differences between offshore and land-based job demands as well as between Europe
and the U.S. Still, the bottom line is that the U.S. job projection figures, being based on the
European projection from EWEA, may very well include a share of indirect jobs (though this is not
discussed explicitly in the study)

Permanent and Temporary Jobs
The job projections in Table 1 are assumed to be permanent jobs. For example, the 43,000 jobs
projected for the U.S. offshore wind industry by 2030 is explicitly defined as a measure of
permanent jobs. This job projection was based on the EWEA 2009 study, so it is assumed that
likewise the figures for Europe are for permanent jobs.

In the cases where projections are for permanent jobs, there might be an undercount of
employment effects. There could be additional temporary job creation for construction and other

18 European Wind Energy Association. (2009, January). Wind at Work: Wind energy and job creation in the EU.
Retrieved from:
http://www.ewea.org/fileadmin/ewea_documents/documents/publications/Wind_at_work_FINAL.pdf

INTERNATIONAL ECONOMIC DEVELOPMENT COUNCIL                                                                    10
short-term jobs. In fact, the ratio of temporary construction jobs to permanent jobs may be high.
For example, the economic impact study for Cape Wind projects 1,000 jobs during construction
and permanent employment of about 50 people at the Cape Cod-based headquarters to
operate and maintain the wind farm. However, it does not say what the build-out period is for
construction. The study conducted for the Lake Erie project north of Cleveland Ohio projects job
creation over the whole time period from 2012 through 2030, and it shows a peak at 2027. The
maximum jobs throughout the duration of the time period are in construction, however, indicating
that construction jobs extend well beyond initial installation.

Jobs and Job Years
It is also important to note whether or not the figures being quoted refer to jobs or “job years.”
The unit of “job year” refers to one year in one job, so the estimate of 10 job years could mean
10 one-year positions, 5 two-year positions, or 1 ten-year job position. The metric of “job-year”
is becoming more and more widely used when analyzing job projections for future projects. It was
used by the White House in preparing projections for employment that would result from the
2009 ARRA stimulus bill. The effect can be to give the impression of a larger number of
permanent jobs being created than is the actual case. For Table 1, it is assumed that all the job
projections are for jobs and not job-years.19 However, there are some projections for job-years as
well. For example, the U.S. Department of Energy projects 43,000 permanent jobs, or more than
1.1 million job-years, associated with meeting its goal of 54 GW of offshore wind production.20

Jobs by Sector and Skill
Table 2 shows the findings of a study by Carbon Trust for offshore wind job creation in the United
Kingdom. This includes a breakdown of jobs by company type, where employment is listed in
number of jobs and in percentage of total jobs. The high projection of 70,000 jobs for the UK by
2020 is the figure most commonly cited by supporters of the offshore industry. This figure assumes
a “proactive manufacturing strategy” that retains or attracts a large share of turbine and turbine-
component manufacturing in the UK and also transfers a large share of jobs from the oil and gas
industry.

19   http://www.whitehouse.gov/administration/eop/cea/Estimate-of-Job-Creation/
20   Ibid, p. 7.

INTERNATIONAL ECONOMIC DEVELOPMENT COUNCIL                                                      11
Installation and operating and maintenance (O&M) ranks as the second highest source of jobs in
the low projection. O&M includes indirect jobs related to the installation and construction of
turbines, foundations substations, and electrical grid connections. The offshore industry has a
greater supply of jobs required for installation, operation and maintenance than the onshore wind
industry due to the technology and infrastructure associated with operations based in the water.

Manufacturing jobs account for a higher share of employment in onshore wind than for offshore
wind, because O&M for offshore is generally more expensive. In the high scenario, the highest
share of jobs comes from Installation and O&M, which surpasses services. This indicates that
variability in the offshore industry, in terms of employment as well as costs, comes from Installation
and O&M. The study done for the project in the Great Lakes north of Cleveland also produced
similar results.

Table 2: Job Creation by Company Type. Breakdown of Offshore Jobs in the United Kingdom by 2020 by Category

 Company Type                                                           Low Projection         High Projection
 R&D, engineering and design                                            3,000         8%       4,000           6%
 Turbine and component manufacturing                                    7,000         18% 15,000               21%
 Installation and Operations and Maintenance (O&M)                      8,000         20% 29,000               41%
 Services                                                               22,000        55% 22,000               31%
                                                               Total          40,000                  70,000
Source: Carbon Trust21

There are multiple job profiles and occupations associated with each type of company. Table 3
provides a list of representative job profiles based on company type for both the onshore and
offshore wind industries. The list is by no means exhaustive, but does provide a point of reference
for the skills needed.

Europe has experienced a shortage of high-skill workers in the offshore wind industry, such as
engineers and project managers. One of the main bottlenecks in Europe is the shortage of
adequate vessels to service offshore wind farms, and with multiple wind farms scheduled to go
on-line in the short term, this will become more of a problem. The problem is compounded in the

21   Carbon Trust (2008). Offshore wind power: big challenge, big opportunity. P. 74. London: Carbon Trust.

INTERNATIONAL ECONOMIC DEVELOPMENT COUNCIL                                                                          12
U.S., where even the available ships that service Europe may be ineligible to service U.S. wind
farms since they do not comply with the Jones Act (see case study on “Shipbuilding and the Jones
Act”). As a result, there is a major shortage of vessels in the U.S.
Table 3: Representative Company Types and Job Profiles of Offshore Wind Industry
Company Semi- Un-
Field of Activity Skilled Representative Job Profiles
Type Skilled skilled
Planning and Management X Economists, Engineers,
Development Lawyers, Meteorologists
Project managers
Design and Wind Turbine and X X Engineers, Health and Safety
Manufacturing Turbine component Experts Iron Workers, Metal
producers Workers, Millwrights,
Construction Building the Wind X X X Electricians, Engineers, Health
and Farm and Safety Experts, Iron
Installation workers, Marine Operators,
Painters, Pile drivers
Operations Regular Inspection, X X X Crane operators, Electricians,
and Operations and Iron workers, Longshoremen,
Maintenance Repair Marine Operators, Painters
and Repair
Technical, Diverse Specialized X Engineers, Lawyers,
Financial and Professional Meteorologists, Policy
Legal Activities Experts, Programmers,
Expertise Support Staff
Ship Building Specialized, Jones- X X X Engineers, Maritime
and Compliant Vessels Operators, Ship Building
Retrofitting for Construction Trades, Support
Installation/Repair Staff
Source: 22,23
22 European Wind Energy Association. (2009, January). Wind at Work: Wind energy and job creation in the EU.
Retrieved from:
http://www.ewea.org/fileadmin/ewea_documents/documents/publications/Wind_at_work_FINAL.pdf
23 Gerard Dhooge, President, Maritime Trade Council, (personal communication, December 6, 2011)
INTERNATIONAL ECONOMIC DEVELOPMENT COUNCIL 13U.S. Projections in Detail The U.S. Department of Energy estimates that in addition to the 43,000 permanent O&M jobs, the target 54 GW of offshore wind production would require more than 1.1 million job-years to manufacture and install the turbines.24 Reaching the target is also expected to generate an estimated $200 billion in new economic activity.25 This calculation is based on a factor of more than 20 jobs for each MW of new offshore wind, as extrapolated from a EWEA 2009 report.26 However, it should be noted that EWEA has revised its projection for MW, total jobs and jobs per MW by 2030 in its more recent 2011 publication, which could affect U.S. estimates updated in the future. Some individual projects in the U.S. have conducted studies providing job projections. Lake Erie Energy Development Corporation (LEEDCo) is undertaking the development of a 5,000 MW wind farm in the waters north of Cleveland, Ohio. The stakeholders believe it could be a strong generator of jobs, partially due to the existing port infrastructure and supply chain capacities from the area’s onshore wind industry. By the time the wind farm is online, they project that 8,000 jobs will have been created. In Maine, the Deepwater Offshore Wind Plan is projected to generate 7,000 to 15,000 jobs. 24 Ibid, p. 7. 25 U.S. Department of Energy. (2011, February). A National Offshore Wind Strategy: Creating an Offshore Wind Energy Industry in the United States, p. 7. Retrieved from http://www1.eere.energy.gov/windandhydro/pdfs/national_offshore_wind_strategy.pdf on July 20, 2011. 26 Ibid INTERNATIONAL ECONOMIC DEVELOPMENT COUNCIL 14
THE STATE OF THE U.S. OFFSHORE WIND MARKET

Current Market Development: Delayed Takeoff
The offshore wind industry in the United States is in the developmental stages. Projects are not yet
“in the water” (under construction) nor are they “on-line” (producing energy output). Some date
the emergence of the U.S. industry to November 15, 2001, when Cape Wind Associates filed its
first permit application for an offshore wind project off the coast of Cape Cod, Massachusetts. In
October 2010, Cape Wind received its lease from the federal government—another important
milestone in the development of the industry. As of mid 2013, Cape Wind is currently in the
project financing phase, with construction slated to begin at the end of the year.

But the process of development has continued to be frustrating for wind-farm developers,
economic developers, clean energy advocates, and a host of stakeholders in the industry. While
offshore wind generates energy in Europe and China, it has yet to be generated off U.S. coastal
waters, despite a growing demand for clean energy, a strong supply of wind resources, and a
line of projects in the pipeline. Development has been hampered by high capital costs, permitting,
financing, policy, and the inability to find buyers for the energy, which is priced high above fossil
fuels and other clean energies. Perhaps the most urgent hurdle is procurement, as there is a noted
disconnect between the lease-sale process and the market process. Still, stakeholders remain
vested in various attempts to create and stabilize conditions for takeoff. If the domestic land-
based industry is any example, the U.S. has the potential to lead the world in offshore wind as
well.

Based on examples from Europe and assessments of opportunity in the U.S., the offshore wind
industry has the potential to bring in substantial jobs and investment. 27, 28, 29, 30 It is projected to

27 U.S. Department of Energy, National Renewable Energy Laboratory. Musial, Walter, NREL and Bonnie Ram,
Energetics. (2010, September). Large-Scale Offshore Wind Power in the United States: Assessment of Opportunities
and Barriers. ( NREL/TP-500-40745). Retrieved from www.nrel.gov/wind/pdfs/40745.pdf on July 20, 2011
28 Pollin, Robert, Heintz, James and Heidi Garrett-Peltier. (2009, June). The Economic Benefits of Investing in Clean

Energy: How the Economic stimulus program and new legislation can boost U.S. economic growth and investment.
Retrieved from Political Economy Research Institute website:
http://www.peri.umass.edu/fileadmin/pdf/other_publication_types/green_economics/economic_benefits/economic_
benefits.PDF

INTERNATIONAL ECONOMIC DEVELOPMENT COUNCIL                                                                        15
create more jobs than onshore wind per unit of energy production, due to the higher costs of
manufacturing and maintaining a wind farm in a marine environment. Further, in the long term,
offshore wind represents an even more productive and constant clean energy source. Winds from
off the coast blow more strongly and steady than land-based winds. The following sections
examine the offshore wind market in more detail.

Factors Influencing the Growth of U.S. Market
Demand-Side Factors: Economic, Security, and Environmental
Despite a lack of offshore wind power currently online, the federal government has an ambitious
goal. Under President George W. Bush, the Department of Energy set a “20% Wind Energy by
2030” goal in July 2008.31 President Obama has reiterated this goal.32 The Department of
Energy’s 20% Wind Energy by 2030 report provided a scenario under which the U.S. would
generate 20% of its electricity from wind with offshore wind contributing 54 GW (54,000
MW).33 In order to meet this goal for offshore wind, the Department of Energy has detailed an
“OSWInD” strategy for offshore wind. The strategy calls for an interim deployment of 10GW of
capacity by 2020 at a cost of energy of $0.10/kWh en route to meeting the total production
goal of 54GW by 2030 at a cost of $0.07kWh.34

Offshore wind farms could provide a significant energy source to meet the energy demands of
population centers up and down the Atlantic seaboard. The U.S. Energy Information
Administration (EIA) projected electricity consumption to grow at a rate of 1.1%.35 Most domestic

29 Kleinhenz & Associates. (2010, July). The Potential Economic Impacts in Ohio Associated with the Emergence of a Lake
Erie Offshore Wind Industry. Retrieved from:
http://www.nortech.org/images/stories/_pdf/LEEDCo_Economic_Impact_Study_FINAL.pdf.
30 European Wind Energy Association (2007, December). Delivering Offshore Wind Power in Europe. Retrieved from:

http://www.ewea.org/fileadmin/ewea_documents/images/publications/offshore_report/ewea-offshore_report.pdf.
31 U.S. Department of Energy, National Renewable Energy Laboratory. (2008, July) 20% Wind Energy by 2030:

Increasing Wind Energy’s Contribution to U.S. Electricity Supply. (NREL/TP-500-41869). Retrieved from:
http://www.nrel.gov/docs/fy08osti/41869.pdf.
32 White House Office of the Press Secretary. (2011, January 25). Remarks by the President in 2011 State of the

Union Address. Retrieved from White House website: www.whitehouse.gov/the-press-office/2011/01/25/remarks-
president-state-union-address/
33 U.S. Department of Energy. (2011, February). A National Offshore Wind Strategy: Creating an Offshore Wind

Energy Industry in the United States, Retrieved from
http://www1.eere.energy.gov/windandhydro/pdfs/national_offshore_wind_strategy.pdf.
34 Ibid, p. iii.
35 US Offshore Wind Collaborative. (2009, October). U.S. Offshore Wind Energy: A Path Forward. Retrieved from:

http://www.usowc.org/

INTERNATIONAL ECONOMIC DEVELOPMENT COUNCIL                                                                          16
energy consumption occurs in the 26 states that have high coastal winds, including the dense
region of the Northeast.36

Clean energy sources, including offshore wind, are oftentimes more expensive per energy unit
than fossil fuels. Fluctuating commodity prices, supply chain inefficiencies, and a trend toward
larger and larger turbines are currently pushing up offshore wind costs in places like Europe.
Utilities and the consumers that they serve demand cheap energy sources and oppose increases to
their utility bills. As a result, states have found they must play a role in the market and mandate
that utilities produce a percentage of their energy from clean energy sources through the
introduction of renewable production standards (RPS). Offshore wind is an attractive alternative
particularly for regions like the Northeast. The Northeast does not have as plentiful a supply of
solar energy as other regions of the country, and it also may face obstacles to land-based wind
development, such as a lack of open land for new transmission lines.

However, RPS’s may not be sufficient to develop offshore wind due to the high costs of
development.37 States are exploring added incentives targeted at offshore wind such as “carve-
outs” and RPS multipliers (see discussion in Policy Tools section.)

Supply-Side Factors: Ample but Constrained
The U.S. absence from the offshore wind market is striking considering that in 2008 and 2009, it
was the top worldwide producer of onshore wind energy (losing the top spot to China in 2010.)38
By the end of 2010, the U.S. onshore wind industry had reached 40,181 MW of total installed
capacity with projects located in 38 states.39 The U.S. onshore wind industry has a far-reaching
supply of businesses and workers, including 400 manufacturing facilities employing about 20,000

36 U.S. Department of Energy, National Renewable Energy Laboratory. Musial, Walter, NREL and Bonnie Ram,
Energetics. (2010, September). Large-Scale Offshore Wind Power in the United States: Assessment of Opportunities
and Barriers, p. 2. ( NREL/TP-500-40745). Retrieved from www.nrel.gov/wind/pdfs/40745.pdf on July 20, 2011
37 Inwood, S. (2011, June). Program on Technology Innovation: Integrated Generation Technology Options, pp. I-11,

Retrieved from Electric Power Research Institute website: http://rfflibrary.wordpress.com/2011/07/30/program-
on-technology-innovation-integrated-generation-technology-options/.
38 Asmus, Peter. (2011, June 1). Which State Will Lead With First Installed Offshore Wind Project in the U.S.? Pike

Research Blog Articles: Retrieved from http://www.pikeresearch.com/blog/articles/which-state-will-lead-with-first-
installed-offshore-wind-project-in-the-u-s.
39 AWEA. (2011). AWEA U.S. Wind Industry Annual Market Report. Forward.

INTERNATIONAL ECONOMIC DEVELOPMENT COUNCIL                                                                        17
workers.40, 41 Additionally, about 50 percent of the content for turbines installed on U.S. soil is from
domestic suppliers, though some sources have indicated that this percentage has declined.42

The strong position of the U.S. in the onshore wind market should help with development of the
offshore wind industry. One advantage is that the industries share many of the same businesses in
their supply chains. This is particularly true for the Great Lakes and Gulf Coast regions, where the
land-based industry is especially strong. However, developing wind farms for the marine
environment requires specialized skills, technology, and equipment. Retooling and retraining is
necessary, and these will be discussed in the Domestic Manufacturing section of this report.

Two of the most important obstacles to offshore development are permitting and obtaining a
purchaser for the energy. These two obstacles are related to other hurdles hindering
development, including financing and opposition by stakeholders. It is estimated that it now takes
an average of seven to ten years for a project to be permitted. 43 There are multiple agencies
with different and sometimes overlapping jurisdictions conducting the permitting. The first project
to initiate the permitting process was the Cape Wind project, which submitted its first application
in November, 2001 and was awarded a lease by the Department of Interior in October 2010.44

Beyond permitting, the additional challenge is finding purchasers for the wattage. This is
emerging as the more intractable barrier to the domestic offshore wind industry. Energy produced
by offshore wind farms is currently priced higher than energy from land-based wind farms.
Offshore wind is also priced higher than other fossil fuels, including coal, oil, and natural gas,
which are used to produce the majority of electricity in the U.S. Table 4 shows estimates from the
Electric Power Research Institute (EPRI) for the levelized cost of energy in 2015 for various energy
sources. The levelized cost of energy is the annual cost of recovering the total capital costs plus

40 Ibid, p. 36.
41 Ibid.
42 Ibid, Forward.
43 U.S. Department of Energy, National Renewable Energy Laboratory. Musial, Walter, NREL and Bonnie Ram,

Energetics. (2010, September). Large-Scale Offshore Wind Power in the United States: Assessment of Opportunities
and Barriers. ( NREL/TP-500-40745). Retrieved from www.nrel.gov/wind/pdfs/40745.pdf.
44 U.S. Department of Energy. (2011, February). A National Offshore Wind Strategy: Creating an Offshore Wind

Energy Industry in the United States, p. 17. Retrieved from
http://www1.eere.energy.gov/windandhydro/pdfs/national_offshore_wind_strategy.pdf

INTERNATIONAL ECONOMIC DEVELOPMENT COUNCIL                                                                         18
recurring costs such as operations, maintenance and royalty payments divided by the annual
expected output.45

Table 4: Levelized Cost of Energy, $/KWh (in constant Dec. 2010 $)

 Coal(1)                                      $.054-$.073
 Natural Gas                                  $.049-$.079
 Nuclear                                      $.076-$.087
 Wind: Onshore                                $.075-$.138
 Wind: Offshore                               $.130-$.159
 Solar: Concentrating Solar Thermal
 (CST)                                        $.151-$.195
 Solar: Photovoltaic (PV)                     $.242-$.455
Source: Electric Power Research Institute (EPRI)46

As aforementioned, the federal government’s National Offshore Wind Strategy aims to produce
offshore energy at a substantially lower price of 7 cents/kWh in 2030. The interim scenario is to
produce at a cost of 10 cents/kWh by 2020.47

Domestic Manufacturing and Production Potential
Domestic Wind Resources
The good news is that there is significant energy-generating potential from offshore wind in the
United States due to the length of the U.S. coastline and the quality of the wind resource. In
general, offshore winds blow more strongly and uniformly than onshore winds. U.S. offshore winds
are projected to produce a total energy generation of up to 30 percent more than U.S. onshore
winds.48, 49 The total gross wind resource from U.S. offshore wind energy is projected at more than

45 Reeves, Ari, 2003, July). Wind Energy for Electric Power: A REPP Issue Brief. Retrieved from Renewable Energy
Policy Project website: http://www.repp.org/articles/static/1/binaries/wind%20issue%20brief_FINAL.pdf
46 Inwood, S. (2011, June). Program on Technology Innovation: Integrated Generation Technology Options, pp. I-11,

Retrieved from Electric Power Research Institute website: http://rfflibrary.wordpress.com/2011/07/30/program-
on-technology-innovation-integrated-generation-technology-options/
47 U.S. Department of Energy. (2011, February). A National Offshore Wind Strategy: Creating an Offshore Wind

Energy Industry in the United States, p. iii. Retrieved from
http://www1.eere.energy.gov/windandhydro/pdfs/national_offshore_wind_strategy.pdf on July 20
48 U.S. Department of Energy. (2011, February). A National Offshore Wind Strategy: Creating an Offshore Wind

Energy Industry in the United States, Retrieved from
http://www1.eere.energy.gov/windandhydro/pdfs/national_offshore_wind_strategy.pdf.

INTERNATIONAL ECONOMIC DEVELOPMENT COUNCIL                                                                     19
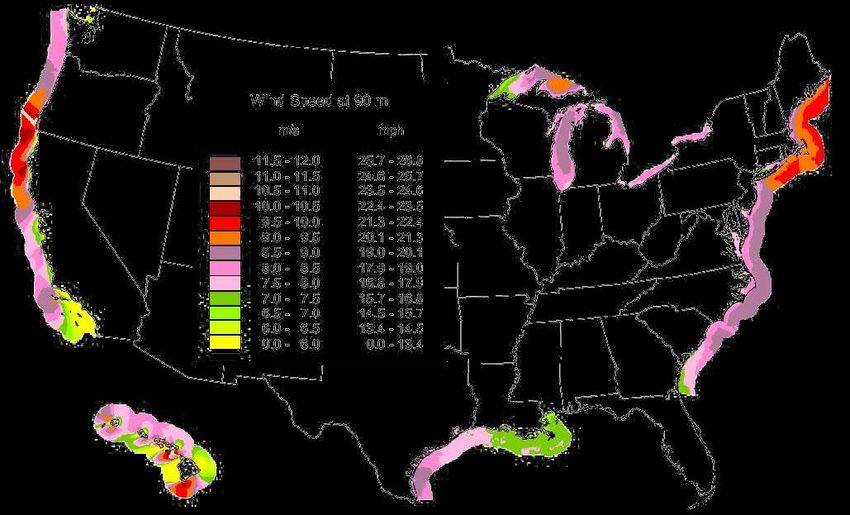
4,000 MW or roughly four times the current generating capacity carried on the U.S. electric grid.
These estimates place the U.S. reserve behind Asia and Europe in capacity. However, research
indicates that if the U.S. unlocks capacity through reforms in the permitting process and
improvements in vessel, transmission, and port infrastructure, then capacity could double to 6,180
MW.50

Figure 1 shows a map of national offshore resources, displaying national offshore wind speeds at
90m above the surface. The map shows that the highest wind speeds—the areas generating the
most power—are in the Northeast and along the west coast.

Figure 1: US Offshore Wind Estimates at 90m Height

Source: 51 52

49 Luis Cerezo and Clarence Lyons, Electric Power Research Institute, (personal communication, August 12, 2011)
50 Asmus, Peter. (2011, June 1). Which State Will Lead With First Installed Offshore Wind Project in the U.S.? Pike
Research Blog Articles: Retrieved from http://www.pikeresearch.com/blog/articles/which-state-will-lead-with-first-
installed-offshore-wind-project-in-the-u-s.
51 U.S. Department of Energy, National Renewable Energy Laboratory, Schwartz, M.; Heimiller, D.; Haymes, S.;

Musial, W. (2010, April). Assessment of Offshore Wind Energy Resources for the United States. (NREL/TP-500-45889.)
Golden, CO: NREL.

INTERNATIONAL ECONOMIC DEVELOPMENT COUNCIL                                                                      20
Most of the offshore projects being proposed are in the Northeast and Mid-Atlantic regions,
where winds are strongest, wind energy supply is plentiful, and the population demand is high.
The Gulf of Mexico and Great Lakes have significant capacity and so do other coastal regions
such as the Pacific Northwest. Table 5 displays a chart of capacity by region and depth.

With the exception of the “South Atlantic Bight,” (from North Carolina to the east coast of
Florida), virtually all coastal regions of the U.S. have significant wind energy capacity of over
500 MW. However, the regions differ in terms of the depth of the water supply where the wind is
generated. This has important implications for short-term development of offshore wind farms. In
the Mid-Atlantic and the Gulf of Mexico, the greatest supply of wind power is in relatively
shallower waters between zero and 30 meters deep. So far, virtually all market-tested projects
worldwide have been in relatively shallow waters less than 30 meters deep. New England and
the Great Lakes also have significant wind resources at shallower depths, though there is an even
greater source of wind energy at 60 meters and deeper.

Table 5: Wind Capacity by Depth
                                                                      GW
 Region
                                    0-30              30-60                >60                   Total
 New England                       100.2              136.2              250.4                   486.8
 Mid Atlantic                      298.1              179.1               92.5                   569.7
 S. Atlantic Bight                 134.1               48.8               7.7                    190.6
 California                         4.4                10.5               573                    587.9
 Pacific Northwest                  15.1               21.3              305.3                   341.7
 Great Lakes                       176.7              106.4              459.4                   742.5
 Gulf of Mexico                    340.3              120.1              133.3                   593.7
 Hawaii                             2.3                5.5               629.6                   637.4
 Total                            1071.2              627.9             2451.2                  4150.3
Source: 53

52 Schwartz, M.; Haymes, S.; Musial, W. (April 2010). Assessment of Offshore Wind Energy Resources for the Untied
States. (NREL/TP-500-45889.) Golden, CO: NREL.
53 U.S. Department of Energy, National Renewable Energy Laboratory. Musial, Walter, NREL and Bonnie Ram,

Energetics. (2010, September). Large-Scale Offshore Wind Power in the United States: Assessment of Opportunities
and Barriers. ( NREL/TP-500-40745). Retrieved from www.nrel.gov/wind/pdfs/40745.pdf.

INTERNATIONAL ECONOMIC DEVELOPMENT COUNCIL                                                                     21
One drawback is that technology for building installations at greater depths is only recently starting to become commercially available. Thus, while states like California and Hawaii may have significant capacity at 60 meters and deeper, the offshore wind supply there is not likely to be captured soon due to technological limitations. However, the U.S. is still devoting resources to researching deep water or “next generation” technologies such as floating turbines. Wind captured further offshore is stronger and can provide a more plentiful energy supply and eventual economies of scale. The main active demonstration project involving floating turbines is being proposed off the coast of Maine by Statoil. Statoil is a pioneer in floating turbine technology; its Norwegian parent company built the world’s first large scale floating wind turbine project off the coast of Norway. Projects in the Pipeline Table 6 is a list of projects that have achieved important milestones in permitting as of mid-2011. It is perceived that the permitting process for projects in state waters—usually three nautical miles (3 n.m.) or less from the coastline—takes less time than the permitting process for federal waters. Indeed, as Table 6 shows, many projects which have been permitted are in state waters. Some are demonstration projects with small energy output. In federal waters, demonstration projects are often paired with large-scale utility projects proposed by the same developer. Other projects, specifically in Texas, are utility-scale since the state’s waters extend nine nautical miles from the coastline. INTERNATIONAL ECONOMIC DEVELOPMENT COUNCIL 22
Table 6: Offshore Projects in U.S. That Have Achieved Permitting Milestones

                                                                           Distance
                                                                                    Planned Permitting
 State           Developer           Project Name          Location          from
                                                                                    Capacity  Status
                                                                            Shore
 DE        NRG Bluewater          Mid-Atlantic Wind    Offshore from       13.21       300-450   Lease
           Wind                   Park                 Rehoboth Beach      miles       MW        granted
 MA        Cape Wind              Cape Wind            Nantucket Sound     5.2 miles   468 MW    Complete
           Associates
 NJ        NRG Bluewater                               Offshore from       15.6        348 MW    Met Tower
           Wind                                        Atlantic Beach      miles                 Lease
 NJ        Deepwater Wind                              Offshore from       20 miles    345 MW    Interim
           LLC ,Garden State                           Avalon                                    Lease
           Offshore Energy
 NJ        Fishermen's Energy,    Atlantic City        Offshore from       2.8 miles   24 MW     Fully
           LLC                    WindFarm             Atlantic City                             permitted
 NJ        Fishermen's Energy,    Offshore New         Offshore from       16 miles    350 MW    Interim
           LLC                    Jersey Windfarm      Brigantine                                Lease
 NY        To be determined       Long Island – New    Offshore from       14 miles    350 MW    In process
                                  York City Offshore   Rockaway
                                  Wind Project         Peninsula
 TX        Coastal Point Energy                        Offshore from       8.5 miles   300MW     State
           (formerly W.E.S.T.)                         Galveston                                 Lease
           Baronyx                Rio Grande Project   Off Cameron         10                    State
                                  (North and South)    County in Gulf of   statute               Lease
                                                       Mexico              miles
           Baronyx                Mustang Island       Off Nueces          10                    State
                                  Project              County in Gulf of   statute               Lease
                                                       Mexico              miles
 VA        Seawind Renewable      Seawind-Virginia     Offshore from       25 miles    480 MW    In process
                                                       Virginia Beach
Sources:   54.

54   AWEA Annual Report, Retrieved from http://www.baryonyxcorp.com/ on August 15, 2011

INTERNATIONAL ECONOMIC DEVELOPMENT COUNCIL                                                                    23
Most of the proposed projects that are now looking for buyers will enter into a contract with a
utility to purchase the power that is produced. This contract is a power purchase agreement (PPA)
that guarantees a market for a period of usually fifteen to twenty years. Table 7 represents
those projects which have obtained purchasers for offshore wind power for at least part of the
output from the wind farm.
Table 7: Offshore Wind Projects that have Secured PPAs
Distance
Planned Power Purchase
State Developer Project Name Location from
Capacity Agreement (PPA)
Shore
Cape Wind Nantucket National Grid for
MA Associates Cape Wind Sound 5.2 miles 468 MW 77.5%
Deep Water Block Island Offshore from Just under National Grid for
RI Wind, LLC Wind Farm Block Island 3 miles 30 MW 100%
In addition to the above two projects, there was a third PPA that was secured but cancelled in
December 2011. In fact, it was the first PPA in North America for an offshore wind farm. NRG
Bluewater Wind had entered into a PPA with Delmarva Power for a project off the coast of
Rehoboth Beach, Delaware. However, after NRG was unable to find an investment partner, they
halted development of the project and cancelled the PPA. Since then, NRG has acquired the lease
while searching for another buyer.
Other projects are currently negotiating PPAs. In the case of New Jersey, under the Offshore
Wind Development Act of 2010, qualified offshore wind developers will not enter directly into
agreements with buyers through Purchase Power Agreements (PPAs) but will be awarded
Offshore Wind Renewable Energy Certificates (ORECs), which will then be bought by purchasers
of energy statewide. Those purchasers will be required to buy a designated amount of ORECS or
make a cash-equivalent purchase. The program will work similarly to New Jersey’s Solar
Renewable Energy Certificate (SREC) program.
Retooling Opportunities in Manufacturing
There are various industries that are candidates for retooling, including: onshore wind,
shipbuilding, maritime and port-based industries, oil, and gas.
INTERNATIONAL ECONOMIC DEVELOPMENT COUNCIL 24Onshore-Offshore Retooling
The most obvious kind of retooling, which prima facie seems the easiest, is retooling onshore
manufacturers and supply chain businesses to service the offshore industry. However, there are
substantial differences in production. The main component markets of the turbine are: foundations,
towers, nacelles, blades, power cable systems, marine installation, operations and maintenance,
and vessel construction.55 While many of these components are similar across land-based and
offshore turbines, the marine climate does lend itself to some important design differences. For
instance:
Most offshore installations use larger turbine designs.
Corrosion protection is needed with outside surface protection against environmental
contaminants such as salt.
Foundation design for offshore wind development requires larger multi-pile foundations for
towers as well as floating structures and towers.
These products offer new opportunities for existing manufacturers of turbines and foundations to
innovate or for new entrants to the field. The general trend has been a focus on scaling current
technology to accommodate the larger sizes needed for greater depths and stronger winds.56
However, some expertise will be outside the scope of land-based technology. In some cases,
investments to adapt a facility to produce for the offshore market may be prohibitively
expensive. As a result, the land-based supply chain may have the capacity to produce some
components for the land-based industry, but eventually experts predict there will also be some
“decoupling.” A “decoupling” implies that a supply chain dedicated to production of offshore
technology and products may emerge. The move for more radical and “next-generation”
redesign would likely involve the activities of a new, specialized offshore supply chain.
55 Kleinhenz & Associates. (2010, July). The Potential Economic Impacts in Ohio Associated with the Emergence of a Lake
Erie Offshore Wind Industry. Retrieved from:
http://www.nortech.org/images/stories/_pdf/LEEDCo_Economic_Impact_Study_FINAL.pdf.
56 US Offshore Wind Collaborative. (2009, October). U.S. Offshore Wind Energy: A Path Forward. Retrieved from:
http://www.usowc.org/
INTERNATIONAL ECONOMIC DEVELOPMENT COUNCIL 25Ship Building Industry There is also potential in the shipbuilding industry for the manufacturing of specialized offshore wind vessels. There are several factors precipitating demand for domestic production of these ships. Currently, there are virtually no such ships in the U.S., since the offshore wind industry is not yet on-line, and the supply servicing offshore wind farms in Europe and Asia is being utilized at full capacity. Additionally, it would be very expensive to charter a boat from Europe to service U.S. installations. Finally, based on the interpretation of the Jones Act, which has been in existence since 1920, foreign vessels may not be allowed to service wind farms in U.S. waters. With offshore wind vessels costing an estimated $260 million and taking about two years to build, manufacturing of these ships could be a boon to the U.S. shipbuilding industry and result in the retention or creation of a significant number of jobs.57, 58 However, the industry will need incentives and financing mechanisms that help developers mitigate the risk associated with such a large investment. 57 Trabish, Herman. (2010, December 30). The Emerging Opportunity in Offshore Wind Vessels. Greentechmedia. Retrieved from: http://www.greentechmedia.com/articles/read/the-emerging-opportunity-in-offshore-wind-vessels/ 58 Fichaux, Nicholas & Wilkes, Justin. (2009). Oceans of Opportunity: Harnessing Europe’s largest domestic resource, p. 55. Retrieved from European Wind Energy Association website: http://www.ewea.org/fileadmin/ewea_documents/documents/publications/reports/Offshore_Report_2009.pdf INTERNATIONAL ECONOMIC DEVELOPMENT COUNCIL 26
Ship Building Industry and the Jones Act

  The Jones Act restricts the transportation of merchandise between points in the U.S. to U.S.
  built-vessels. These ships must fly the flag of the U.S. and be owned and crewed by U.S.
  citizens. If indeed the Jones Act is judged to apply to the huge seagoing vessels needed to
  erect and maintain offshore wind turbines, then there are a few important implications. In the
  short term, there would be a shortage/absence of specialized vessels to service offshore wind
  farms in the U.S. The best candidates would be ships used to service the oil and gas industries
  that are located in the Gulf of Mexico.

  In the longer term, this could be a boon for the U.S. ship building industry. The European
  experience indicates that specialized wind system installation vessels, rather than adapted oil
  and gas vessels, are required for cost-effective, high volume installation. Such vessels are major
  undertakings, as they must support 100 to 200 ton towers and cranes, are estimated to cost
  $150 million to $250 million per ship, and take about two years to construct. Another
  possibility is that foreign companies already building these ships—including South Korea’s
  Daewoo Shipbuilding and Marine Engineering and Samsung Heavy Industries, Poland’s Crist
  Shipyard, and Germany’s Sietas shipyard—set up a domestic shipbuilding capacity in the U.S.
  so that their ships could comply with the Jones Act.

  Precedents are still being established. It is possible that further legal interpretation could allow
  foreign ships. In May 2010, regulators indicated that a stationary foreign vessel could be used
  in U.S. waters to install a meteorological tower, which would be necessary for offshore wind
  farms. But for reasons including the Jones Act, as well as the high cost of leasing foreign ships
  and the lack of availability, the U.S. ship-building industry could stand to benefit.

INTERNATIONAL ECONOMIC DEVELOPMENT COUNCIL                                                        27
Maritime and Port-Based Industry/Oil and Gas Industry

Ports will serve as future staging areas for offshore wind farms, and the businesses that currently
support ports will have to gain skills and capacity related to the new industry. An existing port
infrastructure is needed for the large specialized ships that service offshore wind farms. A strong
local supply chain of businesses is also crucial. The Gulf of Mexico is one area that has both a
strong port-based industry and an existing supply chain that operates in deep water due to its
experience in oil and gas.

Other Manufacturing and Industries

In addition to the industries mentioned above, there may be opportunities in offshore wind for
welders, metal workers, semiconductor companies, machinists, and construction workers. Various
state supply chain studies (often based on similar ones focused on onshore wind) have identified
businesses by NAICS code.

Opportunities in Foreign Direct Investment
Just as foreign onshore wind companies such as Gamesa, Siemens, and Mitsubishi have invested in
U.S. facilities, foreign manufacturers with offshore facilities could confer economic benefits to the
U.S. as well. However, so far foreign companies are not moving major manufacturing facilities to
the U.S. as they are waiting for U.S. offshore wind farms to start construction, become
operational, and start producing a steady stream of energy.

Most current U.S. offshore developments are already importing components or have their sights
set on importing turbines and major components from foreign companies. Energy Management,
Inc., the company developing the Cape Wind project in Cape Cod, has indicated it will buy its
turbines from Siemens.59 The Deepwater Wind project off the coast of Rhode Island is interested
in the most state-of-the-art and largest turbine on the market: the 6MW turbine being
manufactured by Repower Systems, Nordex, Alstom, and Siemens. All of these are foreign
companies.60 Indeed, in its report for the Massachusetts Clean Energy Center, Tetra Tech EC, Inc.

59George Sterzinger, personal communication, July 25, 2011.
60Franco, Mark del. (2011, Summer). “The 6MW Offshore Turbine Sets Sail for North America.” Offshore Wind. A
Supplement to Wind Power. P. 10.

INTERNATIONAL ECONOMIC DEVELOPMENT COUNCIL                                                                     28
concludes that “most, if not all, turbine components pieces for the planned offshore wind farms
would be manufactured and shipped from European facilities.”61

However, foreign companies have also begun to partner with U.S. companies. The Spanish
company Gamesa partnered with Northrop Grumman’s shipbuilding operations to launch the
Offshore Wind Technology Center in Chesapeake, Virginia and develop the next generation of
wind technology suitable for offshore conditions.62

Opportunities in Export Development
Development for the export market provides economic returns for U.S. businesses. Not only will it
produce revenue and jobs, but it will also help the domestic industry develop expertise. When the
offshore industry takes off in the U.S., these businesses will be ready to serve that market.

There is some export potential in the works, specifically in research and development. Within the
U.S., General Electric has developed a 4.0 MW turbine for the offshore wind market. As of
October 2010, GE had 35.7 MW installed offshore in Sweden and Ireland and was testing
38.5MW in Norway.63 In addition, Clipper Wind has developed, but has not yet deployed, its
Brittania 10.0 MW turbine.64 Because offshore wind development is still a nascent field, there is
room for the U.S. to compete and become a technology and manufacturing leader (see text box
below.)

http://issuu.com/zackinpublications/docs/osf2010_online?mode=embed&layout=http%3A%2F%2Fskin.issuu.com%2F
v%2Flight%2Flayout.xml&showFlipBtn=true.
61 Tetra Tech EC, Inc. (February 2010). Port and Infrastructure Analysis for Offshore Wind Energy Development, p. 6.

Retrieved from Massachusetts Clean Energy Center website:
http://www.masscec.com/index.cfm/pk/download/id/11693/pid/11151.
62 Franco, Mark del. (2011, Summer). State Addresses Offshore Issues. Offshore Wind. A Supplement to Wind Power.

pp. 3-4. Retrieved from
http://issuu.com/zackinpublications/docs/osf2010_online?mode=embed&layout=http%3A%2F%2Fskin.issuu.com%2F
v%2Flight%2Flayout.xml&showFlipBtn=true
63 AWEA. (October). Presentation at the AWEA.
64 AWS Truewind. (2010, September). New York’s Offshore Wind Energy Development Potential in the Great Lakes:

Feasibility Study.” Retrieved from:
http://www.awstruepower.com/wpcontent/media/2010/09/NYSERDA_AWST_NYGreatLakesFS.pdf. On August 1,
2011.

INTERNATIONAL ECONOMIC DEVELOPMENT COUNCIL                                                                       29
You can also read