The spatial dimension of productivity: Connecting the dots across industries, firms and places - OECD iLibrary
←
→
Page content transcription
If your browser does not render page correctly, please read the page content below

OECD Regional Development Working Papers 2020/01

                                  Alexandra Tsvetkova,
                                        Rudiger Ahrend,
     The spatial dimension             Joaquim Oliveira
of productivity: Connecting                   Martins,

the dots across industries,     Alexander C. Lembcke,

          firms and places             Polina Knutsson,
                                                 Dylan Jong,
                                       Nikolaos Terzidis
                                   https://dx.doi.org/10.1787/ba5edb47-en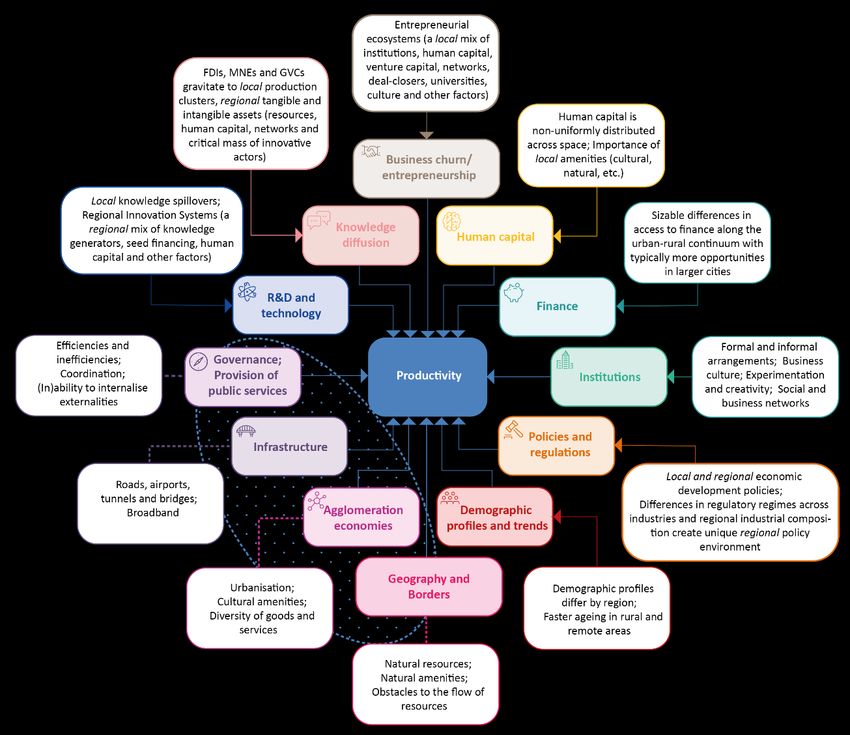
1
OECD Regional Development Working Papers
The spatial dimension of productivity
Connecting the dots across industries, firms and places
By: Alexandra Tsvetkova, Rudiger Ahrend, Joaquim Oliveira Martins, Alexander Lembcke,
Polina Knutsson, Dylan Jong and Nikolaos Terzidis
This working paper offers a synthesis of the current knowledge on the determinants of
productivity. It carefully reviews both “spatial” (e.g. agglomerations, infrastructure,
geography) and “aspatial” (e.g. human capital, labour regulations, industry-level
innovation and dynamism) productivity drivers and demonstrates how the underlying
spatial dynamics behind the latter group makes all productivity determinants “spatial”
in nature. The paper demonstrates that productivity is inherently a spatial
phenomenon and its understanding without a local/regional dimension is incomplete.
JEL codes: R11, R12, R58
Keywords: spatial productivity, productivity growth, local development, cities, regions, industries, firms,
places
THE SPATIAL DIMENSION OF PRODUCTIVITY © OECD 2020
PUBE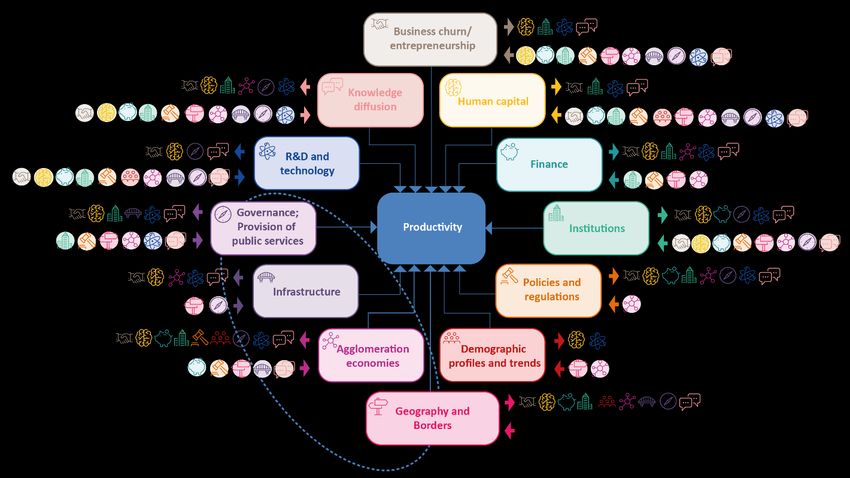
2
ABOUT THE OECD
The OECD is a multi-disciplinary inter-governmental organisation of 36 member countries which engages
in its work an increasing number of non-members from all regions of the world. The Organisation’s core
mission today is to help governments work together towards a stronger, cleaner, fairer global economy.
Through its network of 250 specialised committees and working groups, the OECD provides a setting
where governments compare policy experiences, seek answers to common problems, identify good
practice, and coordinate domestic and international policies. More information available: www.oecd.org.
ABOUT OECD REGIONAL DEVELOPMENT WORKING PAPERS
Working papers from the Regional Development Policy Division of the OECD cover a full range of topics
including regional statistics and analysis, urban governance and economics, rural governance and
economics, and multi-level governance. Depending on the programme of work, the papers can cover
specific topics such as regional innovation and networks, the determinants of regional growth or fiscal
consolidation at the subnational level. OECD Regional Development Working Papers are published on
http://www.oecd.org/cfe/regional-policy.
OECD Working Papers should not be reported as representing the official views of the OECD or of its
member countries. The opinions expressed and arguments employed are those of the author(s).
Working Papers describe preliminary results or research in progress by the author(s) and are published to
stimulate discussion on a broad range of issues on which the OECD works. Comments on Working Papers
are welcome, and may be sent to the Centre for Entrepreneurship, SMEs, Regions and Cities, OECD, 2
rue André-Pascal, 75775 Paris Cedex 16, France.
This paper is authorised for publication by Lamia Kamal-Chaoui, Director, Centre for Entrepreneurship,
SMEs, Regions and Cities, OECD.
This document, as well as any statistical data and map included herein, are without prejudice to the status
of or sovereignty over any territory, to the delimitation of international frontiers and boundaries and to the
name of any territory, city or area.
© OECD 2020
You can copy, download or print OECD content for your own use, and you can include excerpts from
OECD publications, databases and multimedia products in your own documents, presentations, blogs,
websites and teaching materials, provided that suitable acknowledgement of OECD as source and
copyright owner is given. All requests for public or commercial use and translation rights should be
submitted to rights@oecd.org.
THE SPATIAL DIMENSION OF PRODUCTIVITY © OECD 2020
3 Foreword Current productivity discourse, both in academia and policy-making, predominantly revolves around national and sectoral (or industry-level) productivity determinants. From international comparisons, we know a great deal about the aggregate drivers of productivity growth. We know relatively little about the role played by places and regions in defining their own productivity performance. Due to their general scope, current national policies based on aggregate research are unlikely to effectively stimulate regional productivity growth and to decrease interregional inequality by leveraging regional and local assets. To devise successful subnational and place-based policies, a deeper understanding of the spatial dimension of productivity is needed. The urgency of such knowledge further increases as the global megatrends affect places along the urban-rural continuum differently. The Spatial Productivity Lab (SPL) at the OECD Trento Centre for Local Development, which is an integral part of the Centre for Entrepreneurship, SMEs, Regions and Cities, is a dedicated research laboratory that generates and disseminates knowledge on the complex ways regional and local processes are linked to productivity performance at the subnational level. The SPL works with local and global partners to address the challenges faced by regions, cities and rural areas in supporting and stimulating their growth. The work explores the impact of agglomerated economies and the urban-rural linkages, the mechanisms of regional productivity catching-up and the role of regional authorities in promoting the bottom-up approaches to productivity improvement. Based on its research and analyses, the SPL is able to help with design and implementation of efficient regional and local policies that facilitate productivity growth, creation of better jobs and increased general well-being with no places left behind. This working paper is the first in a series of outputs by the Spatial Productivity Lab. It identifies the main productivity drivers and sets the ground for the future SPL research work, which will explore each of them in greater detail and across various contexts to generate timely insights for effective place-based policies. THE SPATIAL DIMENSION OF PRODUCTIVITY © OECD 2020

4
Acknowledgements
The authors sincerely thank Alessandra Proto, the Acting Head of the OECD Trento Centre for Local
Development, for her continued support, encouragement and inspiration of the OECD Spatial Productivity
Lab (SPL). Special thanks go to Elisa Campestrin, Research Assistant at the OECD Trento Centre for
Local Development, for her masterful editing and formatting assistance. The authors are also indebted to
the participants of the special sessions “The spatial dimension of productivity” at the 59th ERSA Congress
in Lyon (France), the 6th SPL meeting in Venice (Italy) and the 75th Session of the OECD LEED Directing
Committee meeting in Paris (France) for their comments.
THE SPATIAL DIMENSION OF PRODUCTIVITY © OECD 20205 Table of Contents Foreword 3 Acknowledgements 4 Executive summary 7 1 Introduction 10 2 Productivity definition and measurement 12 3 Why spatial dimension matters 13 Productivity and well-being of places 13 Subnational policies for balanced and inclusive growth 14 4 Bringing space into productivity discourse: Overview and synthesis 15 5 Industry and firm productivity determinants and their spatial dimension 18 Technological advance and R&D 18 Knowledge diffusion 21 Business churn and competition 23 Human capital 27 Demography 29 Finance 30 Institutions, policies and regulations 31 6 Clearly spatial productivity determinants 35 Geography and borders 35 Agglomerations and agglomeration spread 36 Traditional and digital infrastructure 37 Governance 38 7 Interdependencies among productivity determinants 41 8 The role of spatial dimension for policy complementarity 43 References 46 THE SPATIAL DIMENSION OF PRODUCTIVITY © OECD 2020
6
Tables
Table 4.1. Regional variations in productivity determinants 17
Figures
Figure 4.1. A synthesis of the literature on productivity including spatial dimension 16
Figure 7.1. The inter-linked nature of productivity determinants 42
THE SPATIAL DIMENSION OF PRODUCTIVITY © OECD 20207 Executive summary Productivity is the main determinant of living standards. Productivity growth, however, has been falling since the beginning of the century in many OECD nations accompanied by the increasing interregional divergence in productivity performance within countries. The mainstream economics research, which studies the drivers of productivity at the level of industries and firms, appears to be ill-equipped to offer solutions that would reverse the widening gap across regions. An explicit focus on the spatial (subnational) dimension of productivity is needed in order to better understand the recent productivity dynamics and to devise policy solutions able to boost aggregate productivity growth and to decrease interregional inequality. Despite being largely missing from the productivity discourse within the mainstream economics literature, the spatial dimension is an integral (but often untold) story of productivity performance. This paper offers a synopsis of the current productivity research and demonstrates how regional and local characteristics and dynamics are central to productivity outcomes across industries, firms and places. The paper distils a (relatively narrow) range of productivity determinants from the mainstream economics research and describes the mechanisms of their effects on productivity. These determinants are R&D and technology; knowledge diffusion; business churning; human capital; institutions (both formal and informal, such as culture); policies and regulations and demographic profiles and trends. This discussion (based on the theoretical and empirical studies that omit the geographical dimension) is followed by a detailed overview of how spatial realities shape each productivity determinant in focus. Finally, several clearly spatial productivity drivers (geography and borders; agglomeration economies; infrastructure – traditional and digital; governance and the efficiency of public services provision) are presented as described mostly in the regional science research. Figure 1 offers a snapshot of the main content. It shows the spatial underlying factors for the eight “aspatial” productivity determinants. For the “spatial” productivity determinants, it lists associated characteristics and processes that have direct effect on productivity. THE SPATIAL DIMENSION OF PRODUCTIVITY © OECD 2020
8
Figure 1. Productivity determinants and their spatial dimension
Note: The oval contour in the South-West corner encompasses the four determinants, which are mostly studied within the regional science
literature and can be considered as “purely spatial” in nature.
Source: Own synthesis of the literature.
The productivity determinants shown in Figure 1 are often interrelated and form a complex web of mutually
dependent factors that shape productivity of a region both directly and indirectly. Figure 2 presents a
roadmap of the interdependencies among the discussed productivity drivers. For every productivity
determinant, the outward arrow points to a range of drivers, which the given determinant influences. The
inward arrow, on the other hand, originates at the group of productivity drivers, which shape the given
determinant. The Figure 2 is a simplified representation of the productivity-driving dynamics, as the
underlying spatial factors (which are also interdependent and affect the displayed productivity determinants
and productivity performance both directly and indirectly) are omitted.
THE SPATIAL DIMENSION OF PRODUCTIVITY © OECD 20209 Figure 2. The interlinked nature of productivity determinants Note: The oval contour in the South-West corner encompasses the four determinants, which are mostly studied within the regional science literature and can be considered as “purely spatial” in nature. Source: Own synthesis of the literature. Finally, the spatial dimension is central to the ability of various policies, both space-blind and regional, to be synchronised and to enhance each other. The policy efforts that ignore the spatial dimension are unlikely to succeed. By design, such policies cannot effectively leverage local assets and complementarities for better outcomes tailored to the local needs. The increasing productivity growth and the decreasing interregional inequalities can be achieved only when academic and policy discourse embrace the spatial (subnational) dimension of productivity. The policy design should strive to maximise policy complementarities stemming from the interdependent nature of productivity determinants and their embeddedness in local realities. THE SPATIAL DIMENSION OF PRODUCTIVITY © OECD 2020
10
1 Introduction
Productivity, the efficiency of input conversion into output, is the main determinant of living standards
(Easterly and Levine, 2001[1]). More productive economies have greater ability to support and enhance
well-being of their citizens via higher incomes, better infrastructure, more services and other means. The
drivers of productivity, and its effects on a range of social and economic outcomes, are the focus of a
voluminous, long-standing and well-developed research literature. Despite the vast scholarly attention paid
to productivity, its spatial dimension is generally missing from this discourse and is yet not well understood.
While productivity is ultimately driven by individual decisions of workers and companies on how to use
resources in the process of value generation, regional environment conducive to and offering support
infrastructure for more efficient choices is important. Many, if not all, productivity determinants studied in
the international literature vary considerably at the regional and local levels. An extensive body of regional
science research demonstrates subnational origins of many productivity drivers. The productivity
discourse, however, often fails to link the regional nature of a number of productivity determinants to
aggregate productivity (growth).
The spatial dimensions of productivity performance are becoming more salient as the global megatrends,
in particular globalisation and digitalisation, affect localities differently along the urban-rural continuum. As
policy makers strive to ensure spatially-inclusive growth with no places left behind, spatially-conscious
productivity research is needed to inform the design of efficient policies tailored to the needs of specific
places. Such policies should help the more productive regions to enhance their standing and the lagging
regions to close productivity gaps.
This report offers an overview of the current productivity research placing a particular emphasis on the
spatial dimension. The following observations follow from this review.
First, in the mainstream economics literature, productivity is predominantly studied within industries/sectors
and/or firms. The productivity discourse identifies a range of productivity determinants and explains the
mechanisms of their effects. The studies, however, ignore the spatial dimension of productivity. As a
consequence, productivity debates in the mainstream economics are of limited relevance for regional
economic growth policies and mostly cannot inform the efforts to reverse the increasing subnational
productivity divergence.
Second, the spatial subnational (local, regional) dimension clearly plays a role in the ways people, firms,
industries and other actors interact and function, which has both direct and indirect effects on productivity.
Every productivity determinant highlighted by the mainstream economics literature has a well-defined
spatial dimension. Besides, there is a set of obviously spatial productivity determinants that are mostly
overlooked by the mainstream economics research but are well developed in the regional science
literature.
The importance of productivity as an underlying factor of the socio-economic wellbeing and the obvious
disconnect between the territorially bounded nature of many policies and the lack of detailed knowledge
on the spatial dimension of productivity calls for policy-relevant research on productivity-driving
mechanisms within and across various spatial contexts, as well as their interactions.
To be most useful and precise, the research efforts to better understand productivity, its determinants and
the ways to boost aggregate productivity performance while reducing interregional inequalities need to rely
THE SPATIAL DIMENSION OF PRODUCTIVITY © OECD 2020 11 on better data. A census of establishment-level business microdata and the employer-employee linked data in particular appear crucial for the ability of researchers and policy makers to understand the productivity-defining processes and phenomena, as well is their interactions across space, industries, company types and other dimensions. THE SPATIAL DIMENSION OF PRODUCTIVITY © OECD 2020
12
2 Productivity definition and
measurement
Productivity is a measure of how much output an economic agent (firm, industry, region, etc.) produces
out of a given amount of inputs. Since greater productivity is generally related to higher profits and wages,
the determinants of productivity, as well as variations in its levels and/or growth rates, have been the focus
of intensive scrutiny from both scholars and policy-makers. Recent slowdown of productivity growth in
many OECD countries1 coupled with raising subnational disparities has revived a broad interest in this
phenomenon.
When it comes to empirical research, the literature adopts various ways to measure productivity depending
on the specific research question, data availability and plausibility of certain assumptions about the
production function. Among productivity measures, labour productivity is perhaps the most widely used
followed by total factor productivity (TFP) or multifactor productivity (MFP).
The former approach usually relies on measures of GDP, output or value added per worker or hour worked
(Syverson, 2017[2]; Monteiro, Gouveia and Santos, 2017[3]). Alternatively, wages2 (Slobodnitsky, Drucker
and Geva, 2018[4]; Glaeser and Resseger, 2010[5]) or per capita income (Stansel, 2005[6]) can be used as
a loose approximation for labour productivity. Obviously, labour productivity depends on the intensity of
other factors use and is hardly comparable across firms, industries and locations (Syverson, 2011[7]). The
advantage of approximating productivity by the labour-related measures, however, is the ease of
calculation and the ready applicability to all industries/sectors, including services.
A more comprehensive approach is to calculate total factor productivity or multi-factor productivity, which
can be done in at least three ways. The most common one is based on the regression analysis and detailed
(usually plant-level) data. A measure of output (value added) is regressed on the separate input costs. The
unexplained residual is believed to capture productivity3. Another methodology is to calculate a ratio
between output and an index number aggregating all inputs. Finally, a distance to the technological frontier
can be employed as a measure of TFP performance (Capello and Lenzi, 2015[8]).
Notes
1
See, for example, www.conference-board.org/data/economydatabase/index.cfm?id=27762. A useful
overview of the slowdown and the central explanations offered in the literature (including measurement
issues) is given in Andrews, Criscuolo and Gal (2016[15]).
2
On the link between productivity and pay, see, for example, Stansbury and Summers (2017[287]).
3
This approach is broadly based on the logic of the TFP decomposition sometimes referred to as growth
accounting and attributed to the works of Solow (Solow, 1957[288]). Within this approach, growth in total
output is explained by the growth in inputs, while the unexplained residual is the technological change or
productivity improvement.
THE SPATIAL DIMENSION OF PRODUCTIVITY © OECD 2020 13 3 Why spatial dimension matters Productivity and well-being of places Productivity ultimately determines the living standards, as more productive companies are able to pay higher wages and taxes. The well-being of a region, then, is very closely linked to the performance of firms located within its borders. Given the growing subnational income inequalities across regions (Milanovic, 2016[9]), the quest is to understand the determinants of productivity (Mortensen, 2003[10]). The main drivers of productivity have been changing over the last decades. The industrial landscape of many countries is being reshaped by globalisation, technological advance and other megatrends. As a result, the share of employment in manufacturing in the OECD area is decreasing while that of services is steadily increasing. The conventional wisdom of the 20th century that larger manufacturing companies pay higher wages (due to the economies of scale), the so-called “size-wage premium”, becomes of limited relevance. Instead, productivity increasingly depends on technology adoption, innovation diffusion and human capital. The long-standing “productivity-wage premium” comes to the fore, particularly for the (ever more prevalent) services (Berlingieri, Calligaris and Criscuolo, 2018[11]). Despite the recent increase in the tradability of services, the sector still remains mostly nontradable. This means that its performance, and productivity in particular, is largely linked to the local conditions. Services are more likely to depend on the size of the local market and on the presence of agglomeration economies. The importance of the local conditions for productivity performance (as opposed to the national and industry-level determinants) is indirectly confirmed by the well-documented productivity dispersion across firms even within the same, narrowly defined, industries within a country (Syverson, 2011[7]; Berlingieri, Blanchenay and Criscuolo, 2017[12]). While national conditions and industrial characteristics explain some of the differences, much of them seem to depend on other factors such as subnational variation in endowments and assets. For example, information and communication technology (ICT) adoption and innovation at a company level is often cited as a driver of divergent productivity outcomes (Sorbe et al., 2019[13]; Gal et al., 2019[14]). The adoption of ICT and other advanced technologies, in turn, is driven by the human capital of a firm (its absorptive capacity), exposure to foreign markets and embeddedness into global knowledge flows (e.g. being a part of a multi-national enterprise or MNE) among others (Andrews, Criscuolo and Gal, 2016[15]). All of these factors are not uniformly distributed in space and, as will be demonstrated in this paper, have a clear-cut spatial dimension. The regional inequalities in well-being are even larger if they are measured in a more holistic manner (Veneri and Murtin, 2016[16]), i.e. by accounting for broader aspects of the economic and social environment (Coyle, 2018[17]). For example, the OECD Regional Well-Being framework (OECD, 2015[18]) integrates the traditional material conditions (income, earnings and housing) with extensive quality of life indicators (inter alia health, education, social connectivity, environmental quality) and future well-being resources (natural, human, economic and social capital). The UN Human Development Index (HDI) measures life expectancy, education and income per capita, while the EU Quality of Life Indicators include employment, environmental and social exclusion data. THE SPATIAL DIMENSION OF PRODUCTIVITY © OECD 2020
14
Another measure that captures how gains from productivity growth are distributed within society is
inclusiveness. The OECD has developed the Inclusiveness Composite Indicator (ICI), which accounts for
various types of unemployment and work intensity, material deprivation, poverty risk and educational
attainment. Based on the ICI, current evidence on the spatial variation in the inclusiveness of European
regions shows substantial national and regional divergence. In particular, since 2010, between-country
differences account for 57% of total variation in inclusiveness, while the remaining 43% is due to within-
country variation, stemming from different characteristics of local economies (OECD, 2018[19]). Given the
subnational disparities, the focus on productivity at a regional level is needed more than ever, as many
facets of the holistic well-being and inclusiveness measures are linked to the regional (spatial) realities.
It follows that local and regional conditions are important for regional productivity, earnings and well-being
and can explain – at least in part – the growing subnational disparities. This also means that the policy
efforts devoid of an explicit spatial dimension are likely to be unable to successfully leverage local assets
for more efficient outcomes tailored to the local needs. Focusing research and policy efforts on productivity
from a subnational perspective can facilitate both aggregate productivity growth and a decrease in regional
inequalities.
Subnational policies for balanced and inclusive growth
Successful policies should seek to enhance productivity, well-being and social inclusion based on a dual
typology of policy design and implementation. First, a synergy between national and regional policies is
necessary. Second, different types of regions (metropolitan, urban, rural) require a different policy mix.
Nationally designed monetary and fiscal policies ensure a stable macroeconomic environment that
increases the potential of investment measures to promote productivity and also cushions the negative
shocks on households in the lower half of the income distribution (Adalet McGowan and Andrews,
2015[20]). A range of other national policies such as market regulations (Nicoletti and Scarpetta, 2003[21];
Andrews, Criscuolo and Gal, 2016[15]) have been shown to be important for productivity. A different set of
national conditions within the policy reach, e.g. union activity, minimum wage and others can be related to
the link between productivity and earnings (Berlingieri, Blanchenay and Criscuolo, 2017[12]).
It is important that development policies also address the goal of a less unequal distribution of productivity
benefits. One of the conditions to achieve this is a design and implementation of structural policies that are
based on the local economic, social, demographic and labour market conditions. For instance, rigid
employment regulations have larger detrimental effects in lagging regions with thinner labour markets and
a low share of high-skilled employees (D’Costa, Garcilazo and Oliveira Martins, 2019[22]).
Likewise, a range of productivity- and inclusion-enhancing policies called for by the mainstream
productivity research, such as increased connectivity between industry and universities, labour training
initiatives and more opportunities for interactions that would promote technology and knowledge diffusion,
seem to be better tackled at the subnational level with regional and local conditions in mind.
THE SPATIAL DIMENSION OF PRODUCTIVITY © OECD 2020 15
4 Bringing space into productivity
discourse: Overview and synthesis
Regions, and space in general, have always been an obvious but untold part of the productivity story. A
vast international literature demonstrates the importance of a range of factors, such as human capital,
technological advance and innovation, competition and business churning, institutions and policies, for
productivity of industries and sectors across countries. This literature usually does not consider the
subnational dimension of the productivity drivers it studies. It also generally ignores a number of
subnational phenomena that have been shown to shape productivity performance at various levels of
aggregation.
At the same time, the regional science research tradition investigates (from a regional and local
perspectives) many, if not all, productivity determinants underscored by the international productivity
studies. It seeks to understand and explain a multitude of social and economic processes, explicitly
modelling them as a result of regional and local dynamics. Among prominent research topics within this
literature are agglomeration economies, entrepreneurship, business churn; innovation, R&D and
knowledge spillovers; universities; human and social capital; networks; business dynamics and structural
change among others. All of these factors, imbedded in the subnational space, are linked directly and
indirectly to productivity determinants highlighted by the international productivity research.
Figure 4.1 presents a schematic overview of both international literature on productivity and the regional
science studies that elucidate the ways, in which the “traditional” productivity drivers are shaped by regional
factors. The determinants that are displayed immediately linked to productivity (the inner circle of shaded
blocks) are derived from studies that have productivity (or in some cases other economic processes that
are plausibly related to productivity) as the dependent variables. All of these determinants, except the four
“spatial” ones, follow from the studies that are based on industry/sector or firm-level analyses and omit any
geographical dimension. The outermost blocks contain either a succinct descriptions of the spatially-
defined mechanisms that shape the “aspatial” productivity determinants displayed in the inner circle of
blocks. For the spatial factors included in the oval in the south-west corner, the linked blocks display related
elements, which may or may not have a causal effect on the spatial productivity drivers themselves but are
nevertheless essential for the spatial variations in the productivity levels.
Figure 4.1 offers a comprehensive and coherent view on the role of spatial and aspatial factors in
determining aggregate productivity performance. While succinctly displaying main relationships highlighted
in the discussion below, it does not show the complex interdependencies that exist among many
determinants included in the chart. Section 7 highlights some of such links.
THE SPATIAL DIMENSION OF PRODUCTIVITY © OECD 202016
Figure 4.1. A synthesis of the literature on productivity including spatial dimension
Note: The dotted oval in the SW corner encompasses determinants, which are mostly studied within the regional science literature and are
clearly spatial in nature.
Source: Authors’ elaboration based on the literature.
Another way to demonstrate the importance of space for productivity is by summarising regional variation
in main productivity determinants put forth by the international productivity literature, which omits the
subnational dimension. Table 4.1 shows the summary statistics for selected measures taken from the
OECD Stats regional database. The measures are organised around several productivity drivers shown in
Table 4.1. The values reported in the table are either standardised or are expressed as shares in order to
capture heterogeneity that is not driven by the size of a region.
Table 4.1 confirms a common observation in the regional science literature that many resources (including
human capital, R&D and others) are not uniformly distributed geographically. There is a significant variation
at the subnational level as evidenced by large differences between the minimum and the maximum values
of the variables and the overdispersion in some cases. Although not displayed, there are also notable
dissimilarities of regional industrial structures measured by employment shares across sectors. It is likely
to translate into varying regional competitive and regulatory regimes, as many policies and regulations are
sector-specific.
THE SPATIAL DIMENSION OF PRODUCTIVITY © OECD 2020 17
Table 4.1. Regional variations in productivity determinants
Productivity Std.
Measure Obs. Mean Min Max
determinants Deviation
R&D and PCT patent applications per million inhabitants 473 69.5 106.2 0.0 749.7
technology (fractional count; by inventor and priority year) - level
Share of R&D total expenditure (in % of GDP) 266 1.4 1.1 0.0 5.7
Share of employment in high-technology manufacturing 149 1.1 0.8 0.1 3.9
Share of employment in knowledge-intensive services 233 36.5 10.5 13.4 62.1
Knowledge Share of PCT co-patent applications that are done within 376 15.3 16.8 0.3 100.0
diffusion the country (in % of co-patent applications, total count)
Share of PCT co-patent applications that are done with 469 54.8 22.0 4.5 100.0
foreign regions (in % of co-patent applications, total
count)
Share of PCT co-patent applications that are done within 413 42.9 22.0 2.9 100.0
the region (in % of co-patent applications, total count)
Business churn Density of births, all firms (number of births divided by 1 154 7.3 4.2 2.5 29.9
000 population)
Birth rate (in % of all firms - same sector, same size 154 10.9 3.6 5.4 25.1
class)
Churn rate (births plus deaths in % of all firms - same 128 19.6 6.0 11.0 43.9
sector, same size class)
Human capital Share of labour force with secondary education 507 42.1 14.7 12.0 76.5
Share of labour force with tertiary education 507 33.3 14.3 6.0 75.2
Note: Data at the TL2 level; measures for business churn are reported for 2014 using industry, construction and services excluding insurance
activities of holding companies (total economy aggregate 3 based on ISIC Rev.4 codes); all other variables are reported for year 2015.
Source: Aggregation from the OECD.Stat regional database.
To illustrate, the density of firm births per 1 000 population is usually two to three times higher in the capital
regions compared to the least dynamic places in the OECD countries. In 2014, the capital regions of
Prague and Bratislava enjoyed more than 20 business entries per thousand of population. At the same
time, for many regions in Romania, Italy, France, UK and other countries this indicator was five or less.
Another example is the number of patent applications per million inhabitants. The OECD.Stat database
reports this measure for more than 450 TL2 regions. Slightly over 10% of these regions had one or no
patent applications in 2015. On the other extreme, five regions (Massachusetts, USA; Vorarlberg, Austria;
Stockholm, Sweden; Southern-Kanto, Japan and North Brabant, The Netherlands) filed more than 500
applications per million of residents.
In sum, if determinants of productivity vary widely across space, it is not unreasonable to expect
productivity to be at least partially linked to regional characteristics. This brings the spatial dimension into
the productivity debate. An explicit focus on a subnational regional dimension must be an integral part of
the productivity discourse, as it can provide a unifying lens to connect regional policies to regional
productivity and wellbeing as well as aggregate national productivity performance.
THE SPATIAL DIMENSION OF PRODUCTIVITY © OECD 202018
5 Industry and firm productivity
determinants and their spatial
dimension
In trying to understand and explain productivity, a vast body of literature looks at individual firms, industries
or countries and does not consider the subnational (local or regional) variation in productivity performance.
Such perspective is most likely driven by the specifics of the modelling approaches that start with a
representative firm/technology (Coelli et al., 2005[23]) or a representative industry (Jorgenson and Stiroh,
2000[24]) and by data availability for empirical analyses (industry-level productivity compilations from
statistical agencies are the easiest to obtain). The productivity research that omits the spatial dimension
generally consists of the studies that try to explain firm-level productivity (or its growth), industry-level
productivity (or its growth) and the vast differentials in productivity levels/growth rates across firms between
and within (even narrowly defined) industries.
Regardless of the broad focus, the literature names a relatively narrow set of the factors and processes
crucial for productivity performance at the national, industry and firm levels. The most prominent of them
are described in a greater detail below. A summary of the (mostly international) economic studies on each
productivity driver is followed by a discussion of the spatial dimension of the corresponding determinant,
which demonstrates how productivity originates – to a varying degree – in the local and regional realities.
Technological advance and R&D
The mainstream economics discourse
Innovation is the basic prerequisite of a production activity – it makes production possible by generating
needed technology (Doms and Bartelsman, 2000[25]). A variety of economic growth models, which identify
the main productivity determinants1, recognise this fact. The models focus on technological progress and
innovation as the central sources of increased productivity at the firm-, industry- and national levels
(Romer, 1990[26]; Solow, 1956[27]; Schumpeter, 1942[28]). The empirical work also confirms the defining role
of the R&D and technological innovations in productivity growth (Griliches, 1979[29]; Griffith, Redding and
Reenen, 2004[30]; Keller, 2000[31]; Geroski, 1995[32]).
The advent and the penetration of the information and communication technologies (ICT) have reinforced
the general understanding that technological progress is a major driver of productivity growth (Jorgenson,
Ho and Stiroh, 2008[33]). The ongoing rapid development of new technologies, which lead to automation
and digitalisation of economic activity, suggests that the role of the R&D as a productivity determinant is
likely to grow in the future.
There are several ways technology contributes to productivity growth. First, knowledge-intensive industries
are on average more productive and their expansion contributes sizably to productivity. For example in the
U.S., productivity growth in manufacturing is predominantly accounted for by the computer and electronic
THE SPATIAL DIMENSION OF PRODUCTIVITY © OECD 2020 19
product manufacturing industry (Houseman, Bartik and Sturgeon, 2015[34]). Devices, equipment,
technologies and electronic applications produced by the knowledge-intensive industries increase
efficiency and profitability of companies utilising them. The surge in productivity in the late 1990s was
mostly attributed to the penetration of the ICT technologies (Jorgenson, Ho and Stiroh, 2008[33]).
Research and development naturally increase innovation but they also contribute to a greater absorptive
capacity of firms and industries allowing them to benefit more from innovative activities of other economic
actors (Geroski, Machin and Reenen, 2006[35]; Griffith, Redding and Reenen, 2004[30]). Existing empirical
studies consistently find that the R&D investments by firms explain a large part of differences in productivity
(Hall, Mairesse and Mohnen, 2010[36]), although the estimates of the R&D investment elasticity of
productivity (and returns to R&D in general) vary widely (Griliches and Séneca, 2000[37]; Mairesse and
Sassenou, 1991[38]). Despite the differences in the magnitude of the estimated effects, the literature is in
agreement that the positive effects of the R&D and innovation are larger for high-tech firms and in high-
tech or knowledge-intensive sectors (see, for example, Kancs and Siliverstovs (2016[39]); Tsai and Wang,
(2004[40]); Hall and Mairesse (1995[41]) and Verspagen, (1995[42])). When productivity growth is concerned,
the relationship is likely non-linear and a critical mass of knowledge needs to be accumulated before the
positive effects of the R&D are observable in the data (Kancs and Siliverstovs, 2016[39]).
A more recent – and still relatively scant – strand of research investigates the productivity effects of
automation and digitalisation, which only now are becoming prevalent. The general consensus so far is
that these processes are linked to increased productivity, although the causation is not clearly established
(Graetz and Michaels, 2018[43]; Koch, Manuylov and Smolka, 2019[44]; Sorbe et al., 2019[13]).
Several international studies report a positive effect of robotisation on industrial productivity. Using data on
17 developed countries, Graetz and Michaels (2018[43]) estimate that the use of robots has boosted labour
productivity growth by 0.36% annually over the 1993-2007 period. The authors also report increased TFP
and reduced output prises as a result of automation. Likewise, Kromann and co-authors (Kromann et al.,
2016[45]) find that one standard deviation increase in the robot-intensity index is associated with more than
5% increase in total factor productivity in nine countries during 2004-2007. Similarly, a positive association
between the robot adoption and productivity of manufacturing firms is documented by Dauth et al. (2018[46])
for Germany and by Kromann and Sørensen (2019[47]) for Denmark.
Although the existing empirical evidence on the productivity effects of automation is predominantly based
on the analysis of how industrial robots influence manufacturing firms, automation is likely to affect sectors
beyond manufacturing. The recent wave of developments in prediction algorithms, image recognition and
machine translation entails potential gains in productivity for various sectors (Agrawal, Gans and Goldfarb,
2019[48]; Varian, 2018[49]).
1. When it comes to the effects of digitalization on productivity, several cross country firm-level studies
report positive effects. Gal et al. (2019[14]) provide evidence that adoption of digital technologies in
an industry is linked to firm-level gains in productivity. The authors document the positive effects
of such technologies as cloud computing, customer relationship management and enterprise
resource planning systems. Similarly, Bailin Rivares et al. (2019[50]) find that expansion of online
platforms is associated with higher productivity of service firms.
2. The identification of the effect of digitalization on firm-level productivity is, however, complicated
by various confounding factors such as self-selection into technology adoption. Furthermore,
complementarities between digital technologies and organizational capital of firms can potentially
explain why some studies find no effect (Gal et al., 2019[14]). For instance, Acemoglu et al. (2014[51])
find no association between IT-intensity and productivity in manufacturing.
THE SPATIAL DIMENSION OF PRODUCTIVITY © OECD 202020
The spatial dimension
The technology adoption and the R&D intensity clearly differ by industry. Enterprises comprising an
industry, however, are located in space. The regional research has convincingly shown that geographical
proximity is important for knowledge exchange, cross-fertilisation of ideas and the R&D intensity, which
often happens in (spatially bounded) knowledge hubs. Such hubs can be industry-specific, but most often
they consist of companies, which belong to a range of (related) industries and sectors 2. The co-location
(even at a micro-level) can define knowledge intensity and productivity performance (Andersson, Larsson
and Wernberg, 2019[52]), although the literature suggests that various types of proximity (e.g. related and
unrelated) can be conducive to enhanced innovation and productivity depending on the specific conditions
(Boschma and Frenken, 2011[53]; Castaldi, Frenken and Los, 2015[54]).
Like innovation in general, the R&D and technological progress have a well-defined spatial dimension that
emerges via multiple channels. They include the presence of research universities, R&D labs and a
concentration of R&D-intensive industries; abundance of highly educated human capital; presence of
research support infrastructure and mechanisms, e.g. seed financing, venture capital, formal and informal
networks and others. These elements, when well-connected and functioning in a synergy, can form a
regional innovative system (RIS) that promotes and enhances the R&D and innovation within its borders.3
Besides promoting business formation directly, universities and research labs considerably contribute to
the knowledge-intensity of their host regions and innovativeness of the firms located therein. The literature
shows that the mechanisms of firm learning from universities are manifold and complex (Cohen, Nelson
and Walsh, 2002[55]; Laursen and Salter, 2004[56]). There is also some evidence that proximity to
universities tends to help innovative efforts by small and medium enterprises (SMEs), those that usually
would lack capacity to perform their own research (Acs, Audretsch and Feldman, 2006[57])4 but it is crucial
for firms to possess sufficient levels of absorptive capacity (Laursen and Salter, 2004[56]). Research-
intensive universities can bring global knowledge flows to their host regions by absorbing cutting-edge
international research and sharing its pieces relevant for businesses in proximity, which normally would
not be able to benefit from global knowledge creation independently (Fritsch and Schwirten, 1999[58]).
Highly successful research universities often serve as the focal point for a regional innovation system
development. The RIS approach emphasises the role of local factors and of their system-like interactions
in the innovative behaviour of and knowledge production by firms (Mason and Brown, 2014[59]). While
connections to the global knowledge pipelines are important for knowledge creation within the RIS, the
innovative activities of firms can be perceived as a locally driven process deeply influenced by local
networks and resources, including tacit and context-specific knowledge (Asheim and Isaksen, 2002[60]).
The spatial dimension appears to be important for the patterns of penetration/adoption and the productivity
effects of more recent technological advances such as automation, robotisation and digitisation. Although
the literature is still scant, it has already been argued that, for example, expertise in artificial intelligence
(AI) tends to concentrate in space with clusters expanding around the existing IT hubs and major research
departments (Goldfarb and Trefler, 2018[61]; Klinger, Mateos-Garcia and Stathoulopoulos, 2018[62]). The
availability of talent appears to be essential to the location decisions of the AI research units.
The recent advances in the AI research broaden the range of tasks that can be automated, although some
tasks are more prone to automation than others. As tasks and jobs embodying these tasks are unevenly
distributed in space, so is the risk of automation. The estimates of the share of jobs at risk of automation
across the OECD regions vary widely (OECD, 2018[19]), implying sizable regional differences in the
potential gains in productivity. Besides the spatial variation in tasks that can be automated, the degree of
regional exposure to automation is likely to be influenced by the existing industrial structures. For instance,
Dauth et al. (2018[46]) report that the penetration of industrial robots in German labour markets is linked to
the size of the manufacturing sector.
THE SPATIAL DIMENSION OF PRODUCTIVITY © OECD 2020 21 Apart from the existing industrial structure, the spatial variation in productivity gains from automation and digitalization is likely to further increase. There is growing evidence that the propensity to adopt automation and digitalisation technologies is related to firm characteristics, most importantly to firm size. For instance, in the case of automation, it has been shown that larger and more productive firms are more likely to adopt robots (Koch, Manuylov and Smolka, 2019[44]), to benefit from network externalities (Goldfarb and Trefler, 2018[61]) and to get better access to data (Cockburn, Henderson and Stern, 2018[63]). Likewise, larger firms are more likely to adopt such digital technologies as cloud computing (OECD, 2017[64]). At the same time, larger firms and more productive firms tend to concentrate in larger cities (Behrens, Duranton and Robert- Nicoud, 2014[65]), which means that the propensity of regions to rely on digital technologies and automation differs across space, and along the urban-rural continuum in particular. Knowledge diffusion The mainstream economics discourse After an innovation has generated a technology needed for the production activity, the diffusion and adoption of the technology determines productivity of each establishment, which, in turn, defines aggregate productivity of an industry or a country (Doms and Bartelsman, 2000[25]). Knowledge diffusion, therefore, is a central productivity-defining mechanism together with innovation. The technology and knowledge diffusion are becoming increasingly important in a globalised world where multinational enterprises (MNEs), foreign direct investments (FDIs) and global value chains (GVCs) emerge as the leading channels of knowledge sharing across regions and nations5. MNEs are generally expected to be the productivity leaders as it takes a superior technology, management and other firm-specific resources to stay competitive in foreign markets (Criscuolo and Martin, 2009[66]). Multinationals usually enter foreign markets via greenfield investments (where new companies are set up to operate in a country different from the location of headquarters) and via mergers and acquisitions (M&A) with local firms. The latter channel is substantially more common and may account for 80-90% of the FDI flows (Navaretti, Venables and Barry, 2006[67]; Stiebale and Reize, 2011[68]). As in the case of international engagement, the non-random process of firm selection for M&A and the self-selection of the headquarters into engaging in international activities complicates causal inference. Several studies seek to identify the impact of foreign ownership on productivity while properly accounting for endogeneity and other possible threats to validity of the estimates. The results tend to differ depending on the country and the industrial setting. For example, Arnold and Javorcik (2009[69]) report strong and lasting productivity-enhancing effects of foreign acquisitions on plant performance in Indonesia, which happen via restructuring, increased investments and other channels. In a group of advanced European countries, on the other hand, the effects are modest, are detectable with a multi-year delay and only if the majority stake is acquired (Fons-Rosen et al., 2013[70]). Divergent findings come also from the UK. A study by Bloom, Sadun and Van Reenen (2012[71]) finds that companies acquired by MNEs from the U.S. tend to exhibit better productivity performance. This effect is driven by a more efficient utilisation of information technology (IT) and by superior personnel management practices. In contrast, Criscuolo and Martin (2009[66]) argue that the productivity advantage of the U.S.-owned manufacturing companies in the UK is the result of acquisitions of already highly productive companies. Almeida (2007[72]) comes to a somewhat comparable conclusion in the analysis of employer-employee matched data on Portuguese firms. The author reports negligible effects of foreign acquisitions on human capital and wages of the target companies and concludes that foreign investors choose domestic firms that are already very similar to the foreign firms. One way for the international engagement to affect productivity is by the greater innovation of participating firms. Criscuolo, Haskel and Slaughter (2010[73]) look at the performance of the UK enterprises that are a THE SPATIAL DIMENSION OF PRODUCTIVITY © OECD 2020
22
part of MNEs (both British-based and foreign) or are engaged in the export activities. The authors contrast
these companies with the performance of purely domestic firms. The findings suggest systematic
differences in the knowledge production and innovative activities of the two types of companies with the
former employing more R&D staff, enjoying more inter-company learning and being more likely to patent
and to introduce innovations. The differences in innovative outputs, however, are mostly explained by the
variation in the amount of inputs, whilst global engagement accounts for a very small fraction of variation
in the innovative performance. Guadalupe, Kuzmina and Thomas (2012[74]) examine innovative behaviour
of 2,800 Spanish manufacturing firms and find that foreign ownership makes companies more likely to
innovate. This leads to productivity improvements via both better technologies and a more efficient
organisation of production. In contrast, Stiebale and Reize (2011[68]) estimate the effects of the cross-
border M&As on innovative performance of target small and medium enterprises (SMEs) in Germany. After
controlling for selection and endogeneity, the researchers find that foreign acquisitions tend to suppress
innovative activities and the average R&D expenditures.
Besides affecting the performance of the target firms, FDIs and MNEs can increase productivity of domestic
firms in the same or related industries via spillovers. An analysis of productivity gains among 1,300 U.S.
manufacturing firms by Keller and Yeaple (2009[75]) reveals that FDIs have strong technological within- and
across-industry spillovers and are able to increase productivity of domestic companies, particularly in the
high-tech sector. The positive effects are also stronger for small and less productive firms.
Finally, as production becomes increasingly fragmented across national borders, the role of GVCs as a
channel of knowledge diffusion becomes more salient. MNEs play an important role in proliferation and
shaping of global value chains, which grow in complexity and can be based on multiple integration
mechanisms, from forward and backward linkages to outsourcing (Criscuolo and Timmis, 2017[76]).
Although the literature is still scarce, it is clear that the GVC engagement can affect productivity in many
ways. For the firms participating in GVCs, efficiency can be improved via integration in international trade,
specialisation, offshoring, knowledge sharing and scaling up. There are also substantial inter-industry
spillovers for enterprises not directly involved in GVCs. The spillovers happen via knowledge diffusion
within supply chains (mostly backward linkages (Havranek and Irsova, 2011[77])), and other channels.
The FDIs, MNEs and GVCs are by definition international6. When making location decisions, MNEs
consider a host of national factors such as regulatory and legal frameworks, labour market regulations,
protection of property rights and contract enforcement among others. There is evidence, however, that the
preferences of MNEs for the national aspects are highly heterogeneous and depend to a large degree on
a sector and business function (Ascani, Crescenzi and Iammarino, 2016[78]).
The spatial dimension
At the subnational level, the local dynamics is important for knowledge diffusion across both regions and
firms. For example, the literature documents a growing importance of local assets for the location choices
of MNEs (Crescenzi, Pietrobelli and Rabellotti, 2016[79]; Iammarino and McCann, 2013[80]). This is
particularly true for the high value added activities within the GVCs, which centre around regional
production clusters (Criscuolo and Timmis, 2017[76]) and for the high-tech MNEs, which are attracted to the
local expertise and knowledge (Crescenzi, Pietrobelli and Rabellotti, 2014[81]).
As a result, the inter-regional knowledge diffusion within the global pipelines, of which MNEs and GVCs
are the central conduits, is increasingly seen via the global-local perspective. This perspective blends the
patterns of knowledge diffusion and regional development as an interrelated and simultaneous process
(Crescenzi and Iammarino, 2017[82]). MNEs break a complex productive process of value creation into a
multitude of stages and components (ranging from functions to specific transactions). The components are
placed across the globe where they can be carried out most efficiently. The location selection takes into
THE SPATIAL DIMENSION OF PRODUCTIVITY © OECD 2020 23 account the ability of GVC and MNEs to tap into local and regional intangible assets and knowledge bases relevant to each specific function or transaction. The intangible assets specific to a region are embedded in its human capital, local networks and a critical mass of innovation actors (Kramer et al., 2011[83]) and can become central sources of competitive advantages for the MNEs (Cantwell and Iammarino, 2005[84]; Molero and Garcia, 2008[85]). Attracted by regional characteristics, MNEs can spread international expertise and best practices to local economy, although there are also concerns over knowledge sourcing by MNEs, which can undermine local knowledge bases (De Propris and Driffield, 2005[86]). The empirical research documents the increased productivity of domestic firms in the regions of FDIs for a number of sectors but highlights that these effects are unlikely to travel past regional borders (Girma and Wakelin, 2007[87]; Higoacuten and Vasilakos, 2011[88]). At the regional level, the concentration of multinationals in the US commuting zones appears to increase value added, wages (for higher-paid workers) and employment (Setzler and Tintelnot, 2019[89]) but an appropriate level of pre-existing absorptive capacity is needed for a region to be able to benefit from the FDIs (De Propris and Driffield, 2005[86]). For the knowledge-intensive operations of the MNEs, regions with a solid knowledge and research base are more attractive. Local knowledge hubs, often centered around local universities, may play a pivotal role in attracting the R&D-related operations of the MNEs and high value added activities within the GVCs (Broström, Mckelvey and Sandström, 2009[90]). The evidence on the link between FDIs and local innovation output of their host regions suggests that there can be both positive and negative spillovers depending on the FDI types (Ascani and Morrison, 2019[91]). Universities often facilitate the inter-firm knowledge diffusion as well, in particular when active technology transfer offices are in place. As universities increasingly take up the role of the local economic growth engines, their TTOs are engaged in a range of activities from licencing out university-generated technologies to launching innovation parks and other incubators for business. The economic effects of such activities appear to be sizable. For the U.S., a recent report estimates that the contribution to the GDP of the non-profit inventions coming from universities and research centres ranged from 148 billion to 591 billion, in 2009 U.S. dollars, over the 1996-2015 period (Pressman et al., 2017[92]). Overall, the diffusion of knowledge happens via multiple channels, such as labour mobility, interactions with suppliers, clients and competitors, licencing, tapping into the “local buzz”, observing actions of others as well as participation in various networks. Again, many of these channels are localised. For example, specific suppliers can concentrate in spatially bounded clusters, high-skilled labour is likely to gravitate to areas with certain level of amenities, and decisions to locate in new markets are often driven by the presence of other MNEs in the area. Business churn and competition The mainstream economics discourse Innovation, in addition to increasing productivity of the innovating firms, intensifies competition, which forces incumbents to become more efficient and facilitates reallocation of resources from less efficient to more efficient businesses within the economy. In line with the argument of creative destruction, where new innovative firms replace the less innovative incumbents (Schumpeter, 1942[28]), innovation and technological evolution are often modelled as a process of adoption of new products and processes, which inevitably leads to the destruction of their old counterparts (Foster, Haltiwanger and Krizan, 2001[93]). A variety of theoretical models within this tradition shows how greater business entry and exit (churn) can be productivity-enhancing. In the model by Aghion and Howitt (1990[94]), for example, innovator firms enter THE SPATIAL DIMENSION OF PRODUCTIVITY © OECD 2020
You can also read