PHYSICAL CLIMATE SCIENCE SINCE IPCC AR4 - A BRIEF UPDATE ON NEW FINDINGS BETWEEN 2007 AND APRIL 2010 - DIVA
←
→
Page content transcription
If your browser does not render page correctly, please read the page content below

TemaNord 2010:549
                          Store Strandstræde 18
                          DK-1255 Copenhagen K
                          www.norden.org

                                                                                                                                 Physical Climate Science since IPCC AR4
                                                                                                                                 A brief update on new findings between 2007 and April 2010

                          Physical Climate Science since IPCC AR4
                          A brief update on new findings between 2007 and April 2010
                          This report provides an update of the IPCC Fourth Assessment Report (AR4),
                          focusing on the physical climate system that in the IPCC work is addressed
                          by its Working Group I. The report considers progress in understanding of
                          the human and natural drivers of climate change, climate observations, attri-
                          bution, key climate feedback, as well as ocean acidification. Recent develop-
                          ments and near future prospects of climate modelling are also discussed in
                          brief. Some of the key findings that the recent literature brings forth include:

                          •   Parts of the Greenland and Antarctic ice sheets have shown rapid melt
                              over recent years.
                          •   Solar cycle effects on global temperatures are small compared to anth-
                              ropogenic forcing
                          •   More emerging research on the ”other CO2 problem”, ocean acidifica-
                              tion
                          •   Climate change may have significant effects on natural carbon sinks

                          The report is written by four leading Nordic climate scientists: Markku
                          Rummukainen, Jouni Räisänen, Jens Hesselbjerg Christensen and Halldór
                          Björnsson on behalf of the Nordic ad hoc Group on Global Climate
                          Negotiations. The Nordic ad hoc Group on Global Climate Negotiations pre-
                          pares reports and studies, conducts meetings and organises conferences to
                          support the Nordic negotiators in the UN climate negotiations. The overall
                          aim of the group is to contribute to a global and comprehensive agreement
                          on climate change with ambitious emission reduction commitments.

                          TemaNord 2010:549
                          ISBN 978-92-893-2078-8

TN2010549 Omslag.indd 1                                                                                                                                                                       21-05-2010 14:37:12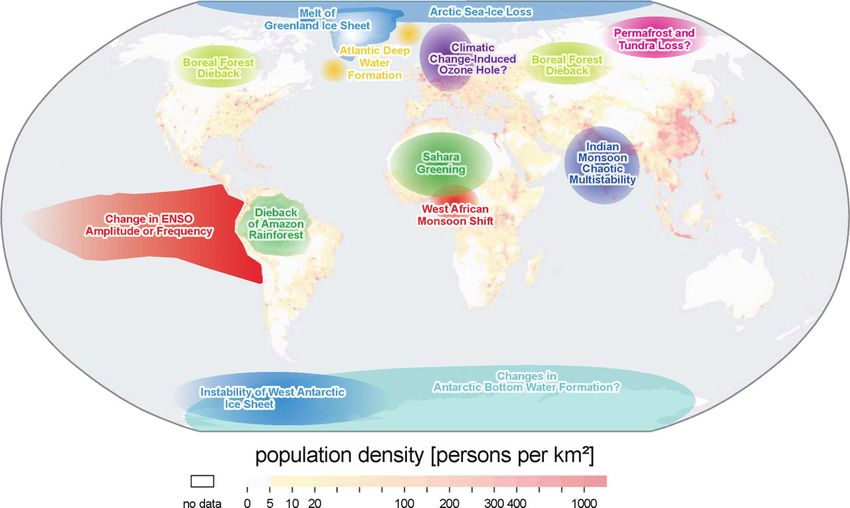
Physical Climate Science
since IPCC AR4
A brief update on new findings between
2007 and April 2010

Markku Rummukainen, Lund University, Sweden
Jouni Räisänen, University of Helsinki, Finland
Halldór Björnsson, Veðurstofu Íslands, Iceland
Jens Hesselbjerg Christensen, Danish Meteorological Institute,
Denmark

TemaNord 2010:549
Physical Climate Science since IPCC AR4
A brief update on new findings between 2007 and April 2010

TemaNord 2010:549
© Nordic Council of Ministers, Copenhagen 2010
ISBN 978-92-893-2078-8
Print: Kailow Express
Cover photo: ImageSelect
Copies: 400

Printed on environmentally friendly paper
This publication can be ordered on www.norden.org/order. Other Nordic publications are available
at www.norden.org/publications

Printed in Denmark

Nordic Council of Ministers                 Nordic Council
Ved Stranden 18                             Ved Stranden 18
DK-1061 København K                         DK-1061 København K
Phone (+45) 3396 0200                       Phone (+45) 3396 0400
Fax (+45) 3396 0202                         Fax (+45) 3311 1870

www.norden.org

Nordic co-operation
Nordic co-operation is one of the world’s most extensive forms of regional collaboration, involving
Denmark, Finland, Iceland, Norway, Sweden, and three autonomous areas: the Faroe Islands, Green-
land, and Åland.

Nordic co-operation has firm traditions in politics, the economy, and culture. It plays an important
role in European and international collaboration, and aims at creating a strong Nordic community in a
strong Europe.

Nordic co-operation seeks to safeguard Nordic and regional interests and principles in the global
community. Common Nordic values help the region solidify its position as one of the world’s most
innovative and competitive.
Content
Preface................................................................................................................................ 7
Summary ............................................................................................................................ 9
Introduction ...................................................................................................................... 11
1. Some physical climate system science reviews since IPCC AR4................................. 13
1.1 Synthesis Report from the International Congress on Climate Change, Global
Risks, Challenges & Decisions ....................................................................... 13
1.2 The Copenhagen Diagnosis.................................................................................. 13
1.3 News in Climate Science and Exploring Boundaries ........................................... 13
1.4 AMAP 2009. Update on Selected Climate Issues of Concern and the Snow, Water,
Ice and Permafrost in the Arctic-Project ......................................................... 14
1.5 New Climate Science 2006–2009......................................................................... 14
2. Observed climate changes ............................................................................................ 15
2.1 Global mean temperature change ......................................................................... 15
2.2 Sea level ............................................................................................................... 18
2.3 Cryosphere ........................................................................................................... 19
3. Ocean acidification and the marine carbon cycle ......................................................... 23
4. Observed and Projected Extremes ................................................................................ 25
4.1 Temperature extremes .......................................................................................... 25
4.2 Heavy precipitation and droughts......................................................................... 26
4.3 Tropical cyclones ................................................................................................. 27
4.4 Extratropical storms ............................................................................................. 27
4.5 Other categories of extreme events ...................................................................... 28
5. Radiative forcing .......................................................................................................... 29
5.1 Greenhouse gas concentrations ............................................................................ 29
5.2 Particles................................................................................................................ 31
5.2.1 Trends .................................................................................................... 32
5.2.2 Soot ........................................................................................................ 32
5.2.3 Secondary Organic Aerosol.................................................................... 33
5.2.4 Aerosol climate forcing.......................................................................... 34
5.3 Land cover change ............................................................................................... 34
5.4 Solar effects.......................................................................................................... 36
5.4.1 Solar irradiance variability and climate forcing ..................................... 36
5.4.2 Galactic cosmic rays, clouds and climate ............................................... 39
6. Attribution and internal variability ............................................................................... 43
6.1 Attribution of observed climate changes .............................................................. 43
6.1.1 Changes in mean surface temperature .................................................... 44
6.1.2 Changes in ocean temperature................................................................ 45
6.1.3 Changes in the hydrological cycle.......................................................... 45
6.1.4 Changes in extremes .............................................................................. 46
6.2 Internal variability ................................................................................................ 47
7. Climate change projections and scenarios .................................................................... 51
7.1 Climate and Earth system sensitivity.................................................................... 51
7.2 Feedback .............................................................................................................. 54
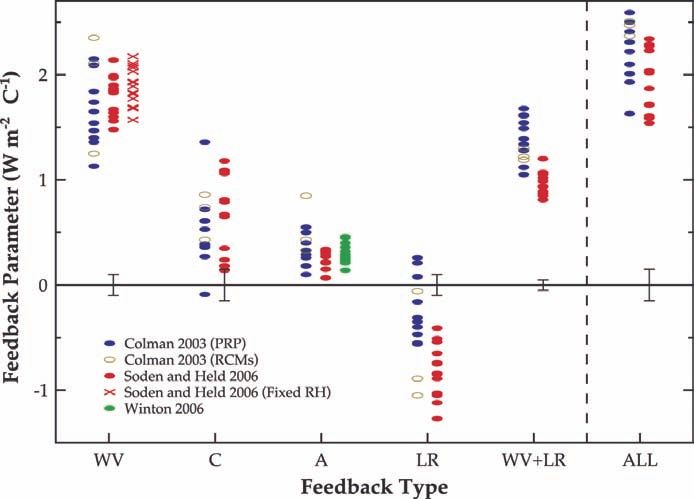
7.2.1 Water vapour and cloud feedback .......................................................... 54
7.2.2 Climate-carbon feedback........................................................................ 56
7.2.3 Climate-Atmospheric chemistry feedback ............................................. 576 Physical Climate Science since IPCC AR4 – A brief update
8. Climate projections, new emission scenarios (RCPs) and climate prediction ...............59
8.1 Global climate modelling......................................................................................59
8.2 Climate prediction.................................................................................................60
8.3 Regional climate modelling ..................................................................................62
9. Tipping points ...............................................................................................................65
10. Science of stabilisation................................................................................................69
10.1 Climate stabilisation targets ................................................................................69
10.2 Climate change commitment ..............................................................................70
Sammanfattning ................................................................................................................73
References and notes.........................................................................................................75Preface
The Nordic Ministers of Environments established the Nordic COP 15
Group early in 2008. In January 2010 the group was renamed to the Nordic
ad hoc Group on Global Climate Negotiations. The main tasks of the group
are to prepare reports and studies, conduct relevant meetings and organize
conferences supporting the Nordic negotiators in the UN climate negotia-
tions. The overall aim of the group is to contribute to a global and compre-
hensive agreement on climate change with ambitious emission reduction
commitments.
This report provides an update of the IPCC Fourth Assessment Report
(AR4), focusing on the physical climate system that in the IPCC work is
addressed by its Working Group I. The report considers progress in under-
standing of the human and natural drivers of climate change, climate obser-
vations and attribution and key climate feedback, ocean acidification. De-
velopments and near future prospects of climate modeling are also discussed
in brief.
The report is written by four leading Nordic climate scientists: Markku
Rummukainen, Jouni Räisänen, Jens Hesselbjerg Christensen and Halldór
Björnsson. The focus is on the physical climate system and climate change
science. The overall volume of international climate research and new find-
ings does not allow a fully comprehensive account of all new findings. The
aim has been to provide an educated and representative account on new
findings over the past four years of scientific research on the physical cli-
mate system of key relevance to contemporary climate change.
We would like to thank the authors as well as Professor Jean-Pascal van
Ypersele and Professor Frank Raes who have conducted a review of the
report. The authors are responsible for the content of this report. The views
expressed and conclusions drawn do not necessarily reflect those of the
Nordic Ad Hoc Group on Global Climate Negotiations.
Stockholm May 2010
Olle Björk
Chair of the Nordic Ad Hoc Group on Global Climate NegotiationsSummary Since IPCC AR4 in 2007, climate science has made continual progress for more than three years. This is reflected both in the number of new scientific papers, but also in the development of the research agenda. By and large, the physical climate science as assessed by IPCC Working Group I in AR4 ap- pears robust in the light of more recent research. The knowledge base is of course continuously developing. For example, there has been clear progress on research questions such as ocean acidification and Earth system feed- back. Some of the key findings that the recent literature brings forth include: Signs of continued climate change are evident. Warming in the last few years has not been as strong as in the years immediately before, but this falls within expected short-term variations due to e.g. internal climate system variability The global sea level also continues to rise. Recent estimates of the future sea level rise indicate values beyond the higher end of the AR4 range. Due to persisting limitations in modelling ice sheet dynamics, many of these more recent studies are based on semi-empirical modelling or inferences from past climates The 2007 summer Arctic sea ice minimum was not followed by yet lower amounts, but the long-term trend is unchanged, towards continued reductions in sea ice Parts of the Greenland ice sheet have shown rapid melt over recent years. It is not well-established whether this is a temporary phenomenon or signals a long-term trend. The Antarctic ice sheet is also losing mass The so-called other CO2 problem, ocean acidification, is becoming more extensively studied. Whereas the acidity increase of ocean water is fairly easy to quantify for a given rise in atmospheric CO2, the impacts on marine systems are not well understood There is no firm evidence of major changes in tropical cyclone behaviour resulting from global warming, although with continued global warming some gradual intensification of the strongest cyclones is possible After quite a few years of no significant changes since the early 1990s, the atmospheric methane concentration has exhibited renewed growth since 2007 Solar cycle effects on global temperatures are small and even though it is possible that we are entering a prolonged period with low solar
10 Physical Climate Science since IPCC AR4 – A brief update
activity, this will at best temporarily slow down future warming. The
galactic cosmic ray/clouds/climate hypothesis remains unproven
Warming has now also been detected over some of the Antarctic ice
sheet. Observed Arctic warming has been difficult to attribute to
anthropogenic global warming due to the large natural variability in
the region. Such attribution has now progressed. Attribution studies
have in general started to address scales smaller than the global or
continental scales, as was the case in AR4, and a wider range of
variables in addition to temperature
Estimates of climate sensitivity remain essentially unchanged since
AR4
The CO2 concentration may increase more for a given amount of
global emissions than previously assessed, in light of new studies on
the climate-carbon feedback and the possibility of climate change
reducing the efficiency of natural carbon sinks
A positive climate-carbon feedback reduces any “allowable emission
space”, in the sense that when targeting some atmospheric
stabilisation level, or some specific temperature target, the total
emissions must be less than if the carbon cycle did not react to climate
changeIntroduction
The science of the physical climate system underlies our understanding of
how our actions may affect the climate, as well as providing constraints on
efforts to limit climate change. Available knowledge, at any time, consists of
robust findings and various uncertainties. The latter represent limits to our
knowledge and are as important to policy-makers as those aspects that are
scientifically well-established. Research successively transfers uncertainties
into more robust knowledge, but also leads to new questions. Sometimes,
knowledge that previously has been seen as robust (well established) may
undergo important revisions.
The scientific process is continuously ongoing. New pieces are con-
stantly added, earlier ones are tested anew and some perhaps replaced. New
scientific findings, especially the most recent, need to be examined and
placed in context with earlier knowledge. This can be done through reviews
that update scientific knowledge in some specific field. Such reviews make
frontline research available to policy-makers more readily than findings
published in articles in scientific journals. Any knowledge update is never-
theless conditional on new findings.
The current report provides an update on the science of the physical cli-
mate system. The review builds on peer-reviewed scientific literature pub-
lished since the Working Group I report in the Intergovernmental Panel on
Climate Change Fourth Assessment Report (IPCC AR4) of 2007 1 . Some
reviews of this kind have recently been published 2,3,4,5,6 . We provide a brief
commentary on these.
Our review covers recent observations on the climate system, natural and
anthropogenic climate forcing, climate system sensitivity and Earth system
feedback, specific issues such as sea levels and the cryosphere, as well as
projections of climate change over the 21st century. Recent findings are
discussed against the backdrop of the AR4 assessment and thus the pre-2007
literature.
Physical climate system science as such is thoroughly policy-relevant,
but there is also a need to frame the discussion with directly relevant climate
policy issues. Consequently, we discuss briefly how physical climate system
science relates to climate stabilisation issues, via climate sensitivity, feed-
back within the climate system and climate system inertia issues.1. Some physical climate system
science reviews since IPCC AR4
1.1 Synthesis Report from the International Congress on
Climate Change, Global Risks, Challenges & Decisions
A large scientific climate change symposium was held at the University of
Copenhagen in March 2009. It covered many aspects of climate change
research, the physical climate system aspects being just a part of the scien-
tific programme2.
1.2 The Copenhagen Diagnosis
The Copenhagen Diagnosis3 was written by 26 authors, and published in
November 2009 by the University of New South Wales (UNSW) Climate
Research Centre. Their stated aim was to “synthesize the most policy-
relevant climate science published since the close-off of material for the last
IPCC report”, on the eve of the Copenhagen climate talks in December
2009.
Compared to AR4, the Copenhagen Diagnosis has an added emphasis on
larger-than-expected ongoing and future changes. The spotlight is not least
on new science, according to which ice-sheets, glaciers and ice caps show
accelerating melting, as does the summer-time Arctic sea ice cover. The
authors also conclude that future dynamical changes changes in ice sheet
melting might increase the global sea level rise by 2100 to around twice that
stated in AR4. In AR4 this factor was excluded from the estimates due to
rather limited understanding.
1.3 News in Climate Science and Exploring Boundaries
The Netherlands Environmental Assessment Agency was tasked by the
Dutch Environment Minister to look into new scientific findings since AR4.
Their report4 came out in November 2009. The authors build on around
1000 scientific articles. The report touches on the scientific domains of each
of the three Working Groups of the IPCC, with the overall finding that AR4
remains a valid scientific basis for climate policy.
At the same time, the report noted indications of faster changes than pre-
viously projected, as well as of more severe impacts. In terms of physical
climate science, these concerned more or less the same phenomena as noted14 Physical Climate Science since IPCC AR4 – A brief update
in the Copenhagen Diagnosis: greater ice sheet melt, higher sea level rise
and faster Arctic sea ice reduction compared to the assessments in AR4.
Another difference was the fairly explicit mention of the possibility that we
might be facing a period of very low solar activity, which could give rise to
a cooling effect of around 0.2°C over the next 2–3 decades. Should this hap-
pen, the anthropogenic warming trend would be somewhat less obvious over
the same period, but still clearly discernible. The longer-term prospects of
continued global warming would not be affected.
1.4 AMAP 2009. Update on Selected Climate Issues of
Concern and the Snow, Water, Ice and Permafrost in the
Arctic-Project
The Arctic Council’s Arctic Monitoring and Assessment Programme (AMAP)
published a brief report5 in 2009 on recent observations and some science
issues of particular relevance for the Arctic region (such as climate forcing of
soot, tropospheric ozone and methane, and the Arctic carbon cycle). The re-
port did not refer extensively to published literature. Attention was drawn not
least to the continued warming signals in data collected in the Arctic region,
along the lines outlined in AR4 and in the ACIA assessment of 2005.
Under this heading, we also make note of the Snow, Water, Ice and Per-
mafrost in the Arcti c (SWIPA) project 7 , set up by the Arctic Council in
April 2008, whose aim is to assess new scientific information on changes in
the Arctic cryosphere (ice, snow, and permafrost). The report is expected to
be finalised in 2010.
In a first report, concerning the Greenland ice sheet 8 , the contribution to
sea-level rise from melting of the Greenland ice sheet was considered,
among other issues. One of the findings is that there is a contribution to sea
level rise, assessed to be around 10–20% (i.e., 0.3–0.5 mm) of the 3 mm
observed global sea level rise each year. The report also states that the rapid-
ity of ice sheet changes and hence their future contribution to sea level rise
is highly unknown and is directly related to our understanding of processes
accelerating ice streams and fast-moving glaciers.
1.5 New Climate Science 2006–2009
The Swedish government’s Commission on Sustainable Development com-
missioned a brief climate science update6 in 2009. The update considered
about 120 articles more recent than AR4, in the area of physical climate
science. The overall assessment was that more recent research confirms
earlier research findings, and also adds some new knowledge. It was noted
that many new findings were emerging, not least in respect of sea level rise,
land ice sensitivity to global warming and Arctic sea ice.2. Observed climate changes The IPCC’s AR4 (WG I SPM, page 5) noted that Warming of the climate system is unequivocal, as is now evident from observations of increases in global average air and ocean temperatures, widespread melting of snow and ice, and rising global average sea level. Since then, a few years’ worth of observations have been added to the data, which is discussed below. 2.1 Global mean temperature change In AR4 it was established that the global average surface air temperature increased by approximately 0.74°C during the period 1906 to 2005. A pe- riod of particularly rapid warming commenced in the mid-1970s. For the years 1979–2005, a warming trend of 0.17°C per decade was reported. Since 2005, the warming has slowed down, which is very probably a temporary development. The global mean temperature has remained high. The years 2001–2009 are all among the 11 warmest in the instrumental re- cord (Figure 1). It should be noted here that the magnitude of the global warming trend is expected to vary from year to year, despite being unambi- guous over time. A decade is still a short period when it comes to the cli- mate. Nevertheless, the most recent decade is discussed below, both to pro- vide an update on global temperature data and to elucidate the apparent lack of a continued warming trend. Figure 1. Average global temperature anomalies (with respect to the 1961–90 average) since 1850 according to the Climatic Research Unit (CRU) HadCRUT3 data set. ( © Copyright 2010, CRU, University of East Anglia.)
16      Physical Climate Science since IPCC AR4 – A brief update

Estimates of the global mean surface air temperature that are based on peer-
reviewed methods are maintained by three research groups. These use
slightly different data sets and averaging methods. This leads to modest
differences in the specific annual values (Figure 2). For example, 2009 was
the 6th warmest year on record according to the CRU 9 and NCDC 10 analy-
ses, but the second warmest according to GISS 11,12 . All three analyses show
that the rate of warming has stalled since 2005. As already mentioned, for
brief periods the warming rates may vary considerably from the long-term
trend, although these variations tend to be short-lived.
     In IPCC AR4, projections of 21st century temperature changes were
based on simulations made by 21 global climate models 13,14 forced with a
range of non-climate-policy scenarios with the 20-year mean temperature
for 1980–1999 as a baseline. For the four-year period 2006–2009, the ob-
served global mean temperature rise (0.24–0.28°C) from this baseline has
been slightly lower than the average simulated by these models (0.42°C,
Figure 2). However, the observed change is still well within the variation
between the model results. In fact, in three of the 21 models the warming
from 1980–1999 to 2006–2009 was less than the observed warming. Part of
the explanation for short-term differences between observed and modelled
trends might lie in the incomplete coverage of the observations. A reanaly-
sis 15 -based study covering global land areas suggests that, on average, recent
warming has been more rapid at high northern latitudes where few observa-
tions are available than what is suggested in climatologies based on station
observations (e.g. Figure 1) 16 .
     Of course, the global mean temperature is not expected to rise steadily
from one year to the next, due to natural climate variability. Part of the natu-
ral variability is caused by variations in solar activity and by volcanic erup-
tions. For example, a temporary cooling was observed after the Mt. Pinatubo
eruption in 1991, whereas low solar activity may have affected the lack of
warming in the last few years 17 . Recently, it has also been proposed that
variations in the stratospheric water vapour concentration (a decrease since
2000 preceded by an increase in the previous two decades) might partly
explain the apparent variations in the global warming trend over the last few
decades 18 .
Physical Climate Science since IPCC AR4 – A brief update 17 Figure 2. Recent changes in global mean temperature according to three analyses of obser- vations (HadCRUT3, GISS and NCDC) and the 21 climate model simulations without climate policies used in IPCC AR419 . The mean of the model results is given by the solid black line. The shading indicates a 5–95% range of variability according to the same model simulations. The temperatures are given as deviations from the mean value over the period 1980–1999. Significant natural variability is also generated by internal fluctuations within the climate system, particularly in the oceans. 1998, with its excep- tionally strong El Niño warming in the tropical Pacific still stands out as the year with the highest global mean temperature in one of the three observa- tional analyses, whereas the relative coolness of 2008 coincided with a La Niña event, which is the opposite of an El Niño. Internal climate variability has limited predictability, and the path of in- ternal variability that arises in climate model simulations varies across model runs. Consequently, the multi-model mean temperature evolution is much smoother than observed (Figure 2). On the other hand, the model spread compares rather well with the observed variability. Another impor- tant notion is that individual model simulations that show pronounced long- term warming 20 include decade-long periods with little simulated warming, akin to what has characterised the last decade. The last decade is the warmest in the instrumental record. The global mean trend over the last decade has been quite small, but this fits well with our understanding of internal climate system variability, possibly with some amount of natural climate forcing (such as solar forcing – see Section 5.4). Periods of very small global temperature change are also evident in climate model simulations that overall show a clear warming trend as a response to anthropogenic forcing. It does not seem that climate models systematically overestimate the warming that can be expected in the future. Still, detailed understanding of observed temperature records on decadal time scales remains a challenge. By measuring the net incoming and outgo-
18        Physical Climate Science since IPCC AR4 – A brief update

ing radiative energy at the top of the Earth’s atmosphere, it is in principle
possible to determine how much energy remains in the Earth system. But
where exactly does the energy go? The main energy reservoir is the ocean,
which sequesters energy as heat. Because energy is exchanged between the
atmosphere and the ocean, this heat can resurface at a later time to affect the
global climate. A change in the overall energy balance will thus sooner or
later have consequences for the climate. Based on existing observational
evidence, it is still not possible to fully account for energy partitioning over
time in the climate system 21 .

2.2 Sea level
AR4 (WGI, SPM, page 5) noted that

     Global average sea level rose at an average rate of 1.8 [1.3 to 2.3] mm per year over
     1961 to 2003. The rate was faster over 1993 to 2003: about 3.1 [2.4 to 3.8] mm per
     year. Whether the faster rate for 1993 to 2003 reflects decadal variability or an in-
     crease in the longer term trend is unclear.

And (WGI, Chapter 10, page 750–751)

     Sea level is projected to rise between the present (1980–1999) and the end of this
     century (2090–2099) under the SRES B1 scenario by 0.18 to 0.38 m, B2 by 0.20 to
     0.43 m, A1B by 0.21 to 0.48 m, A1T by 0.20 to 0.45 m, A2 by 0.23 to 0.51 m, and
     A1FI by 0.26 to 0.59 m. These are 5 to 95% ranges based on the spread of AOGCM
     results, not including uncertainty in carbon cycle feedbacks. … further accelerations
     in ice flow of the kind recently observed… could substantially increase the contribu-
     tuion from the ice sheets… Understanding these effects is too limited to assess theur
     likelihood or to give a best estimate.

In AR4 the sea level rise for the 20th century was estimated at 1.7±0.5 mm
per year 22 , with an increased rate towards the end of the century; the rate of
sea level rise between 1993 and 2003 was estimated at 3.1±0.7 mm. Over
the few more recent years of 2004–2007/2008, the rate of sea level rise has
decreased somewhat, by around 15%, which still well exceeds the 20th cen-
tury rate 23,24 . However, new results from the GRACE (Gravity Recovery
and Climate Experiment) satellite gravity mission show that the rate of mass
loss for the Greenland and Antarctic ice sheets is increasing 25 (see Section
2.3). In AR4, the sum of estimates of the contributions to sea level rise from
thermal expansion and the melting of glaciers, ice caps and ice sheets fell
short of the observed rise. Studies since then have greatly reduced this
gap 26,27,28 . The sum of the contributing effects now matches the observed
total rise much better, signalling improved understanding of the mechanisms
behind sea level rise.
    Projections of future sea level rise depend on the emission scenario, al-
though in the short run, this dependence is moderated by the long response
Physical Climate Science since IPCC AR4 – A brief update 19
times of the oceans and ice sheets. In AR4, projections of sea level change
from 1990 to 2095 spanned a range of 0.18–0.38 m for the lowest (B1) and
0.26–0.59 m for the highest (A1FI) scenario. A large proportion of the esti-
mated sea level rise was due to thermal expansion of sea water. The results
did not incorporate the possibility of a rapid increase in the discharge from
ice sheets as has recently been observed in many outlet glaciers in
Greenland. It was concluded that our understanding of the salient dynamical
processes within ice sheets is too limited to address possible rapid changes
in discharge. But it was noted that if such processes increase in line with
warming, then a further 0.1–0.2 m sea level rise could ensue.
The realisation that ice sheets are playing a larger role in current sea level
rise, and that their past role may have been underestimated, suggests that the
contribution of ice melt to future sea level rise may be greater than projected
in AR4. It has also been noted that the earlier projected global mean sea
level rise was only 60% of the actual sea level rise from 1990–2006 29 .
New methods of relating observed variations in global sea level and
changes in global temperature support the idea that the projections in AR4
may have been too conservative. Empirical studies 30,31,32 suggest that the
AR4 climate change scenario range could imply projections for sea level
rise of 0.8 to 1.8 m for the 21st century. Generally similar estimates have
been reported in studies using other methodologies 33,34,35 . A particular
study 36 suggests that during the previous interglacial period 125,000 years
ago, the global sea level might have risen by as much as 6.6–9.4 metres,
which exceeds some previous estimates, as a response to a global mean
warming of perhaps only as little as 1–2°C, pointing to relatively extensive
melting of the ice sheets. It should be noted, however, that the sea level rise
during the last interglacial period was a slow process, perhaps of the order of
6–9 metres per 1000 years. Past climate events are not necessarily good
analogues for our own time. Nevertheless, along the lines of the studies dis-
cussed above, it was concluded in a recent review 37 that
global sea level rise could significantly exceed 1 m by 2100.
2.3 Cryosphere
In AR4, an extensive review was made of changes in the cryosphere, i.e. of
frozen water in various forms, such as snow, river and lake ice, ground ice,
sea ice, floating ice shelves, glaciers and ice caps and ice sheets. This in-
cluded a discussion of ice sheet melt, decreasing Arctic sea ice cover, warm-
ing permafrost and reduced snow cover in the Northern hemisphere spring.
It was also noted that no apparent changes were evident in sea ice in the
Antarctic region 38 .
Since then, in 2007, Arctic sea ice cover exhibited an unprecedented Sep-
tember minimum of 4.3 million km2 39,40,41 . This remains the all-time low,
even though the minima in 2008 and 2009 were also severe (see Figure 3).20 Physical Climate Science since IPCC AR4 – A brief update
One way to express this is by noting that whereas the trend in the reduction
in late-summer Arctic sea ice cover was 0.6±0.20 million km2 per decade
between 1979 and 2005, the trend increases to 0.79±0.22 million km2 per
decade when the subsequent years are accounted for.
Figure 3. Changes in Arctic sea ice extent from1979 to 2009. The upper panel shows results
for February and the lower panel for September (when the ice extent is at its seasonal mini-
mum). The circles indicate monthly means, while the blue curve shows decadal variations.
The thin dashed line indicates the linear trend, which is 0.44 (±0.10) 106 km2 per decade for
February and 0.79 (±0.22) 106 km2 per decade for September. These numbers correspond
approximately to a declineof 2.9% and 11.9% per decade, respectively. (Expanded and up-
dated from Fig. 4.9 in AR4, using sea ice data from NSIDC.)
Figure 3 shows time series of the sea ice extent for February and September.
The decline documented in AR4 has continued. Furthermore, the fraction of
multi-year ice has decreased and a larger proportion of the area covered by
sea ice is now occupied by younger ice 42 .
In AR4, a continued decline in sea ice extent was projected. It was con-
sidered likely that towards the end of the 21st century very little sea ice
would remain during summer. As the observed summer decline in recent
years is greater than what had been projected by climate models 43 , there has
been some debate on whether or not the last few years’ developments signal
a faster sea ice melt than foreseen earlier 44,45,46 . This remains to be seen.
Significant advances have been made since AR4 in estimating mass
changes in the ice sheets in Antarctica and Greenland. In AR4 altimetry
measurements were reviewed both from Greenland and Antarctica. The
results indicate thinning due to increased melting on the margins of the ice
sheets, but also of thickening in the interior due to increased accumulation.
The net changes were found to be relatively small, especially in Antarctica.
Results from the GRACE mission have since provided evidence that also
some areas in the western parts of the Antarctic ice sheet are losing mass, as
well as that the rate of mass loss has increased in recent years25,47 . GRACEPhysical Climate Science since IPCC AR4 – A brief update 21
measurements also show extensive mass loss in Greenland 48 . Between early
2002 and early 2009, the Greenland ice sheet is estimated to have lost
230±30 Gt of ice per year, and Antarctica 143±73 Gt ice per year (another
estimate suggests 190±77 Gt ice per year47). These ice sheet melt tendencies
correspond to 1.1±0.2 mm/year of the global mean sea level rise. For com-
parison, AR4 (WGI, Table 5.3) gave an estimate of only 0.4±0.4 mm/year,
for the years 1993–2003.
Thinning on the margins of the ice sheets is especially apparent in the
Amundsen Sea Embayment portion of the West Antarctic ice sheet 49 but
extensive thinning also seems to be occurring elsewhere on the margins of
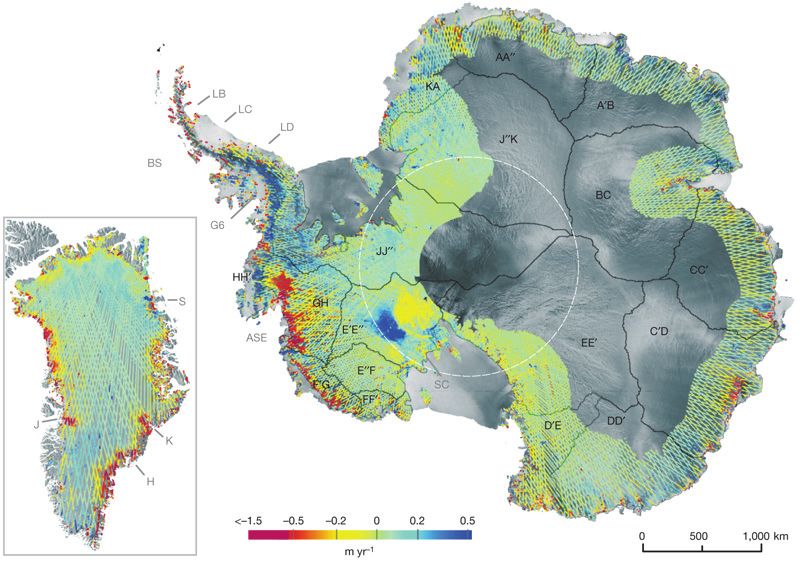
Antarctica 50 (see Figure 4).
Figure 4. Ra te of change of su rface eleva tion [metres per yea r] for An tarctica and
Greenland, over the period 2003–2007. A negative rate of change indicates thinning. (Re-
printed by permission of Macmillan Publishers Ltd: Nature, Pritchard et al. 2009 50, copy-
right 2009.)
Major ice shelf break-ups have occurred in Antarctica in recent years, such
as the Wilkins ice bridge in 2009. Following such a break-up, the glaciers
behind the ice shelves can speed up, at least temporarily 51 , driving dynamic
thinning which can spread far into the interior of the ice sheet.
For Greenland, such acceleration in the velocity of outlet glaciers was
discussed in AR4. Later research has documented the extent of the phe-
nomena 52,53 , and a connection to warming sea waters has also been impli-
cated 54 . Some attention has been paid to a “lubrication effect” 55 whereby
increased water pressure from surface meltwater increases the flow speed of
the glacier. Larger contributions from this process are mentioned to likely be
confined to certain areas of Greenland 56 . It has also been pointed out 57 that
the recent marked and accelerating dynamics of Greenland’s tidewater outlet22 Physical Climate Science since IPCC AR4 – A brief update
glaciers may prove to be temporary. Other factors, such as dynamic thin-
ning, may be more important elsewhere.
The mass loss of glaciers and small ice caps in recent years is estimated
to be of a similar magnitude as the total mass loss of the large ice sheets, i.e.
equivalent to 1.1 mm/year in sea level rise 58 . In AR4 (WGI, Table 5.3), a
slightly smaller contribution of 0.8±0.2 mm/year was estimated, for the
years 1993–2003.
To summarise, new evidence since the publication of AR4 emphasises
that ice is melting at a rate that is faster than previously estimated. This is
true for Arctic sea ice, for the large ice sheets of Greenland and Antarctica,
and for the smaller ice caps and glaciers.3. Ocean acidification and the
marine carbon cycle
The current rate of increase in the atmospheric carbon dioxide concentration
corresponds to only about 45% of the overall anthropogenic emissions.
About 30% of these emissions are taken up by the terrestrial biosphere, and
the remaining 25% by the oceans 59 . Ocean acidification results from the
following process: when carbon dioxide is taken up by the ocean, CO2 com-
bines with water to produce carbonic acid. In this process, hydrogen ions
(H+) are released, which lowers the pH of the water. Hydrogen ions combine
with carbonate ions (CO32-), which leads to a decrease in carbonate in the
water. In turn, this affects, for example, corals that need carbonates for
building their skeletal bodies. Ocean acidification therefore has conse-
quences for marine species and ecosystems.
In AR4 (SPM, page 14, see also WGI Chapters 5.4, 10.4 and Box 7.3), it
was assessed that:
Increasing atmospheric carbon dioxide concentrations lead to increasing acidification
of the ocean. Projections based on SRES scenarios give reductions in average global
surface ocean pH of between 0.14 and 0.35 units over the 21st century, adding to the
present decrease of 0.1 units since pre-industrial times.
The changes in pH will vary from region to region, and the resulting effects
on marine organisms also depend on the current saturation state of aragonite
(a form of calcium carbonate) in the ocean water 60 . As a consequence, coral
reefs in some regions (e.g. the Great Barrier Reef, the Coral Sea and the
Caribbean Sea) appear to be more at risk than those in others (e.g. Central
Pacific) 61 . In addition to corals, increasing CO2 affects many other groups of
marine organisms. An emerging body of evidence suggests that the impact
on marine biota will be more varied than previously thought, with both eco-
logical winners and losers. These impacts could have far-reaching but as yet
largely unknown consequences for the structure and function of marine eco-
systems60. In addition to the acidification effects, the impacts on marine
species and ecosystems also depend on changes in (e.g.) temperature 62 .
Ocean acidification is a direct consequence of carbon dioxide emissions,
rather than being mediated by changes in e.g. temperature 63 . Sea-water
warming can have some effect on ocean acidification, but this seems to be
marginal 64,65 . Consequently, ocean acidification can only be mitigated by
reducing CO2 emissions.
Ocean acidification by itself affects the capacity of the oceans to act as a
carbon sink 66,67 . When the concentration of inorganic dissolved carbon (the24 Physical Climate Science since IPCC AR4 – A brief update
sum of CO2, HCO3- and CO32-) increases, atmospheric CO2 starts to dissolve
in the ocean water less efficiently. Consequenly, increasing CO2 will tend to
make the ocean carbon sink less efficient. On the other hand, retreating ice-
shelves reveals more of the ocean surface, which can lead to more phyto-
plankton activity and some additional CO2 uptake 68 .
Also the mere warming of the oceans would seem to reduce the ocean
sink 69 . Indeed, the role of the oceans as a carbon sink can change due to
changes in temperature, but also due to changes in ocean circulation and
winds. The latter two affect the exchange of CO2 between the atmosphere
and the surface ocean on the one hand, and between the surface, subsurface
and the deep ocean on the other 70 . A slow continued CO2 uptake over longer
timescales involves the deep ocean, whereas surface water becomes satu-
rated quickly.
Ocean acidification remains a relatively unexplored topic, although more
studies have begun to emerge over the past 5–6 years. The phenomenon is
important not least due to its impact on ecosystems, but it is also intimately
tied to the role of the oceans as a natural carbon sink. The latter has conse-
quences for the emission pathways required for achieving a stabilisation of
atmospheric CO2 concentration at any given target level.4. Observed and Projected
Extremes
AR4 (WGI, SPM, page 7) noted regarding observed changes in extremes:
At continental, regional and ocean basin scales, numerous long-term changes in cli-
mate have been observed. These include changes in arctic temperatures and ice,
widespread changes in precipitation amounts, ocean salinity, wind patterns and as-
pects of extreme weather including droughts, heavy precipitation, heat waves and the
intensity of tropical cyclones [hurricanes and typhoons].
The assessed likelihood of occurred changes in extremes was greatest for
warmer and more frequent hot days and nights and warmer and fewer cold
days and nights, over most land areas during the late 20th century (likelihood
> 90%). In the case of changes in warm spells/heat waves, heavy precipita-
tion, extent of droughts, increased tropical cyclone activity and increased
incidence of extreme high sea level, the likelihood of a recent trend was
lower (66–90%). There was not enough evidence to assess whether changes
might have occurred in phenomena such as tornadoes, hail, lightning and
dust storms.
4.1 Temperature extremes
Studies on heat waves in the European region, not least prompted by the
recent events of 2003 and 2006, have continued 71,72,73 , largely confirming
projections of increasing likelihood of such events. The mechanisms respon-
sible for more frequent and more intensive European heat waves are more
complicated than the effect of a general increase in temperature alone72. The
occurrence of persistent blocking high pressure systems is relevant, as is the
drying-out of soil 74 .
Global warming is projected to lead to increasing heat waves across the
northern hemisphere 75 and globally 76 . Changes in warm and cold extremes
may in many areas be characterised by disproportional rises in temperature
compared to corresponding changes in average temperatures 77,78 . The for-
mer characterises not least warm areas that warm up (warming leads to a
depletion of soil moisture that in turn reduces evaporative cooling) and the
latter cold regions that warm up (warming leads to a reduction in wintertime
snow cover and so to changes in the surface energy balance). Model studies
suggest that, globally, cold extremes will warm faster than warm extremes
by about 30–40% 79 . However, results vary somewhat between models and
also for the exact type of an extreme condition considered. Some results26 Physical Climate Science since IPCC AR4 – A brief update
point to 100-year return levels for annual maximum temperature exceeding
40oC in e.g. Southern Europe and the US Midwest and as much as 50oC in
parts of India and Australia78. The quoted number for Europe might not
seem so dramatic after the recent heatwaves of 2003 and 2006. As the 2003
heatwave event very possibly corresponded to a return period of several
thousand years, it was a considerably more extreme event than one with a
100-year return period. A summer with a comparable length of return period
at the end of this century would exhibit significantly higher temperatures
than around 40oC, due to the overall warming over time.
4.2 Heavy precipitation and droughts
Studies suggest that global warming increases atmospheric (absolute) hu-
midity in line with the Clausius-Clapeyron relationship, which implies a 7%
increase for each degree of rise in temperature (7%/K). This means more
water vapour in the atmosphere. Changes in relative humidity on the global
scale are not anticipated, whereas regional variations to this may ensue.
Global precipitation is projected to increase in line with increasing evapora-
tion, which is less than the increasing amount of water vapour in the atmos-
phere 80 . The projected increases in global precipitation lie around 2%/K.
However, there are also inferences from short-term climate variability that
the increase in global precipitation could be more comparable with that of
atmospheric humidity 81 .
In contrast to average precipitation, climate model projections indicate
that extreme precipitation changes will be comparable to increases in atmos-
pheric humidity. For example, according to a multi-model projection (12
GCMs), the change in globally averaged 20-year return values of extreme
daily precipitation could be 6%/K79. According to other studies, changes in
the even more extreme daily precipitation events (such as the 99th, 99.9th and
99.99th percentiles), may differ regionally. Some results suggest that extreme
daily precipitation could increase more in the tropics 82,83,84 , than in the ex-
tratropics. Such regional variation would be due to varying local tempera-
ture and moisture changes, as well as changes in upward velocity and the
moist-adiabatic lapse rate. On time scales shorter than the daily, changes in
extreme precipitation could be even larger 85 .
In AR4, it was noted that available projections are consistent with in-
creasing risk of drought in various continental areas at mid-latitudes: central
Europe, the Mediterranean region, Central America, Australia and Eastern
New Zealand. In some cases, it is the seasonal risk of drought rather than the
year-round risk that changes. Later studies also address the Southwestern
North America 86 and Central America 87 .Physical Climate Science since IPCC AR4 – A brief update 27
4.3 Tropical cyclones
In AR4, observed increase in intensive tropical cyclone activity (including
hurricanes and typhoons) during the late 20th century were mentioned as
“likely”. A recent review of tropical cyclones and climate change 88 , summa-
rising almost 50 different studies of both observations and climate model-
ling, concludes that
it remains uncertain whether the apparent changes in tropical cyclone
activity in recent times exceed natural variability
it is likely that climate change will not lead to increased global
frequency of tropical cyclones, but that the frequency of the most
intense storms is “more likely than not” to increase
some increase in maximum wind speeds and rainfall rates is likely
possible changes in characteristic storm formation regions and tropical
storm tracks cannot be estimated with much robustness. Neither is
there firm evidence of the possibility of tropical storms more often
transiting to high latitudes
The implication is that unless tropical cyclones respond to climate change
more strongly than suggested by current research, it should at this stage be
difficult to detect possible trends due to climate change.
Tropical cyclones (storms, hurricanes and typhoons) form over warm sea
surface regions somewhat polewards of the equator in both hemispheres. In
addition, atmospheric conditions have to be suitable and, in particular, wind
shear should be small (i.e. wind speed should not change much with altitude.
The latter is connected to atmospheric circulation features and is in turn
related to the relative warmth of different ocean basins 89,90 . Thus, the con-
nection between sea surface temperature changes and tropical cyclones is
not necessarily straightforward, although this connection is suggested in
some research 91 . Recent literature emphasises that recent tropical cyclone
statistics do not lend themselves well to extrapolations into the future90,92,93 .
The possible impacts of global warming on tropical cyclones remain elu-
sive. Findings such as those referred to above point to some intensification
in maximum wind speeds and rainfall rates and, with less confidence, in-
creasing frequency of more intensive tropical storms. Regional shifts in
storminess might also ensue.
4.4 Extratropical storms
In AR4, mid-latitude westerly winds were noted to have increased, there
also being some evidence of more northern hemisphere extratropical storm
activity over recent decades. As in the case of tropical storms, findings are28 Physical Climate Science since IPCC AR4 – A brief update
still rather preliminary. Extratropical storms are mainly related to large-scale
atmospheric thermal gradients, and how these evolve.
Some recent work appears to contest notions of significant intensification
in extratropical storm activity 94,95 , although this is based on particular cli-
mate models, rather than employing several models. Poleward shifts in
storm tracks is a more general finding 96,97 . Any such change leads to
changes in regions affected by storm-related strong winds and heavy pre-
cipitation, as well as high waves and storm surges 98,99 .
4.5 Other categories of extreme events
Findings regarding extreme wind events in the projections over the 21st cen-
tury in many of the GCMs considered in AR4 suggest that the frequency of
extreme wind events will generally decrease in and around the tropics (be-
tween 40°S and 40°N), but increase at high latitudes97. These shifts are
found to be fairly robust across the models. There are also some regional
studies, such as for Europe, suggesting increases and decreases in extreme
winds within the region 100,101 .
There is a range of additional weather and climate-related extremes.
Some are very small-scale, such as tornadoes and lightning and very chal-
lenging to study using climate model simulations. These types of extremes
are not discussed in this review.
Fire is another example of a climate-related extreme 102 . The relevant pre-
cursor conditions are dryness and available combustible material. Conse-
quently, regions with ample precipitation are not necessarily exempt from
fire occurrence. The man-made suppression of natural burning further adds
to the potential for extreme burning when fire is ignited due to natural or
human causes. Enhanced burning accompanies heat waves72, but also re-
gionally anomalous conditions such as in connection with ENSO. Fire re-
gimes are sensitive to climate fluctuations and, by extension, to climate
change102.5. Radiative forcing
The balance between incoming solar radiation and outgoing thermal radia-
tion is fundamental for the Earth’s climate. Atmospheric composition has a
key role in this, as the presence of various gases and particles affects radia-
tion transfer. Indeed, as is well known, the natural greenhouse effect leads to
a higher surface temperature on Earth than would otherwise be the case.
Changes in the composition of the atmosphere due to anthropogenic emis-
sions exert an imbalance between incoming and outgoing radiation, i.e. a
radiative forcing, in response to which the climate changes.
Radiative forcing also occurs in conjunction with changing solar activity,
land cover change and some additional processes. Radiative forcing is de-
fined as the change in net downward minus upward irradiance (expressed in
Wm–2) at the tropopause, due to a change in an external driver of climate
change. The full definition is longer and contains a few additional specifica-
tions on how radiative forcing is calculated.
5.1 Greenhouse gas concentrations
Changes in the main greenhouse gas concentration since pre-industrial times
were discussed in AR4. Until 2005, the concentration of carbon dioxide
(CO2) had risen to 379 ppm (parts per million), from a pre-industrial value
of 280 ppm. During the latter years, the concentration of CO2 also grew at a
faster rate. The growth rate for the 10-year period from 1995 to 2005 was
1.9 ppm per year, whereas in the longer period from 1960 to 2004 the aver-
age growth rate was 1.4 ppm per year.
The methane (CH4) concentration in 2005 was about 1774 ppb (parts per
billion). This is more than double the pre-industrial concentration. In the
early 1970s and early 1980s the maximum growth rates for CH4 exceeded
1% per year. From the early 1990s, the growth rates decreased almost to
zero, with a few specific years forming an exception.
The nitrous oxide (N2O) concentration was 319 ppb in 2005, which is
about 18% higher than the preindustrial value.
Since AR4, the atmospheric CO2 concentration has continued to increase.
At the end of 2009 the concentration at Mauna Loa was measured at 388
ppm. The current trend of the de-seasonalised concentration (black line in
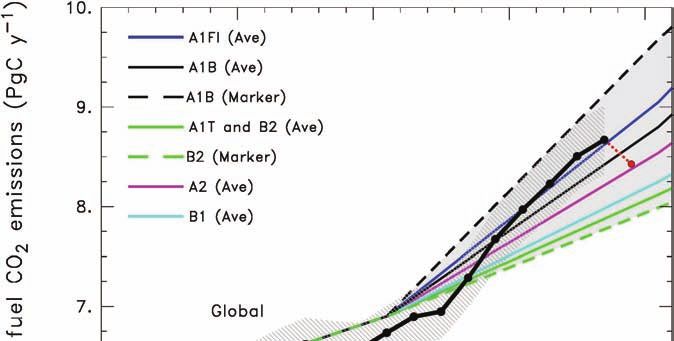
Figure 5) points to around 390 ppm in 2010.30 Physical Climate Science since IPCC AR4 – A brief update Figure 5. CO2 concentrations at Mauna Loa, Hawaii from 1957 to early 2010. The red curve shows monthly values, and the black curve annual averages. (Data courtesy of the Global Monitoring Division of NOAAs Earth Systems Research Laboratory; www.esrl.noaa.gov.) During the first years of the 21st century, anthropogenic carbon dioxide emissions increased faster than in the preceding decade 103 . The actual recent emission trends are well among the highest SRES scenarios (for example, the 2008 emissions were above 34 of the 40 SRES scenarios; Corinne Le Quére, personal communication (see Figure 6) 104 . Estimated 2009 emissions are characterised by a downturn. This coincides with the strong economic downturn at the end of the decade and is as such likely to prove to be a tem- porary develop.
You can also read