THE STATUS AND POSSIBLE EVOLUTION OF CLIMATE PROJECTIONS IN WEST AFRICA
←
→
Page content transcription
If your browser does not render page correctly, please read the page content below

BACKGROUND REPORT ON

THE STATUS AND POSSIBLE
EVOLUTION OF CLIMATE
PROJECTIONS IN WEST AFRICA
                                   OCTOBER 2013
                                    This report is made possible by the support of the American people through the U.S. Agency for International Development
OCTOBER 2013                        (USAID). The contents are the sole responsibility of Tetra Tech ARD and do not necessarily reflect the views of USAID or the U.S.
                                    Government.
This report is made possible by the support of the American people through the U.S. Agency for International Development (USAID). The contents are the sole
responsibility of Tech ARD and do not necessarily reflect the views of USAID or the U.S. Government.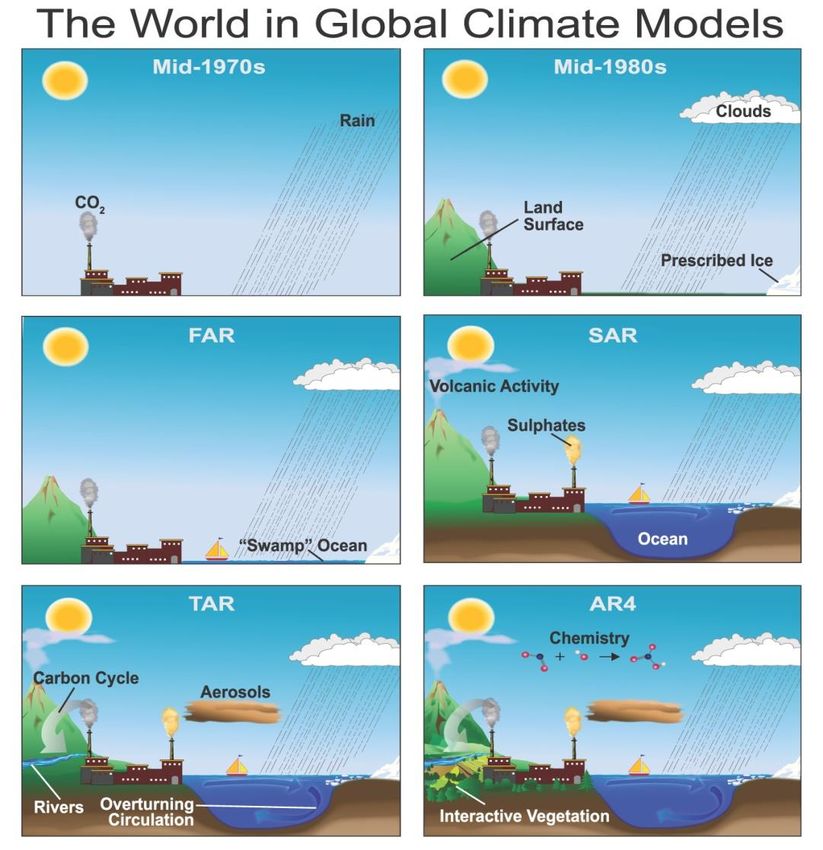
Contributors to this report, in alphabetical order: Ross Blamey,1 Lisa Coop,1 Christopher Jack,1 Ben
Loveday,2 and Kate Sutherland.1

1 Climate   Systems Analysis Group (CSAG), University of Cape Town
2   Department of Oceanography, University of Cape Town

Cover Photo: Sunrise in Dakar, David Miller, 2013

This publication was produced for the United States Agency for International Development by Tetra
Tech ARD, through a Task Order under the Prosperity, Livelihoods, and Conserving Ecosystems
(PLACE) Indefinite Quantity Contract Core Task Order (USAID Contract No. AID-EPP-I-00-06-00008,
Order Number AID-OAA-TO-11-00064).
Tetra Tech ARD Contacts:
Patricia Caffrey
Chief of Party
African and Latin American Resilience to Climate Change (ARCC)
Burlington, Vermont
Tel.: 802.658.3890
Patricia.Caffrey@tetratech.com

Anna Farmer
Project Manager
Burlington, Vermont
Tel.: 802-658-3890
Anna.Farmer@tetratech.com
BACKGROUND PAPER ON THE
STATUS AND POSSIBLE
EVOLUTION OF CLIMATE
PROJECTIONS IN WEST AFRICA
AFRICAN AND LATIN AMERICAN RESILIENCE TO CLIMATE CHANGE (ARCC)

OCTOBER 2013

The Status and Possible Evolution of Climate Projections in West Africa   i

TABLE OF CONTENTS
ACRONYMS AND ABBREVIATIONS ........................................................................................ i
LIST OF FIGURES AND TABLES ............................................................................................. iii
EXECUTIVE SUMMARY........................................................................................................... VII
1.0 INTRODUCTION ................................................................................................................... 1
2.0 SOURCES OF CLIMATE INFORMATION .......................................................................... 4
2.1. INTRODUCTION .................................................................................................................................................... 4
2.2. OBSERVATIONS ....................................................................................................................................................... 5
2.3. NUMERICAL MODEL OUTPUT ........................................................................................................................11
2.4. CHAPTER SUMMARY ...........................................................................................................................................25
3.0 CLIMATE PROJECTIONS FOR WEST AFRICA .............................................................. 26
3.1. BACKGROUND TO THE PROJECTIONS ......................................................................................................26
3.2. HISTORICAL WEST AFRICAN RAINFALL .....................................................................................................27
3.3. THE SIMULATION OF CURRENT CLIMATE.................................................................................................32
3.4. THE SIMULATION OF FUTURE CLIMATE .....................................................................................................37
3.5. CHAPTER SUMMARY ...........................................................................................................................................46
4.0 REPORT SUMMARY ............................................................................................................ 47
4.1. WEST AFRICAN CLIMATE AND PROJECTIONS ........................................................................................47
4.2. AVENUES FOR IMPROVEMENT IN CLIMATE SCIENCE ...........................................................................48
4.3. RECOMMENDATIONS FOR WEST AFRICA .................................................................................................51
5.0 SOURCES .............................................................................................................................. 54
ANNEX I: PRODUCTS, VARIABLES, AND DATASETS ...................................................... 67

  The Status and Possible Evolution of Climate Projections in West Africa                                                                                                ii
ACRONYMS AND ABBREVIATIONS
AEJ                    African Easterly Jet
AMMA                   African Monsoon Multidisciplinary Analysis
AMO                    Atlantic Multidecadal Oscillation
AOGCM                  Atmosphere-Ocean General Circulation Model
AR3                    Third Assessment Report
AR4                    Fourth Assessment Report
AR5                    Fifth Assessment Report
AWJ                    African Westerly Jet
CFSR                   Climate Systems Forecast Reanalysis
CGCM                   Coupled Global Climate Model
CIP                    Climate Information Platform
CMIP3                  Coupled Model Intercomparison Project Phase 3
CMIP5                  Coupled Model Intercomparison Project Phase 5
CORDEX                 Coordinated Regional Downscaling Experiment
CSAG                   Climate System Analysis Group
ECMWF                  European Centre for Medium-Range Weather Forecasts
ESM                    Earth System Models
ENSO                   El Niño-Southern Oscillation
ESA                    European Space Agency
EUMETSAT               European Organisation for the Exploration of Meteorological Satellites
FEWS                   Famine Early Warning System
GCM                    General Circulation Model
GHCN                   Global Historical Climatology Network
GPCC                   Global Precipitation Climatology Centre
GPCP                   Global Precipitation Climatology Project
HRV                    High-Resolution Visible
IPCC                   Intergovernmental Panel for Climate Change
IR                     Infrared

The Status and Possible Evolution of Climate Projections in West Africa                         iii
ITCZ                   Intertropical Convergence Zone
MCS                    Mesoscale Convective System
MSG                    Meteosat Second Generation
MSLA                   Mean Sea Level Anomaly
NASA                   National Aeronautics and Space Administration
NCAR                   National Center for Atmospheric Research
NCEP                   National Centers for Environmental Prediction
NDVI                   Normalized Difference Vegetation Index
NIR                    Near-Infrared
NOAA                   National Oceanic and Atmospheric Administration
PIRATE                 The Pilot Research Moored Array in the Tropical Atlantic
RCD                    Regional Climate Downscaling
RCM                    Regional Climate Model
RCP                    Representative Concentrative Pathways
SLP                    Sea Level Pressure
SRES                   Special Report on Emission Scenarios
SSH                    Sea Surface Height
SSS                    Sea Surface Salinity
SST                    Sea Surface Temperature
TEJ                    Tropical Easterly Jet
TRMM                   Tropical Rainfall Measuring Mission
VIS                    Visible
WAIS                   West Antarctica Ice Sheet
WAWJ                   West African Westerly Jet
WGCM                   Working Group on Coupled Modelling
WOA                    World Ocean Atlas
WRCP                   World Climate Research Program
XBTs                   Expendable Bathy Thermographs

The Status and Possible Evolution of Climate Projections in West Africa           iv
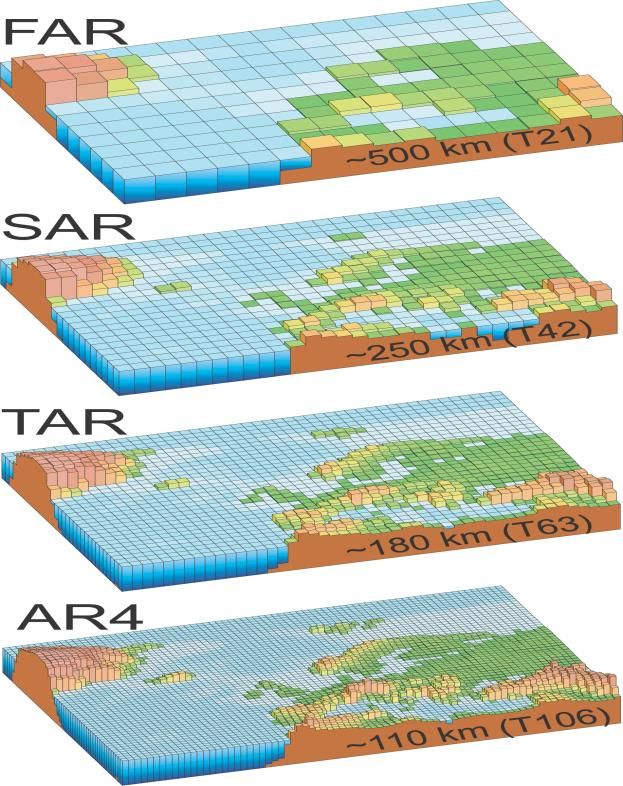
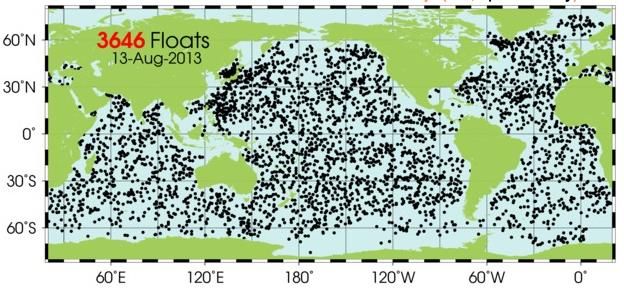
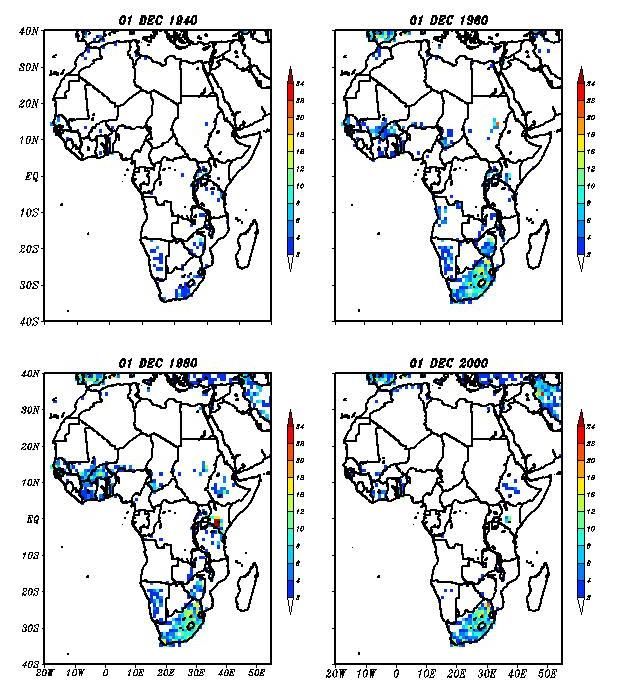
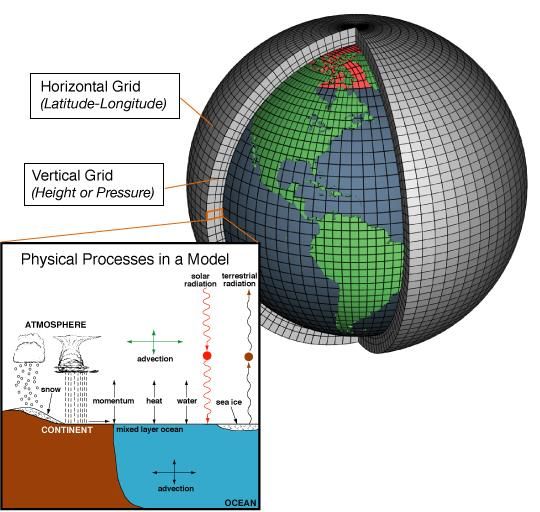
LIST OF FIGURES AND TABLES
Figure 1: A schematic of the available sources of climate information and how they feed into one
another. It is the combination of these sources of information that increases our understanding of
regional climate change
Figure 2: The evolution of African rain-gauge data incorporated into the Global Precipitation
Climatology Project (GPCC) since 1940 through to 2000 at 20 year intervals. Values refer to the
number of stations in each 1° grid cell.
Figure 3: Distribution of ARGO float reports from August 13th, 2013.
Figure 4: The PIRATA backbone of ATLAS buoys (red squares), Northeast Extension (blue stars),
Southwest Extension (green circles), Southeast Extension pilot project (yellow triangle), and island-based
observation sites (green crosses). Buoys with barometers and the ability to estimate net heat flux are
indicated with black circles. Also current meter moorings are maintained at 23°W-Equator (PIRATA-
international) and 10°W-Equator (PIRATA-France, initially installed in relation with the EGEE/AMMA
and TACE/CLIVAR programs) (PIRATA, 2013).
Figure 5: A schematic showing how the Earth is broken up into a grid of “boxes.” The size of the box
refers to the spatial resolution. Calculations are performed in each box and on the neighboring boxes at
each time step in the model. Source: NOAA website.
Figure 6: The progress of model in terms of capturing the dynamic and coupled climate system. The
source of this figure is the IPCC (2007) AR4 Working Group I report.
Figure 7: The fraction of total variance in decadal mean surface air temperature predictions explained by
the three components of total uncertainty is shown for a global mean (left) and the Sahel mean (right).
Green regions represent scenario uncertainty, blue regions represent model uncertainty, and orange
regions represent the internal variability component. As the size of the region is reduced, the relative
importance of internal variability increases (Hawkins and Sutton 2009).
Figure 8: An example of uncertainty from the IPCC AR4 Working Group I report. The figure shows the
spread of surface warming projected for the future (up to 2100) from the different CO2 emission
scenarios. Solid lines are multi-model global averages of surface warming (relative to 1980–1999) for the
scenarios A2, A1B and B1, shown as continuations of the 20th century simulations. Shading denotes the
±1 standard deviation range of individual model annual averages. The orange line is for the experiment
where concentrations were held constant at year 2000 values. The grey bars at right indicate the best
estimate (solid line within each bar) and the likely range assessed for the six SRES marker scenarios.
Figure 9: Schematic of how model skill varies with time (black line). The theoretical limit (red line) is
based on model improvements, better initial conditions and better understanding of the climate.
Figure 10: Schematic of surface wind (arrows) and pressure (mb) over West Africa during winter (left)
and at the peak of the summer monsoon (right). The dotted line denotes the position of the ITCZ.
(Nicholson, 2013)
Figure 11: Mean annual precipitation over West Africa (in mm). Location of the Sahel is indicated
(Nicholson, 2013).

The Status and Possible Evolution of Climate Projections in West Africa                                     v
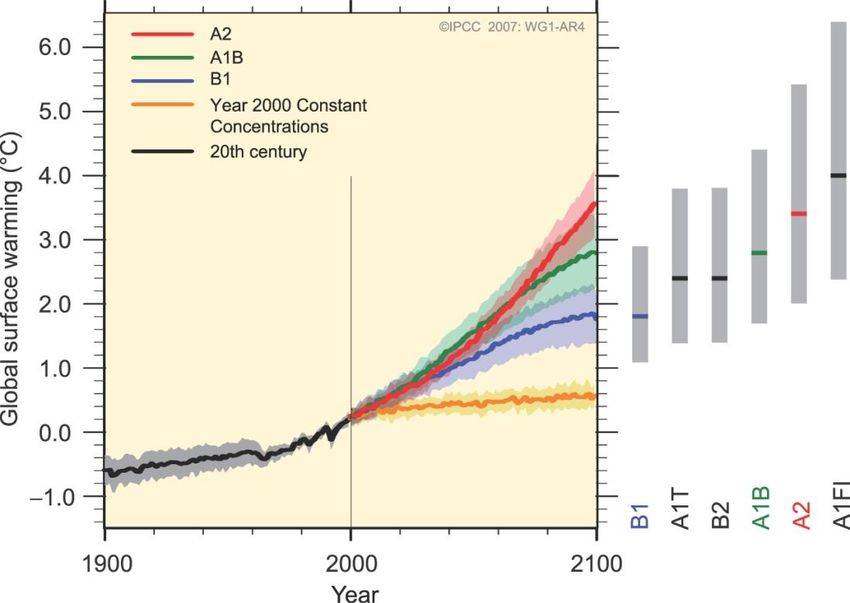
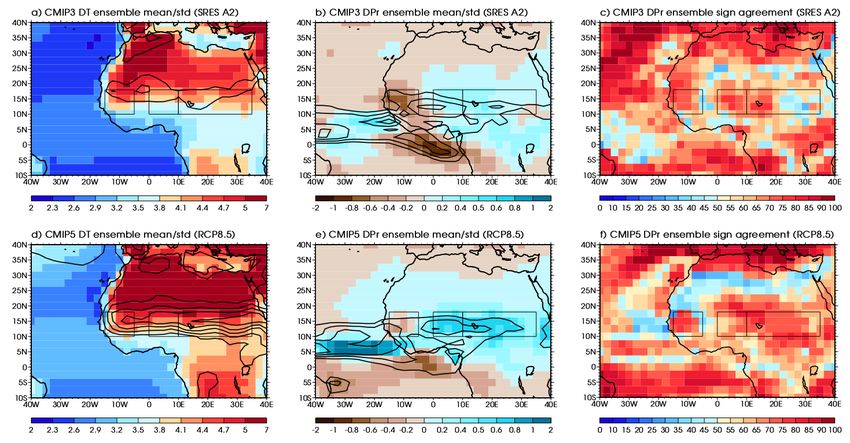
Figure 12: These figures are created using the Climate Information Platform (CIP) developed by CSAG
(www.cip.csag.uct.ac.za). They show the mean monthly rainfall (blue bars), mean monthly minimum and
maximum temperature (green and red line, respectively) from the station in Gagnoa in the Ivory Coast
(top) and Bamako in Mali (bottom).
Figure 13: Mean bias in mean temperature climatology for the period June-September (1990-2008) for
each OF the RCMs and tier multi-model ensemble with respect to UDEL observations (Gbobaniyi et al.,
2013).
Figure 14: Mean bias in mean rainfall climatology for the period June-September (1990-2008) for each of
the RCMs and tier multi-model ensemble with respect to GPCP observations (Gbobaniyi et al., 2013).
Figure 15: Annual cycle of monthly precipitation (mm day-1) averaged over the Sahel (top), the Gulf of
Guinea (middle) and the entire West Africa (bottom) for the period 1990-2008 for GPCP observations,
each of the RCMs and their multi-model ensemble (Gbobaniyi et al., 2013).
Figure 16: Rainfall projections for the onset and demise seasons. RCP 8.5 trends in Sahel rainfall in the
multi-model mean for the onset season (June and July, left) and the demise season (September and
October, right). Maps are in mm/day and are the difference between the end point of the linear trend
over 2006:2099. The mean available ensemble runs is used for each model (using 20 models). Stippling
indicates grid boxes where 15 or more of the models produce either a positive or negative trend
(Biasutti, 2013).
Figure 17: Climate projections of 2-meter temperature (colors in °K) plotted as the difference between
the periods 2071–2100 and 1971–2000 for the JAS season, for the CMIP3 SRES A2 ensemble mean. The
CMIP3 inter-model standard deviation is indicated in contours, with one contour every 0.2 °K, beginning
at 1.0 °K. b) Same as a) but for precipitation (in mm/day). The standard deviation is indicated in
contours, with one contour every 0.3 mm/day, beginning at 1.0 mm/day. c) Percentage of models of the
CMIP3 ensemble that agree on the sign of the CMIP3 ensemble mean precipitation changes. d), e), and f)
same as a), b) and c) respectively, but for the CMIP5 RCP8.5 model ensemble (Roehrig et al., 2013).
Figure 18: The regional distribution of sea-level rise between Jan 1950 and Dec 2000 from the
reconstructed sea level fields using the tide gauge data. The solid line is 2.0 mm yr-1and the contour
interval is 0.5 mm yr-1 (Church et al., 2004).
Figure 19: Population of West Africa affected by a 5 m sea-level rise, by nation (Dasgupta, 2007).
Figure 20: The source of this figure is from the IPCC (2007) AR4 Working Group I report (Figure 1.4).
It shows the progress of model spatial resolution from the IPCC First Assessment Report (top) through
to the Fourth Assessment Report, AR4 (bottom).
Table 1: Summary of climate change impacts on projected Sahel rainfall for selected studies. Impacts are
relative to late 20th-century Sahel rainfall (Druyan, 2011).
Table A1: The various reanalysis products available for studying West African climate dynamics
Table A2: A list of ocean variables derived from in-situ observations and remote sensing products
Table A3: The table covers most of the rainfall products that cover Africa. It includes observations from
in-situ measurements as well as derived remote sensing produc

The Status and Possible Evolution of Climate Projections in West Africa                                     vi
EXECUTIVE SUMMARY
The U.S. Agency for International Development (USAID) commissioned The African and Latin American
Resilience to Climate Change (ARCC) project to organize various desk studies focusing on the
vulnerability of West Africa to climate, both current and future. These individual studies fall under the
umbrella of the ‘West African Vulnerability Assessment.’ This particular report presents the findings from an
assessment of the status and possible evolution of climate projections for the region. It highlights both
the strengths and limitations of such data for building a picture of climate change in West Africa.
Furthermore, this report shows that climate modeling is a complicated task in West Africa, with many
challenges linked to limitations within models, availability of observed data, and the unique and complex
climate dynamics of the region.
The climate1 of West Africa is complex, with a distinct north-south rainfall gradient evident between the
wet coastal region and the drier Sahel located further to the north. The Sahel has possibly been the
most documented region of West Africa, in terms of climate, due to the impact of a multi-decadal
drought towards the end of the 20th century. As noted by Giannini et al. (2008), changes in rainfall
patterns experienced in the Sahel are “unparalleled globally, in magnitude, spatial extent and duration.”
Although the Sahel is home to major cities such as Dakar (Senegal), Niamey (Niger), Bamako (Mali), and
Khartoum (Sudan), a large portion of the populations of these countries live in rural areas and are highly
dependent on agriculture as a source of food and income. It is for this reason that understanding
regional rainfall patterns, both past and future, is of such importance.
One of the key drivers2 of the spatial distribution of rainfall in West Africa is temperature contrasts
between the land and ocean. These gradients set up the regional rain producing circulation pattern,
commonly known as the West African Monsoon. The onset of the monsoon takes place along coastal
West Africa in the spring months. This is the wettest phase of the monsoon. During July, there is a
strong northward latitudinal shift in the monsoon, referred to as the “monsoon jump,” during which
peak rainfall intensities occur in the Sahel. By the end of August, the monsoon rains begin to return to
the coast, and the Sahel begins to transition into the dry season.
Regions within West Africa display considerable rainfall variability at annual, decadal, and multi-decadal
time scales. This variability was long thought to be due to desertification, but more recently has also
been linked to anomalous circulation in the jet streams, and to anomalies in sea-surface temperatures
both regional and global. Identifying the contribution of any one particular feature or climate driver to
West African rainfall variability is difficult due to the complex nature of the interactions involved. It is
likely that the influence of an individual driver may vary for different regions within West Africa, at
different times of the year, and is also modified by interaction with the effects of other drivers.

1
        Weather is generally defined as the conditions of the atmosphere at a particular place over a short period of
        time, while climate is generally defined as the average or mean atmospheric conditions over a longer period
        (usually over a 30-year period) at that location or across a region.
2
        The term “drivers” is used to describe any local or remote atmospheric, ocean, or land surface feature that
        influences the weather and climate in a particular area. Examples include sea-surface temperatures,
        topography, jet-streams, high pressures systems, and vegetation.

The Status and Possible Evolution of Climate Projections in West Africa                                           vii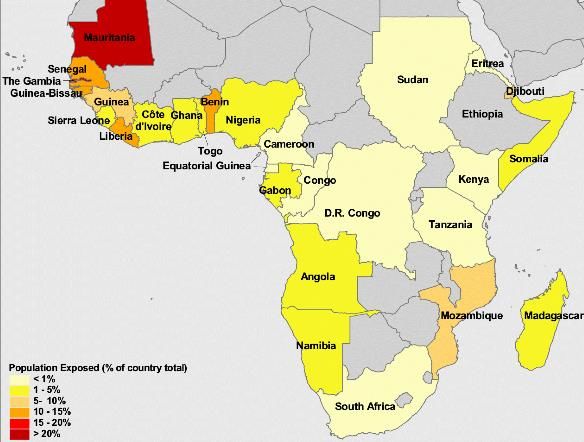
Full understanding of the African climate is hindered by the lack of availability of long period, continuous
sequences of observed climate data. This is of concern as it limits understanding of regional climate
change and variability which takes place over multiple decades. The primary source of historical climate
information comes through in-situ data (e.g., rain-gauges). Although many regions contain station-based
datasets housed by various local weather agencies, this data is fragmented and of questionable quality.
Data that has not been through stringent quality control tests may produce misleading climate signals,
and thus have negative consequences when used in decision making.
Remote sensing (satellite based) products have somewhat filled the void by providing observations at a
relatively high spatial and temporal resolution. The data from satellites have increased understanding of
climate processes on a global scale, and have been invaluable in advancing numerical weather prediction
and early warning systems. However, such products also have their limitations; they still require a
considerable amount of validation and contain biases in many areas.
Another source of climate information is computer modeling. The field of numerical modeling is based
on mathematical equations that are used to represent the dynamics of the climate system. The most
well-known example of modeling is the general circulation model (GCM) or climate model. While most
models are based on the same physical principles and even use largely similar numerical methods, there
are many choices available to model developers during model development. Different numerical
methods can be used to solve the fundamental physical equations, while different approximations,
known as parameterizations, can be used to represent processes such as convective rainfall, cloud
properties, and radiation balances (i.e., processes that occur on scales smaller than the model
resolution). The result is that each model, while following the same basic principles, can produce
different simulations of the current climate and different projections of the future climate state.
Although models may produce different projections of future climate, there are a number of
characteristics that are common through nearly all models. In particular, all models agree on global
temperature increases with greatest increases in the northern hemisphere high latitudes. Many models
agree on increases in extreme rainfall in tropical areas and on significant changes in circulation
(intensification of high pressure belts and shifts in the mid-latitude cyclone tracks).Where models often
disagree is around regional scale changes in rainfall patterns and details of shifts in seasonality (e.g., the
start and end of the rainy season). Models disagree on these characteristics because regional scale
rainfall processes are strongly governed by local scale topography, land-surface characteristics, sea-
surface temperatures, and other complex regional processes. These are poorly represented by most
models, and often are approximated by starkly different parameterizations within the models.
Unfortunately, these disagreements between different models are often of critical importance for the
purposes of this report— that is, with regards to resilience planning and decision-making — as it is at
the regional scale that changes in rainfall are likely to have the most critical societal impacts.
Even though the scientific community attempts to use climate models to provide robust and useful
information to assist decision makers, their projections inherently include uncertainties, which stem
from a number of different sources. These sources can be categorized as follows:

The Status and Possible Evolution of Climate Projections in West Africa                                      viii
Natural Variability: This is also known as “climate noise,” and refers to the internal variability of the
climate system that occurs irrespective of changes in external forcing3
Emission-Scenario Uncertainty: Also known as forcing uncertainty, this relates to the lack of knowledge
of how future society will alter atmospheric emissions of greenhouse gases, which can be considered
as an external factor influencing the climate system.
Model-Response Uncertainty: This arises from the use of different models that produce diverse results
despite being forced with the same external forcing. This can be broken down into imperfect
understanding, where the small scale physical processes are not well understood (e.g., cloud
radiative effects and precipitation processes) and also model inadequacies (e.g., representing fine
scale processes through parameterizations).
Initial Condition Uncertainty: This is due to sparse or incomplete observations in time and space, of the
type which are needed to initialize the model. This uncertainty is more likely to present a challenge
in the shorter time scales, like weather forecasting and decadal forecasting.
Some uncertainty can potentially be addressed through improved models (e.g., increased resolution and
better parameterizations) and downscaling methodologies. Downscaling is the process used to produce
information at a higher resolution than GCMs. There are two main approaches to downscaling, either
through dynamical methods (e.g., using a regional climate model forced with GCM data) or through
statistical methods (e.g., empirical relationships between large-scale4 processes and the local
climate).However, downscaling introduces a new set of uncertainties, and some uncertainty will always
be present. By understanding the limitations of the range of models and methods, decision makers can
be better equipped when dealing with climate information.
An assessment of the effectiveness of various GCMs and regional climate models (RCMs) in simulating
current West African climate reveals that many challenges still exist. In particular, the models struggle to
accurately represent the range of climate drivers that play a role in the region. It is this poor
representation of the multiple climate drivers in the models that adds to the uncertainty in future
projections. For example, GCMs have trouble simulating the tropical Atlantic sea surface temperature,
which is critical to accurately simulating the West African Monsoon system. In addition, the sensitivity of
models to the parameterizations used and the choice of boundary conditions can also lead to diverse
results. Regional climate models are needed to provide the finer resolution data required for impacts or
adaptation studies and the CORDEX-Africa project has the potential to provide this information.
However, these models still show strong biases compared to observations, as well as differences
between models. Overall, the scientific studies documented in this report have illustrated the enormity
of the challenge faced when trying to produce future climate projections for West Africa.
Noting these caveats, the results presented in this report do suggest that the West African region will
not respond to climate change in a uniform manner. The Sahel is projected to warm more than the
Guinean Coast, while the western Sahel is more likely to dry (especially at the beginning of the season)
3 External climate forcing encompasses any phenomena that influences the climate system but is not part of
the system. The most common and dominant example is variation in solar radiation, referred to within this
document and elsewhere as radiative forcing.
4
Sometimes described as ‘synoptic-scale’ and refers to processes or weather systems occurring on scales
ranging from a few hundred kilometers to several thousand kilometers.
The Status and Possible Evolution of Climate Projections in West Africa ixcompared to the central and eastern Sahel, which is projected to become wetter (especially during the
end of the rainy season). There is also some preliminary evidence that high-elevation areas may respond
differently from lower-elevation regions, with an increase projected over the Guinean Highlands and
Cameroon Mountains. With regards to the coastal regions, it is projected that these regions may
become increasingly vulnerable to an increase in sea-level rise and coastal storm surges, although there
is a high degree of uncertainty associated with these projections. This is particularly difficult to evaluate
due to the lack of observations as well as the poor representation of sea-level rise (knowledge
deficiency) and storm surges (model resolution deficiency) in models.
West African future climate projections, particularly the near-term (next five to ten years), are
inherently uncertain. This is a result of both chaotic variability in regional atmosphere-ocean processes,
and because models cannot fully simulate all aspects of the climate system due to resolution constraints
and the need to parameterize complex processes. It needs to be recognized that climate science will
continue to evolve and improve, and while the focus of a given study or instrument specifically be on
West Africa, any progress in the field as a whole will still undoubtedly improve understanding of region’s
climate. With West Africa in mind, the following areas still need to be addressed:
The development of a better weather observation network (or maintaining what is already in place
through country meteorological services and other organizations). This must be considered a long
term investment as the real value of observations is only realized after ten to fifteen years after
installation of an observing station. Observation data forms the basic foundation of climate
information that is used to better our understanding of regional climate variability. Planning for
future climate change requires a deeper understanding of what drives regional climate variability.
There are still many unknowns regarding West African climate dynamics. Significant research effort
in this area has the potential to make important progress. Projects such as AMMA and others have
already proved the value of focused research combined with intensive observations. This is one area
of scientific research that could play a big role in improving our understanding of future climate
projections and reducing uncertainties.
Model development (e.g., improving resolution, parameterizations, etc.) will continue to take place.
Improvements in parameterizations in particular (i.e., how rainfall processes or land surface
feedbacks are simulated in the model) could be beneficial for West Africa. Most model development
takes place in the Northern Hemisphere with a great deal of focus on the higher latitudes. While
some model development is focused on improving the models in equatorial and tropical regions
(e.g., CSAG-UCT CAM5 model improvement activities), more focus on these regions could reap
valuable benefits both in understanding regional climate processes as well as reducing uncertainty in
future projections.
Other avenues for improvement in West Africa climate projections include the relatively new fields
of bias correction and decadal prediction. These methodologies are currently under review in the
scientific community. Bias correction attempts to correct systematic errors in model outputs in
order to make the results more directly useful to decision making. Decadal predication attempts to
extend concepts in weather forecasting to multi-year forecasts.
CORDEX-Africa will produce large quantities of climate data for Africa. Primarily this will provide a
large suite of downscaled climate simulations for Africa which will enable a comprehensive
evaluation of downscaling methods, strengths, and limitations.
The continued development of observational systems, core science research, climate modeling, and
downscaling is essential to improving the information available to climate adaptation, and it affects
impacts practitioners. However, these developments are currently fairly slow with little real progress or
change in large-scale messages between different generations — the CMIP3 (IPCC AR4) and CMIP5
The Status and Possible Evolution of Climate Projections in West Africa x(IPCC AR5) — of climate projections. If anything, model disagreement and uncertainty has increased in recent years as models have become more complex. Thus, the real challenge is in the area of planning or decision making given uncertain climate information. Traditional top-down approaches involved first producing climate projections for a particular region for variables such as mean temperature and annual rainfall. The projections are then examined in order to infer potential climate change impacts. Finally, adaptation plans, policy changes, or other decisions are made in order to avoid or reduce the consequences of these impacts in a particular sector. There are a number of problems with this approach. In order to gain a good insight into the potential impact of a changing climate it is necessary to have a good understanding of the socio-ecological- economic system involved. These systems are complex and incorporate non-linear feedbacks, non- climatic stressors, and cross-sector interactions. Moreover, first order projected changes in temperature or rainfall often fail to reveal the true vulnerabilities of such systems. Vulnerabilities can manifest through complex combinations of climatic stressors such as changing seasonality, rainfall intensity and temperature/rainfall relationships, multi-year droughts followed by heavy rainfall, and so on. Vulnerabilities also emerge through combination with non-climatic stressors such as urban migration, political instability, and economic crises. There is growing evidence that approaching the decision making process through cross-sectoral co- exploration of the climate information, analysis of historically impactful events and their drivers, and exploration of multiple possible future climate “stories” will produce better decisions and policies to reduce societal vulnerability to a changing climate. The Status and Possible Evolution of Climate Projections in West Africa xi
1.0 INTRODUCTION
At the request of United States Agency for International Development (USAID), the African and Latin
American Resilience to Climate Change (ARCC) project was tasked with assessing climate change
vulnerability in West Africa to help inform USAID activities addressing this vulnerability. As a sub-
component of the larger project, this report focuses on current understanding of climate projections,
their utility, and potential improvements in that utility. It addresses how future climate projections are
made, from the need for observations on the ground to dealing with uncertainty. A better understanding
of the limitations of current projections will also inform current decision making by providing donors
and governments the ability to identify variables that won’t be projected with reasonable certainty until
the distant future, as well as decisions that might be better delayed until projections have improved.
“Climate change is the greatest global challenge facing humankind in the 21st century” was the
declaration issued at the World Economic Forum in Davos, Switzerland in 2000. Since that statement
was made, how far has the scientific community progressed in terms of understanding climate change
and its potential consequences? This question is particularly relevant for West Africa, which has been
heavily impacted by climate in the past through crises of water availability, food security, mass migration
of people, and conflict. Population increase in West Africa has played its own role by putting significant
pressure on ecosystems, with the removal of vegetation in the grassland region of the north and
removal of forested regions in the south.
The progress of climate change science has been considerable over the past decade. To some extent
this has been enabled by advances in computational power and thereby the complexity and detail
captured by climate models. However, a possibly more important contribution has been satellite based
observations and intensive collaborative field observation campaigns, such as African Monsoon Multi-
disciplinary Analysis (AMMA). These observations have provided key data and evidence that has
informed significant advances in the understanding of regional and global scale climate systems. This
improved understanding has been incorporated into climate models, producing projections of future
changes to the climate system.
Clearly, there are still aspects of regional and global climate system dynamics that are poorly understood
and this introduces uncertainties into climate projections. Assumptions and simplifications have to be
made in climate models, which can produce contradictions and disagreements between models.
However, an equally important challenge lies in the interface between climate scientists and decision
makers. At the most basic level, miscommunication between the climate science community and
decision makers can often be attributed to the language or terminology used by the different groups
(e.g., see Box 1). Beyond basic terminology and conceptual understanding, the following questions
describe some key areas of importance related to the application of climate science to policymaking and
other adaptation decision making:
What is the utility of climate projections in decision making on particular time horizons and spatial
scales?
How best can climate projections, and their associated uncertainties, be communicated to decision
makers?
Can climate science and the production of climate projections respond in a more tailored way to
the information needs of the decision making process?
The Status and Possible Evolution of Climate Projections in West Africa 1Traditionally, climate projections have been provided through a top down approach where projections
are fed into the decision making process as one of a range of stressors involved. However, more
recently there has been a move to engage with climate science throughout the decision process. This is
more of a bottom up approach, strongly guided by descriptions of existing vulnerabilities and risks at
appropriate spatial and time scales. Climate projections are then explored in a search for evidence of
particular future risks under a changing climate. Projections are also used to explore the viability and
potential efficacy of proposed adaptation response measures. This report does not pre-suppose a
particular approach to incorporating climate projections into decision making processes but does draw
on an existing literature base that largely stands within the traditional top-down approach.
BOX 1. PREDICTION, PROJECTION, AND SCENARIO
A lot of confusion regarding climate change is often found in the language used by the scientific
community. Three of the common terms used to describe a future climate state are: prediction,
projection and scenario. According to the IPCC (2007) they are defined as follows:
Climate Prediction: “A prediction or climate forecast is the result of an attempt to produce a
most likely description or estimate of the actual evolution of the climate in the future (e.g., at
seasonal, interannual, or long-term time-scales).”
Climate Projection: “A projection of the response of the climate system to emission or
concentration scenarios of greenhouse gases and aerosols, or radiative forcing scenarios, often
based upon simulations by climate models. Climate projections are distinguished from climate
predictions in order to emphasize that climate projections depend upon the
emission/concentration/radiative forcing scenario used, which are based on assumptions,
concerning, for example, future socio-economic and technological developments that may or
may not be realized, and are therefore subject to substantial uncertainty.”
Climate Scenario: “A plausible and often simplified representation of the future climate, based on
an internally consistent set of climatological relationships, that has been constructed for explicit
use in investigating the potential consequences of anthropogenic climate change , often serving
as input to impact models. Climate projections often serve as the raw material for constructing
climate scenarios, but climate scenarios usually require information about other matters such as
the observed current climate. A ‘climate change scenario’ is the difference between a climate
scenario and the current climate.”
In some cases these terms are used interchangeably, which adds confusion to communities using
the information.
The layout of the report is as follows: Section 2 provides an in-depth account of the sources of climate
data, including how they are created or collected, and their individual strengths and limitations. The aim
is to provide the reader with background on the science behind climate projections. Section 3 covers
rainfall production in West Africa, from historical observations, current simulation and projected future
changes. With a population that is heavily dependent on rain-fed subsistence agriculture, arguably the
most important climatic variable in West African is rainfall. In addition, climate models are often
evaluated by how well they simulate regional rainfall patterns, both spatially and temporally, as well as
how they capture particular features that play a role in rainfall variability. Projections of rainfall also
introduce the largest sources of uncertainty into the projections. Projections of temperature introduce
significantly less uncertainty as the disagreement between models regarding projected temperature
changes is relatively small. It is for these reasons that the report is heavily biased towards rainfall. It does
not attempt to downplay other factors, such as the role of an increase in regional temperature, which
may be just as important as rainfall changes in the agriculture sector, or sea-level rises, which may be
The Status and Possible Evolution of Climate Projections in West Africa 2more of a concern for coastal residents. Chapter Four provides a synthesis summary of the report and presents some recommendations for where USAID efforts could be directed in West Africa. The Status and Possible Evolution of Climate Projections in West Africa 3
2.0 SOURCES OF CLIMATE
               INFORMATION
2.1 INTRODUCTION
A key foundation of responding to climate change is using climate information that is both relevant and
useful. A single source of climate data is not enough to develop a valid storyline of regional climate
change, which is why the climate science community relies on numerous sources of data. It also needs
to be recognized that the various types of climate data are only of value if used at the appropriate space
and time scales.
Observations form the building blocks of our understanding of the climate system (Figure 1). These
observations, such as that from in-situ data (e.g., rain-gauges) and remote sensing products (i.e.,
satellites), provide current and historical climate information, which is used to assess past trends and
variability. Although most users are only interested in weather and/or climate over land areas, the ocean
environment, which covers around 70 percent of the Earth’s surface, plays a vital role in the climate
system. For this reason, an intensive effort has been devoted to developing a better understanding of
ocean processes, through improved ocean observations.
      FIGURE 1. A SCHEMATIC OF THE AVAILABLE SOURCES OF CLIMATE
     INFORMATION AND HOW THEY FEED INTO ONE ANOTHER. IT IS THE
  COMBINATION OF THESE SOURCES OF INFORMATION THAT INCREASES OUR
             UNDERSTANDING OF REGIONAL CLIMATE CHANGE

                 Source: Jack, 2013
Computer models (e.g., GCMs and RCMs in Figure 1) provide another source of climate information,
with the most well-known output being future climate projections. Although the scientific community
attempts to use climate models to provide robust and useful information to assist decision makers,

The Status and Possible Evolution of Climate Projections in West Africa                                  4
future climate projections inherently incorporate a range of uncertainty sources, which is discussed in
this chapter.
2.2 OBSERVATIONS
2.2.1 In-situ Sources
In terms of surface-based weather observation platforms (e.g., rain-gauges, radiosondes, etc.), Africa is
mainly a data sparse region, which generates a problem for monitoring local weather and climate. Not
only are there challenges with spatial and temporal availability of data, but the data is further limited due
to the lack of quality control. These issues are not confined to the region, but are problematic
worldwide. An example of data scarcity over the African continent is illustrated in Figure 2. The data
used to create Figure 2 comes from the Global Precipitation Climatology Centre (GPCC) and are used
to create continuous global precipitation datasets at varying spatial resolutions. It is evident that only
isolated parts of southern Africa, East Africa, and West Africa contain sufficient data for a relatively
thorough historical climate analysis. It is possible that the figure may be misleading due to local weather
agencies holding longer data records. Apart from these data being costly to retrieve, they also involve
problems with quality control.
FIGURE 2. THE EVOLUTION OF AFRICAN RAIN
Source: GPCC. Gauge data incorporated into the Global Precipitation Climatology
Project (GPCC) since 1940 through 2000 at 20 intervals. Values refer to the
number of stations in each grid cell.
The Status and Possible Evolution of Climate Projections in West Africa 5In-situ observations are needed to assess the climate of the region, as well as any local trends
experienced. In addition, they are required to assess the skill5 of computer models in simulating the
climate, to validate remote sensing products, or to be used in data assimilation techniques to produce
reanalysis products (see Box 2). Arguably the most utilized type of in-situ source used in West Africa is
the rain-gauge. Daily rainfall data from rain-gauges, both automatic and manual, are extremely useful to
not only determine long term trends in a region, but also assists with evaluating changes in rainfall
characteristics, such as the onset, intensity, frequency, dry spells, etc. One of the most complete African
rainfall datasets is the African archive of rainfall data used by Nicholson (1986, 1993, and 2008). It
contains about 1300 station records, most of which begin before 1920 and extend to 19986. The data
have been incorporated into other global archives, such as the Global Historical Climatology Network
(GHCN). The difficulty of obtaining rain-gauge data for West Africa has been noted in the scientific
community. Nicholson (2013) suggests that it has become increasingly difficult to assess regional rainfall
changes in parts of West Africa due to the lack of rain-gauge data post-1990s. It is because of this lack of
ground-based observations that alternative data sources have become essential.
BOX 2. REANALYSIS PRODUCTS
Information from satellites and weather stations not only provides information on the current
state of the African continent, but is also used to inform reconstructions of the recent past
climate through various reanalysis projects. This process entails using the latest advances in
climate models and the assimilation of observations to reconstruct the past climate in a 3-
dimensional state. The latest version of reanalysis datasets, such as the Climate Systems
Forecast Reanalysis (CFSR) (Saha et al., 2010), contain output at a relatively high spatial (~38
km) and temporal resolution (six hourly). The advantage of such products is the complete spatial
coverage and relatively long time coverage (30+years). These products are therefore extremely
useful for studies of climate, particularly in data sparse regions. A summary of reanalysis
products available for research into West African climate is provided in Table A1in the Annex.
Although such data is used routinely in long-term climate studies, there are known limitations
with such reanalysis, particularly the earlier versions. For example, the use of NCEP Reanalysis
Data for historical analysis has been questioned by some researchers due to possible errors
identified in tropical divergent circulations and rainfall (e.g., Poccard et al., 2000; Kinter et al.,
2004) and some inconsistencies in Southern Hemisphere circulation (e.g., Tennant, 2004).
Additionally, it has also been noted that different reanalysis products exhibit different
characteristics in the West African region (Zhang et al., 2008; Meynadier et al., 2010). Thus,
caution should be applied when using the details of a single reanalysis product. In order to gain
more confidence in results using reanalysis data, new methods used to understand the climate
regime of a region have often included multiple reanalysis datasets instead of just a single source
(e.g., Nuygen et al., 2013).
5
Skill is a general term used to describe the ability of a model to represent reality. In practice a number of
different statistical methods are used to quantify model skill. Most methods have been developed within the
weather forecasting and seasonal forecasting fields though many can also be applied to model evaluation
on longer time periods.
6
There is no obvious reason why it ends at this particular date, but the author (Nicholson) has stated in a
recent paper that they have had difficult retrieving data since the late 1990s.
The Status and Possible Evolution of Climate Projections in West Africa 6Surface-based observations are not restricted to the land, with various observation platforms also
deployed in the ocean. The oceans play a central role in the climate system, on both short and long
timescales (e.g., circulation patterns and moisture transport affecting daily weather, while absorption of
excess heat and carbon dioxide (CO2) from the atmosphere playing a role in long term climate
patterns). A few examples of such ocean-based in-situ observations are autonomous floats, which form
part of the ARGO program (Figure 3), and, specific to West Africa, the PIRATA program (see Box 3).
The passive ARGO floats, which oscillate between the surface and depths of 2000 m, record
temperature, salinity, and pressure. These floats are deployed globally and return 100,000+ water
column profiles per year. Float profiles are digitized, collated, and quality-controlled at centralized
portals in near real-time, from where they are freely available. Additional gridded products7 are available
from multiple agencies at resolutions up to 0.5° and at monthly intervals from 2004 to present. ARGO
data is used (1) to observe regional oceanographic processes, (2) to monitor global ocean variability on
seasonal to decadal scales, (3) to constrain model evolution through assimilation schemes, and (4) in the
initialization of global climate models (e.g., included in CMIP5, which is discussed later).
FIGURE 3. DISTRIBUTION OF ARGO FLOAT REPORTS FROM AUGUST 13TH, 2013
Source: University of California-San Diego ARGO, 2013
While in-situ oceanographic information is internationally coordinated and widely available, often freely
and in real time, there is minimal information concerning locally deployed coastal instrumentation or
mooring systems. While investigations appear to have been conducted (e.g., the COCES/COCES-II
programs conducted by OGS, Trieste), data is sparse, not readily available, and lacks continuity. For
example, around 50 percent of the tide gauge data (Permanent Service for Mean Seal Level, 2013) from
West Africa is only available prior to 1993. Beginning in 1994, the World Ocean Atlas (WOA) program
synthesizes all observed oceanographic data into a gridded climatology of the world oceans (Levitus and
Boyer, 1994a, 1994b). The latest WOA product, was produced in 2009, and includes temperature
(Locarnini et al., 2010) and salinity (Antonov et al., 2010) at 1° x 1° resolution on 33 standardized depth
levels. The WOA products have been instrumental in uncovering the recent warming trend in the global
oceans (Levitus et al., 2000).
7
A gridded product refers to data that is based on or projected onto a latitude x longitude grid. The size of a
single grid determines the spatial resolution of the data and is usually given in degrees or kilometers.
The Status and Possible Evolution of Climate Projections in West Africa 7BOX 3. PIRATA
The Pilot Research Moored Array in the Tropical Atlantic (PIRATA) program, designed to
monitor tropical Atlantic processes, operates two permanent ATLAS buoy stations in the Gulf
of Guinea, providing surface meteorological and sub-surface information on salinity,
temperature, and ocean currents in the top to 500 m (Bourlès et al., 2008; Servain et al., 1998).
Data is available daily, in near real-time, and data provision will continue until late-2013. The
Sao-Tome island station, part of this array, transmits hourly sea level, sea-surface temperature
(SST), sea-surface salinity (SSS), and sea-level pressure (SLP) measurements (Figure 4). An annual
oceanographic research cruise to the western array, ongoing since 1997, deploys Expendable
BathyThermographs8(XBTs) and performs regular instrument casts to gather salinity
temperature and current data in the sub-surface. All cruise data and reports are available online
(PIRATA, 2013).
FIGURE 4.THE PIRATA BACKBONE OF ATLAS BUOYS (RED SQUARES),
NORTHEAST EXTENSION (BLUE STARS), SOUTHWEST EXTENSION (GREEN
CIRCLES), SOUTHEAST EXTENSION PILOT PROJECT (YELLOW TRIANGLE),
AND ISLAND-BASED OBSERVATION SITES (GREEN CROSSES). BUOYS WITH
BAROMETERS AND THE ABILITY TO ESTIMATE NET HEAT FLUX ARE
INDICATED WITH BLACK CIRCLES.
Source: PIRATA, 2013
2.2.2 Remote Measurements
Climate observations have advanced quite significantly since the inception of the satellite era. This is
predominantly due to satellites being able to cover an extensive range of space and timescales. A
primary source of information for West Africa is the data provided by the constellation of Meteosat
8
Obtains similar information to ARGO floats, but transmit only a single temperature/salinity profile while falling
through the water column at a pre-defined rate.
The Status and Possible Evolution of Climate Projections in West Africa 8Second Generation (MSG) satellites operated by the European Organisation for the Exploration of
Meteorological Satellites (EUMETSAT). The MSG satellites (Meteosat-8, -9, and -10) are the new
generation of European geostationary9 meteorological satellites, providing continuous observation of the
earth’s full disk centered on the Greenwich meridian (see Schmetz et al., 2002). These satellites cover a
large spectral range, from visible, known as either 'warm' or 'solar' channels, to infrared or 'cold'
channels. Eleven of the channels have a sampling resolution of around three kilometers and are able to
scan the full disk of the earth, while the HRV channel produces images with approximately one
kilometer resolution. Due to the satellite being geostationary it can produce frequent images over the
same area (±15 minutes intervals), which allows for rapid changes in the atmosphere to easily be
detected.
BOX 4. REMOTE SENSING OF THE OCEAN
Remote sensing of sea-surface temperatures (SST) of the ocean is another key component in
understanding West Africa climate. This is due to local SST patterns influencing regional
atmospheric circulation and hence, rainfall over West Africa (the importance of ocean SST is
highlighted later in the report). Prior to the satellite-era, observations of the sea surface were
sparse, and no large-scale picture of the ocean state existed. Since ~1979, remote sensing
platforms have produced near-continuous, globally-gridded data sets on the event (typically five
to seven days) and climate scales. Typically, SST data products are a synthesis of multiple
sources; remote and in situ, with some of the products highlighted in Table A2in the Annex.
Other ocean products derived from satellites include sea surface salinity (used to deduce river
outflow specifics, constrain model fields and close the global hydrological budget [Lagerloef,
2002]), sea surface height (used extensively in quantifying sea-level rise [Church, 2004, 2006]),
and upwelling dynamics (through primary productivity, the foundation for nearly all ocean food
webs). These types of observations can play a critical role in providing information for local
communities. For example, changes in upwelling dynamics of the Gulf of Guinea may have long
term impacts on phytoplankton biomass and community structure, with consequences for
regional fisheries. However, these products require regional validation, historically lacking in
African coastal waters.
Satellites, such as the MSG, are not only useful for detecting changes or processes in the atmosphere,
but also monitor surface conditions over the continents and ocean (see Box 4). One of the most useful
land surface products for West Africa has been the Normalized Difference Vegetation Index (NDVI),
which is used as a proxy for the state of vegetation. NDVI is calculated as the difference between near-
infrared (NIR) and visible (VIS) reflectance values normalized over the sum of the two (Eidenshink,
1992). This product has been widely used by the scientific community to estimate green biomass and
plant productivity. It can also be used to reflect local climate variability, such as changes in rainfall and
temperature. The loss of vegetation or desertification was once seen as one of the key drivers of the
Sahelian drought in the 1970s and 1980s (discussed in section 3). It is for this reason that many studies
9
Geostationary Satellite – A satellite that orbits the equatorial plane (altitude around 22,000 miles) at the
same speed as the Earth rotates and thus, always observes the same area of the Earth’s surface.
The Status and Possible Evolution of Climate Projections in West Africa 9have used NDVI to monitor the response of vegetation to climate changes in the West Africa (e.g., Malo
and Nicholson, 1990; Anyamba and Tucker, 2005).
With regards to rainfall, due to the sparse location of global rain-gauges, satellites are used to fill the
void in information. Thus, one of the main challenges of the weather satellite observation-era has been
to improve satellite based rainfall estimates (i.e., using the satellite data to determine how much rainfall
fell in a specific location). Early methods used to infer satellite-based rainfall estimates were based on the
reflectivity of clouds and from cloud top temperature, which are provided by the visible and infrared (IR)
data from geostationary satellites (e.g., Arkin and Meiser, 1987). Although this approach provided data at
relatively greater spatial and temporal resolution than rain-gauge data, these approximations proved to
be ineffective due to the weak link between these particular cloud properties and rainfall (Ebert et al.,
2007). Essentially, it was the development of passive microwave sensors aboard polar orbiting satellites10
that improved the accuracy, coverage, and resolution of rainfall estimates. One such example is that of
the Tropical Rainfall Measuring Mission (TRMM) satellite, which was launched in November 1997
(Simpson et al., 1988; Kummerow et al., 1998).
Merged rainfall products were the next innovation of the satellite era. These products work by
combining data from numerous satellites and their various onboard sensors, which are then adjusted
with rain-gauge data to correct for biases in the satellite based estimates. Initial merged products, such
as the Global Precipitation Climatology Project (GPCP) (Huffman et al., 1997; Adler et al., 2003), were
relatively low in resolution on both temporal and spatial scales (monthly and 2.5°x2.5° latitude-longitude
grid) and thus, were inadequate for monitoring finer-scale rainfall features. Since then, rainfall products,
such as TRMM, have been produced at a higher spatial (e.g., 0.25° x 0.25°) and temporal resolution (e.g.,
3-hourly rainfall totals). One limitation with using such products is that they are only available from the
end of the 20th century / beginning of the 21st century. A summary of the available rainfall datasets that
cover West Africa is provided in Table A3 in the Annex.
The full utilization of satellite-based rainfall datasets remains hindered by the uncertainty and unreliability
associated with the rainfall estimates. Validation studies have shown that such products can work
particularly well in some environments (e.g., locations where convective rainfall dominates), but can
perform poorly in others (e.g., locations with high topography). However, given the limitations of rain-
gauge datasets within many regions around the world, the use of satellite rainfall products appears to be
a feasible solution to fill the void. It is for this reason that numerous satellite-derived precipitation
validation studies (i.e., “ground truthing”) have been conducted over the past few years (e.g., Adler et
al., 2001; Wolff et al., 2005; Huffman et al., 2007; Ebert et al., 2007,and others) and are continuing to
take place.
Overall, satellites play an integral part in collecting information that is used to advance the science
community’s knowledge of regional climate patterns. They provide a unique platform to continuously
monitor the land, ocean, and atmosphere at various timescales, depending on the type of satellite and
the instruments on board. Two of the key limitations of such a data source are that the information
provided is only available for the last few decades of the 20th century (best case scenario) and that the
products often require extensive validation.
10
Polar Orbiting Satellite – A satellite that orbits the Earth at low altitudes (~600 miles) crossing the equator
every few hours. The low altitude allows for finer resolution but means that the satellite is always moving
relative to the earth, requiring far more complex post-processing and analysis of the resultant image stream.
The Status and Possible Evolution of Climate Projections in West Africa 10You can also read