Reproduction number (R) and growth rate (r) of the COVID-19 epidemic in the UK: methods of estimation, data sources, causes of heterogeneity, and ...
←
→
Page content transcription
If your browser does not render page correctly, please read the page content below
24 AUGUST 2020

Reproduction number (R) and growth rate (r) of
the COVID-19 epidemic in the UK: methods of
estimation, data sources, causes of heterogeneity,
and use as a guide in policy formulation
This rapid review of the science of the reproduction number and growth rate of COVID-19
from the Royal Society is provided to assist in the understanding of COVID-19.
This paper is a pre-print and has been subject to formal peer-review.

1. Executive summary                                                     required in the UK (as a proportion of the population), that
Purpose of the report                                                    must be effectively immunised to halt transmission and
This paper examines how estimates of the reproduction                    protect the population when a vaccine becomes available.
number R and the epidemic growth rate r are made, what
data are used in their estimation, the models on which the               There remains much uncertainty in estimates of key
estimation methods are based, what other data sources and                epidemiological parameters defining the growth and
epidemiological parameters could be employed to assess the               decay of the epidemic and, concomitantly, the impact of
effectiveness of social distancing measures (‘lockdown’) and             the relaxation or strengthening of control measures. This is
to evaluate the impact of the relaxation of these measures.              largely due to data availability and quality. This uncertainty
                                                                         must be factored into policy formulation.
Throughout this report we refer to the reproduction number
as R. This number reflects the infectious potential of a                 The responsibilities of SAGE with respect to COVID-19
disease. R0 represents the basic reproduction number,                    will eventually be taken over by the new Joint Biosecurity
which is the number of secondary infections generated                    Centre (JBC) which is to be part of a new body called the
from an initial case at the beginning of an epidemic,                    National Institute for Health Protection (NIHP) to replace
in an entirely susceptible population. In contrast, Rt is                Public Health England (PHE). This new body will also
the reproduction number at time t since the start of the                 include existing Test and Trace activities. This JBC must
epidemic. As more individuals are infected or immunised,                 seek independent scientific advice on epidemiology, and
Rt captures the number of secondary infections generated                 mathematical plus statistical analyses of infectious disease
from a population consisting of both naïve/susceptible and               transmission and control. The UK university sector has world
exposed/immune individuals and therefore it both changes                 renowned expertise in infectious disease epidemiology
in value over time and will always be less than R0.                      and JBC, like SAGE before it, should make full use of this
                                                                         independent resource.
Overall conclusions
High quality data underpins the ongoing assessment of                    As the Government response to the COVID-19 pandemic
key epidemiological parameters, such as the reproduction                 reaches the end of its first phase, there are opportunities to
number, R, which defines the average number of secondary                 be taken and some important challenges to be met. Specific
cases generated by one primary case, and the growth rate                 opportunities include greatly improving data collection and
of the epidemic, r. The pristine value of R at the start of the          management – and putting in place as quickly as possible
epidemic, R0, gives wide insights into the epidemiology of               an effective ‘Test and trace’ system for the UK. Both are of
the virus, such as determining the level of herd immunity                immediate and high priority. The challenges include the

REPRODUCTION NUMBER (R) AND GROWTH RATE (r) OF THE COVID-19 EPIDEMIC IN THE UK • 24 AUGUST 2020                                           1
creation of a high level of research expertise within the new            Science and research orientated conclusions
body (JBC) in the many fields that are required to tackle                A wide variety of models of COVID-19 transmission, data
a novel epidemic. The new body should be an informed                     sources and methods of parameter estimation have been
customer that distils knowledge for policy formulation, rather           employed to advise SAGE through SPI-M on transmission
than a creator of that knowledge.                                        and control within the UK. This is a strength.

Uneven data quality and slow access to information                       More comparative studies of model outcomes need to be
on COVID-19 spread and impact collected by different                     conducted in the near future to examine the sensitivity of
government organisations such as Pubic Health England,                   epidemiological predictions to model structure, the data
Office for National Statistics (ONS) and NHS Trusts have                 source used and parameter uncertainty with the aim of
been a major impediment to good epidemiological analysis                 improving analyses supporting policy formulation.
of the state of the epidemic and predictions of future trends.
Timely access through one portal, and ensuring that data                 With regards to reproduction numbers and rates, the two
definition, accuracy and consistency over time are of the                parameters, R and r, measure different facets of epidemic
highest standards possible are essential. An authoritative               pattern. Negative values for the growth rate in infections,
body should both acquire timely and relevant data at scale               r, clearly reveals a contracting epidemic, while if the
across government bodies and distributing it openly through              reproduction number of the virus, R, is less than unity
a carefully curated portal. Careful thought should be given              in value, onward transmission is insufficient to sustain
to how a national data base is effectively fed by local public           the infection in the population in the longer term and is
health bodies, and how in return this national information               therefore the desired outcome of control measures.
portal feeds back to facilitate local action. The National
                                                                         The growth rate, r, is more easily measured than the
Statistician has a key role here, as do societies such as the
                                                                         reproduction number R. The latter however, provides more
Royal Society, the Academy of Medical Sciences, and the
                                                                         information about the impact of control measures given the
Royal Statistical Society.
                                                                         very non-linear epidemic curve for COVID-19 which will have
The most informative data on epidemic trends arise from                  a long right-hand tail, possibly with further peaks due to
longitudinal (over time) cohort based (following the same                resurgence, which complicates the interpretation of r. The
individuals) studies of seroprevalence of past infection and             magnitude of R at the start of the unmitigated epidemic (R0)
the incidence of new infections, stratified by the appropriate           also provides information on what level of herd immunity
variables such as home and work locations, age, gender                   must be created by those recovered from infection and
and ethnicity. The UK needs to greatly expand collection                 vaccination to halt transmission.
of these data and to continue to review the sensitivity and
                                                                         Lock down measures and modifications in behaviour may
specificity of the currently available diagnostic tests (both
                                                                         not totally eliminate the occurrence of local outbreaks of
antibody to detect past infection and the polymerase chain
                                                                         infection that are patchy in nature across time and space.
reaction (PCR) to detect current infection).
                                                                         These do not necessarily mark the beginning of the second
Effective contact tracing at scale which relies on testing for           wave, provided the average R value across the country
active viral infection is an essential part of the ability to control    (or a defined region) is less than unity in value. Targeted
and limit chains of transmission, especially so-called ‘super-           measures and good contact tracing are required to bring
spreading’ events where a single individual is responsible for           local outbreaks rapidly under control.
transmitting infection to many other people. A high degree
                                                                         If patterns of human behaviour (eg mixing and movement)
of competence in this area, notably before a summer or
                                                                         return to the pre-epidemic state, the pristine value of the
autumn resurgence in incidence is essential. This information
                                                                         basic reproduction number, R0, in the UK will be reduced
is needed for the day to day management of the epidemic, it
                                                                         somewhat by any herd immunity created by people who
also feeds into making forward projections through models of
                                                                         have recovered from infection. This level is low at present
trends that give advanced warning of resurgence.
                                                                         hence each new case of infection is likely on average to
Given the importance of testing for active viral infection in            generate two to three further cases and the epidemic will
any expanded contact tracing system to improve control                   rapidly increase again with a doubling time of 3 – 5 days.
measures, the provision of adequate testing facilities with
a fast turn round time is an important requirement.

REPRODUCTION NUMBER (R) AND GROWTH RATE (r) OF THE COVID-19 EPIDEMIC IN THE UK • 24 AUGUST 2020                                        2
COVID-19 research priorities must include reducing                       Uncertainty
uncertainties about and heterogeneities in key                           The estimates of the epidemic growth rate r and
epidemiological parameters, such as the level and duration               reproduction number R are affected by many sources
of infectiousness in infected people who never show                      of variability and these have not been clearly explained
clear symptoms of infection, and the average duration of                 model by model.
infectiousness prior to the appearance of symptoms in
those who do show clear symptoms of COVID-19 infection.                  Uncertainty intervals so far reported on estimates of the
The average values of these parameters have a very big                   reproduction number R are too narrow – much more
impact on the epidemic pattern and the severity of control               uncertainty exists in the estimates depending on many
measures required for effective control.                                 factors, including substantial variability between infected
                                                                         people on how many individuals they transmit the
Specific longitudinal (over time) studies on the duration                infection on to.
of seropositivity to COVID-19 in both symptomatic and
asymptomatic infected people are an urgent priority, as is               If these estimates of R and r are based on deaths, then they
understanding how seropositivity correlates with protective              reflect transmission weeks before. If based on confirmed
immunity and its duration.                                               cases, then the temporal trends in the data may be affected
                                                                         by changes in testing strategies and capacity for data
The rate of change of the epidemic growth rate r (the                    capture and reporting.
second derivative of the incidence) is informative since it
can be an early indicator of the effects of a slow release in            Uncertainty bounds should be placed on the estimated R
lock down measures but due note must be taken of the non-                and r values model by model, with methods and underlying
linear character of epidemic growth and decay phases.                    assumptions described, ideally stratified by region as well
                                                                         as the time window over which the estimates refer to.

                                                                         Uncertainty intervals on the epidemic growth rate, r, in a
                                                                         defined region are narrower relative to an average value
                                                                         than those on R and, as such, r is a useful measure of the
                                                                         state of the epidemic.

                                                                         Ideally estimates of r and R should be reported together
                                                                         region by region in the UK. However, it is important to note
                                                                         that for many of the published methodologies, determining
                                                                         the value of R requires calculations and information
                                                                         in addition to estimating r, which introduces greater
                                                                         uncertainty for this measure.

REPRODUCTION NUMBER (R) AND GROWTH RATE (r) OF THE COVID-19 EPIDEMIC IN THE UK • 24 AUGUST 2020                                         3
Contents
                   1. Executive summary		                                                            1

                   2. Objectives of this paper                                                      6

                   3.	How advice is given to government on the epidemiology and control
                        Of the covid-19 epidemic                                                    6

                   4. Definitions of key epidemiological parameters                                 7

                       4.1   The reproduction number, R                                             7

                       4.2	The components of the basic reproduction number, R0                     7

                       4.3 The effective reproduction number, R, at time t                          9

                       4.4 Time between one infection to the next                                   10

                       4.5 The generation time, Ƭ                                                   10

                       4.6 Serial interval, s                                                       10

                       4.7 Dynamic relationships                                                    10

                       4.8 Epidemic growth rate, r                                                  11

                       4.9 The doubling time of the epidemic, dt                                    11

                       4.10	The probability distribution of R in a defined population              12

                       4.11 Inferring R from deaths or diagnosed cases                              15

                   5.	Sources of variability in model predictions and the estimation of r values   16

                       5.1	Structural variability arising from different model assumptions         16

                       5.2 Parameter assignments informing COVID-19 models                          17

                       5.3 Spatial and social heterogeneity                                         18

                   		        5.3.1    Stochasticity – chance effects                                18

                   		        5.3.2	Dynamics of R close to 1 – outbreaks of increasing size         18

                   		  5.3.3	Maintenance of a low R in the community? –
                   				       The impact of hospitals and care homes                                19

REPRODUCTION NUMBER (R) AND GROWTH RATE (r) OF THE COVID-19 EPIDEMIC IN THE UK • 24 AUGUST 2020      4
6. Model parameter estimates                                                                     19

                       6.1	Incubation period (time from infection to symptom onset)                                19

                       6.2 Generation time and serial interval                                                      20

                       6.3	Exponential growth rate r of the epidemic                                               20

                       6.4 Onset of symptoms to death                                                               22

                       6.5	Duration of onset of symptoms to hospital admission                                     22

                       6.6	Proportion of infections that are asymptomatic and their contribution to transmission   23

                   		        6.6.1	Infectiousness of asymptomatic individuals                                      24

                   		        6.6.2	Duration of infectiousness of asymptomatic individuals                          24

                   7. Data sources in the uk                                                                        31

                       7.1   Case numbers                                                                           34

                       7.2 Mortality data                                                                           38

                       7.3 Serology and cohort studies                                                              39

                       7.4 Contact tracing                                                                          40

                   8. Data management, collection and access to information                                         42

                       8.1 Serological surveys                                                                      42

                       8.2 Trace and treat                                                                          42

                       8.3 Data management and access                                                               42

                   9. Diversity of models used by SPI-M to inform sage                                              43

                   10. Methods of estimation of R and r and the representation of uncertainty                       47

                   11.	What is the best epidemiological measure of the current pattern of the epidemic
                        And what is the best data to use to get estimates?						                                    51

                   12. Discussion                                                                                   52

                   13. Appendix 1                                                                                   54

                   14. Appendix 2                                                                                   56

                   15. Appendix 3                                                                                   73

                   16. Appendix 4                                                                                   74

                   17. References                                                                                   75

REPRODUCTION NUMBER (R) AND GROWTH RATE (r) OF THE COVID-19 EPIDEMIC IN THE UK • 24 AUGUST 2020                      5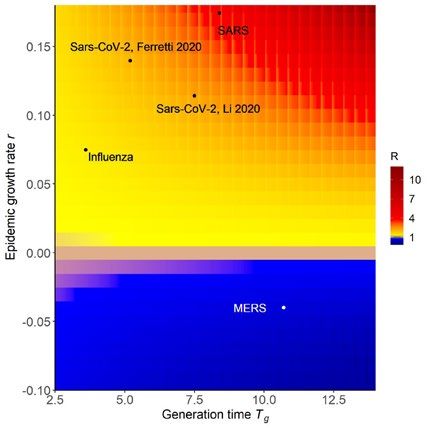
2. Objectives of this paper                                              3. How advice is given to government on the epidemiology
A committee of the Royal Society, Science in Emergencies                 and control of the COVID-19 epidemic
Tasking – COVID (SET-C), was set up to respond to                        The advice given to government through the Chief
questions on COVID-19, from the Chief Scientist and Her                  Scientific Advisor on the COVID-19 epidemic is guided at
Majesty’s Government (HMG), and to provide a timely                      present by the Scientific Advisory Group for Emergencies
view of the science that could contribute to assessing and               (SAGE) subgroup Scientific Pandemic Influenza Group on
improving the impact of implemented or planned control                   Modelling (SPI-M), which is focused on the epidemiology
policies. The membership is listed in Appendix 4.                        and mathematical modelling of the course of the epidemic
                                                                         and the impact of various interventions. The responsibilities
The committee set up a small subgroup (membership also                   of SAGE (and hence SPI-M) will be progressively transferred
listed in the Appendix 4) to examine how estimates of the                over the coming months to a new body entitled the Joint
reproduction number R and the epidemic growth rate r are                 Biosecurity Centre (JBC). This Centre, along with Public Health
made, what data are used in their estimation, the models                 England and Test and Trace activities, are to be merged into a
on which the estimation methods are based, what other                    new body entitled the National Institute for Health Protection
data sources and epidemiological parameters could be                     (NIHP). It has been the tradition on government committees
employed to assess the effectiveness of social distancing                convened to advise on the control of novel epidemics to
measures (‘lock down’) and to evaluate the impact of the                 invite a number of modelling groups based in universities
relaxation of these measures.                                            and Public Health England (PHE) to generate predictions of
                                                                         the course of the epidemic and the impact of various control
Details on the definition of R, r and other key                          strategies. For COVID-19, given its importance as a source
epidemiological parameters are presented, as are                         of serious morbidity and high mortality (a case fatality ratio
methods of estimation and the construction of some sort                  currently estimated as between 0.5 to 1.0%2), ten groups
of uncertainty interval around an estimate. In brief, the                were invited to make predictions for consideration by SPI-M.
reproduction number of an infectious disease Rt at time                  These groups use a variety of different models, different
t is the average number of secondary cases of infection                  assumptions about the biology and epidemiology of the virus
generated by one primary case over a defined past time                   and different sources of data on which to base estimates of
interval1. This epidemiological parameter changes as an                  key parameters. One of these is the effective reproduction
epidemic progresses due to both herd immunity (the fraction              number of the virus at time t in a defined population, Rt, which
of a population who have had the infection and recovered                 is discussed in detail in the following section.
to develop immunity – for COVID-19, for an unknown period
of time), and as a consequence of control measures such as               SPI-M has the difficult task of coalescing the results from the
social distancing (‘lock down’ is an extreme form of social              different models into one coherent narrative for SAGE, on, for
distancing) and vaccination.                                             example, how the parameter Rt is changing under lock down
                                                                         or its gradual lifting, in defined regions of the country. The
This report focuses on data sources, the methods and                     approach adopted is to seek a consensus from the different
models employed in the estimation of key epidemiological                 groups, independent from views about the sophistication of
parameters, the assumptions made within models employed                  the models employed or quality of data used.
to make predictions, and on sources of heterogeneity in R
                                                                         In the case of the reproduction number, R, a range of model
and r. The latter aspect is geared to provide insights into the
                                                                         frameworks and estimation procedures have been employed
uncertainty surrounding given estimates and what relevance
                                                                         given a range of different data sources. Some models
this has for the advice given to policy makers. Parameters
                                                                         estimate R, some r, and some both. Estimates of R and r
other than R and r which give insight into the course of
                                                                         depend on the data sources employed and models used.
the epidemic and the impact of implemented mitigation
                                                                         Methods of estimation vary between the groups and as such
measures are also discussed. Particular attention is given to
                                                                         the different estimates are compared and the members of the
data collection, management and access.
                                                                         sub-group collectively agree a range which R and r are likely
                                                                         to lie within. The estimates presented to SAGE are typically
                                                                         stratified by region of the UK and city in some cases.

                                                                         This is a sensible and pragmatic approach when decisions
                                                                         are required rapidly to inform policy and when many
                                                                         uncertainties exist about what is the most appropriate model
                                                                         framework, the typical course of infection (and how this
                                                                         varies between people), what are the best data sources and
                                                                         how best to estimate R.

REPRODUCTION NUMBER (R) AND GROWTH RATE (r) OF THE COVID-19 EPIDEMIC IN THE UK • 24 AUGUST 2020                                        6
4. Definitions of key epidemiological parameters                         For an infectious agent of humans, R0 > 1 if an infectious agent
4.1 The reproduction number, R                                           is to be capable of invading and establishing itself within a
Throughout this report we refer to the reproduction number               human population. The objective of many outbreak control
as R. This number reflects the infectious potential of a                 programmes is to lower the number of onward infections
disease. R0 represents the basic reproduction number,                    per infectious individual to less than unity by whatever
which is the number of secondary infections generated from               measures are available such that the infection cannot
an initial case at the beginning of an epidemic, in an entirely          persist in a defined population. When R0 < 1 the infection
susceptible population. In contrast, R is the reproduction               cannot be established in the population and dies out. On
number at any time during an epidemic, which changes                     the appearance of COVID-19 late in 2019, no treatments or
over time. As more individuals are infected or immunised,                vaccines were available (nor are vaccines available today,
R captures the number of secondary infections generated                  some therapeutics have been tested and a few show benefit
from a population consisting of both naïve/susceptible and               in terms of reducing mortality for seriously ill patients), such
exposed/immune individuals and therefore will always be                  that social distancing was (and is) the only measure available
less than R0. R can sometimes be expressed as Rt, reflecting             to mitigate the spread of the virus and reduce its impact on
the fact that it changes over time t. Alternatively, it can also         net morbidity and mortality until vaccines and therapeutic
be referred to as Re. In summary, reference to the basic                 agents (drugs or biologicals) are developed.
reproduction number refers to transmission potential at the
beginning of the pandemic, and the effective reproduction                R0 is a composite measure of various features of the
number to the potential during the pandemic at a specified               infectious agent that include the typical course of infection
timepoint. All these measures will vary greatly between                  within a person (clinical epidemiology) and variation
regions due to different levels of density, demographics, and            between people, and how this pattern impacts the likelihood
immunity in a community.                                                 of transmission between people. Net transmission within
                                                                         a population is therefore influenced by both the typical
The epidemic growth rate, r, represents the number of new                course of infection in a person, and social plus behavioural
infections at an increasing or decreasing exponential rate.              features of the human host population. The precise details
It is dependent on the reproduction number and timescale                 of how R0 is constituted depend critically on many biological
between infections. From herein, as we define these                      and behavioural factors, and what is either known, or
concepts further we will refer to these parameters solely by             assumed, is central to model formulation of infectious agent
their symbols for simplicity.                                            spread and control, and often the estimation of R0, from
                                                                         defined data sources. A later section will focus on the data
R0, and Rt, are related quantities in epidemiology. Many                 sources and various factors that create heterogeneity in the
of the key insights and much of the intuition around these               estimation of R0.
concepts are based on an understanding of R0, and so we
focus on this initially.                                                 4.2 The components of the basic reproduction number, R0
                                                                         Before moving on to COVID-19 specifically, a simple
R0 is the average number of secondary cases generated                    illustration is provided to outline key relationships between
by an average infected person throughout their infectious                the biology of an infection and the reproduction number. We
period in a wholly susceptible population (no herd immunity)             consider an infectious disease that infects people at a per
in which no mitigation strategies are in place (whether                  capita rate β per unit time. At the population level, there is
these be social distancing, immunisation or prophylactic                 then a net rate of infection proportional to the fraction of the
and/or infected person treatment that suppresses the                     population infected multiplied by the number of susceptible
typical duration and/or the intensity of infectiousness). It is          people, a non-infectious and asymptomatic but infected
an important epidemiological parameter for all infectious                period of 1/g, and an infectious and symptomatic period of
diseases3. It is essentially a concept that is analogous to              1/α days. Once an individual has recovered from infection,
the ‘net reproductive value’ in human demography first                   life-long immunity to reinfection that results in infectiousness
described in 1930 which defines whether a population will                to others is assumed. This is the classical SEIR model, and
expand or decay4. The concept is central to any discussion               various adaptations to this model type form the template
of the population biology of an organism. Infectious                     for most of the mathematical models of COVID-19 spread
disease epidemiology combines the population biology                     (but with much more complexity included and often within
of the infectious agent within the human host and within                 an individual-based stochastic framework where events are
a defined population.                                                    modelled person by person and/or regions by region).

REPRODUCTION NUMBER (R) AND GROWTH RATE (r) OF THE COVID-19 EPIDEMIC IN THE UK • 24 AUGUST 2020                                         7
In Appendix 1, Figure A1 gives an idea of the diagrammatic               Figure 2 (and Figure A1 in Appendix 1) gives a diagrammatic
framework that results from these assumptions and                        representation of these assumptions including one of full
the algebraic definition of R0 given the biological and                  immunity for a year or more. It is important to note how
epidemiological assumptions made.                                        changing the assumptions about the course of infection in
                                                                         an individual, how the human population behaves and the
An idea of how different biological assumptions determine                classification of the population into two groups of people,
R0 and illustration for the simplest susceptible, incubation,            one who experience symptoms the other who do not,
infectious and recovered (SEIR) model is provided in Figure              greatly complicates the definition of Rt (see next section
1 with how R0 is specified in terms of the key rates of                  – it is R0 modified by the partial or full isolation) and its
movement between the classes and infection rates.                        constituent parameters.

The known biology and epidemiology of COVID-19 is                        Those not versed in research on infectious disease
more complex than this, with some important modifications                epidemiology might ask why the estimation of R0 or Rt
including asymptomatic individuals, who may or may not be                is such an important measure of the progression of an
infectious to others5 a pre-symptomatic infectious period                epidemic or why it might be of use in policy formulation.
and the impact of partial or full (‘lock down’) isolation to             Clearly, cumulative case numbers, cases newly diagnosed,
prevent onward transmission. A ‘known unknown’ is the                    deaths attributable to the infection, and instantaneous rates
duration of immunity post recovery. Limited data from other              (or discrete time finite rates) of growth or decay in cases
coronavirus infections suggest full immunity to reinfection is a         (the term rt at time t), the number of deaths or seropositives
matter of months rather than years for SARS and MERS6,7,8 but            (possessing antibodies to COVID-19 viral antigens which
it is not clear if those reinfected are again infectious to others       indicate past infection) all provide valuable information on
or exhibit symptoms of infection that result in measurable               the progression of the epidemic (eg growing or declining)
morbidity9,10. There may of course be ‘unknown unknowns’                 and the impact of mitigation measures. Observers can tell
(meaning unmeasured parameters and unknown pathways of                   by eye if cases/deaths are going up or down.
infection, transmission and disease) – time will tell.

 FIGURE 1

The flow chart for a simple SEIR model. Here R0 = βN/σ where β is the transmission parameter which encapsulates many
epidemiological, environmental and social factors, and 1/σ is the average duration of infectiousness and it is assumed that the
net rate of transmission is directly proportional to population size N (who are all susceptible at the beginning of the epidemic).

                                              Infected but                      Infected and                    Recovered
            Susceptible
                                             not infectious                       infectious                   and immune
                S
                                                    E                                  I                            R

REPRODUCTION NUMBER (R) AND GROWTH RATE (r) OF THE COVID-19 EPIDEMIC IN THE UK • 24 AUGUST 2020                                           8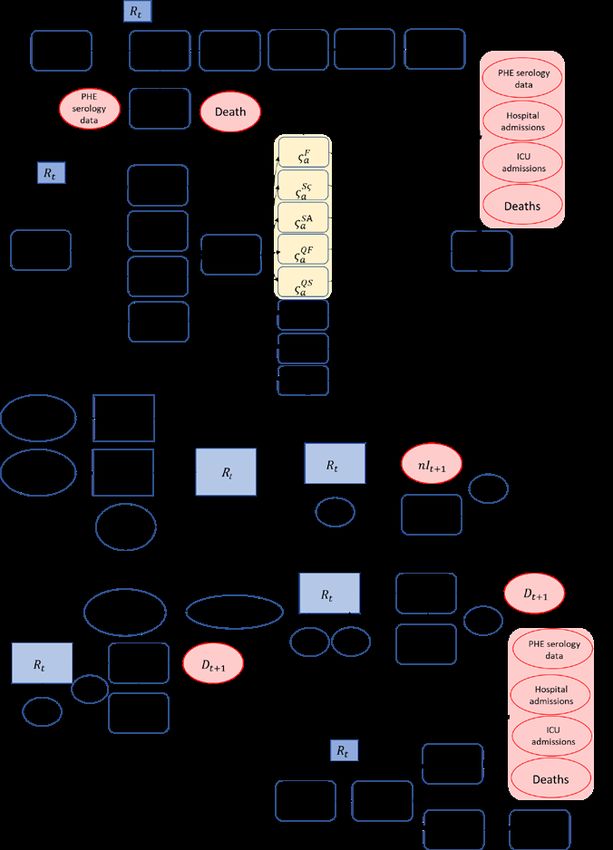
The value of R matters – not just whether it is greater or               4.3 The effective reproduction number, R, at time t
less than 1 – but because the value of R when greater than               Rt is the average number of secondary cases generated
unity tells you what proportion of new infections you need               by one infected person during the epidemic. Even in an
to prevent in order to go from increasing incidence to stable            unconstrained epidemic, this changes through the course
or decreasing incidence. In addition, the magnitude of R0                of an epidemic. For example, the reason that an epidemic
also provides information on what level of herd immunity                 of an immunising infection reaches a peak and starts to
will drive the value of R to less than unity such that the               come down is that the population is saturated, there are
infection cannot persist. This gives the target for vaccination          fewer people to infect, and R falls. Mitigation strategies aim
programmes of what fraction of the community to immunise.                to reduce transmission from its baseline value of R0. For
As a rough approximation, the expression p=1-1/R0 gives the              control strategies to be judged as adequate, R must fall
critical proportion (or percentage) p that must be immune if             below unity in value for cases numbers to decline.
transmission is to be halted. For a value of 2.5 as recorded
in Wuhan in the early stages of the epidemic, this critical              There are some important nuances in defining Rt during an
proportion is 0.6 or 60%.                                                epidemic. There are two main definitions, sometimes called
                                                                         the instantaneous, or backward looking R12,13 or the case, or
For policy makers, it would seem sensible to make use                    forward-looking R14. Consider an epidemic where there was
of a variety of epidemiological indicators, including                    an effective intervention and cases began to fall. What was
cases diagnosed, deaths recorded and estimates of R,                     R for cases infected at the time when the intervention was
taking due note of data reliability and the accuracy of the              put in place? For the backward-looking R, it is calculated
methods employed in estimation. This is especially the                   under the assumption that the future is not known, and so
case if case numbers are low in a small spatial location                 it is the Rt for cases infected at that time, assuming nothing
since chance (= stochastic) effects will affect the accuracy             changes in the future. For the forward-looking case R, it is
of measurement.                                                          calculated using the data after these cases were infected,
                                                                         estimating the actual number of infections caused by those
                                                                         people infected at that point in time, which is lower as a
                                                                         consequence of the interventions.

 FIGURE 2

One possible flow chart of a simple epidemic model for COVID-19 of individual states and pathways representing rates of
transfer between states. The top pathway is for asymptomatics with mild or no symptoms who stay in the community and
eventually recover – but contribute to transmission. The bottom pathway is for those with clear symptoms who either self-
isolate or get admitted to hospital. No social distancing or lock down is represented in the diagram. Below the flow chart is
the Rt equation that arises from this flow chart. It is an effective reproduction number because self or mandatory isolation
takes place. In this equation 1/α is the average number of days it takes from symptom onset to isolation (a measure of control).
The term p is the fraction of people with clear symptoms and the β terms are the infection rates from each infectious state, while
the ȣ terms define rates of leaving a given state (1/ȣ is the average duration of stay)11.

REPRODUCTION NUMBER (R) AND GROWTH RATE (r) OF THE COVID-19 EPIDEMIC IN THE UK • 24 AUGUST 2020                                           9
When the dynamics of an epidemic are changing on a                       As highlighted in this simple equation, the generation time
timescale which is similar to the timescale of one infection to          is a crucial determinant of r. Early in the COVID-19 epidemic,
the next (see below), this nuance can be important. For the              it was noted that although the incubation period (the time
most recent data, we cannot see the future and so only the               from infection to symptoms) was on average about 5 days,
backward-looking, instantaneous R can be estimated, and                  the r was so fast that it was likely there was pre-symptomatic
care must be taken with censoring (we may not yet have seen              infectiousness. A further complication is the likelihood that
all the infections generated by people infected recently), and           the epidemic started in the UK well before January 2020.
so this distinction is not so important. However, when looking           For different model assumptions on the underlying natural
back to see which interventions have been effective when,                history of infection and how this is distributed across the
the two methods may give different timing of a decrease in R,            population, the relationship is more complex and can give
leading to different policy implications15.                              very different estimates for similar input parameters21,22.

4.4 Time between one infection to the next                               4.6 Serial interval, s
R is informative about the dynamics of an infectious disease             Serial intervals describe the average time between symptoms
and the effort required to control it. However, it does not,             of infection in the transmitter to when the person he or she
on its own, characterise the timescale over which the                    infects develops symptoms. It is easier to measure than
epidemic will grow. This is dependent on the time between                the generation time as symptom onset is easier to identify
one infection and the next. There are two key quantities                 than time of infection acquisition. This value is often used
which are used to describe the time between infections: the              interchangeably with the generation time since it is easier
generation time and the serial interval. There are important             to measure via contact tracing studies. However, in the case
differences between these quantities, and they must be                   of COVID-19 it has less relevance given that many infections
carefully used when relating r and R.                                    especially in the young do not seem to generate marked
                                                                         and easily identifiable symptoms. Some studies suggest that
4.5 The generation time, Ƭ                                               between 5% to 80% of infected people do not show clear
The generation time, Ƭ, for an infectious disease is the                 symptoms of infection (Table 1). This very wide range depends
time between infection events in an infector-infectee                    on many confounding variables such as age, gender, location
pair of individuals. In conjunction with estimates of R, the             and the existence of other predisposing medical conditions.
generation time can provide insights into the speed of                   Some of the more precise studies have been connected
COVID-19 spread; driven by the profile of infectiousness                 with epidemics on ships such as the Diamond Princess
over time (see above) and arises from the model                          cruise ship, where in a sample of 640 people tested, 18%
assumptions. It is challenging to measure directly as it is              reported no symptoms (on average an older population than
hard to ascertain time of infection due to the fact it is usually        other examples perhaps connected to lower proportion
unobserved. There are far more estimates of serial interval              asymptomatic). In an Italian village (Vo’Eugano), between
because it is far easier to measure (see Table 1), which are             50% to 75% reported no symptoms25,26.
then often used as a proxy of the former. However, ignoring
the difference between the serial interval and generation                4.7 Dynamic relationships
time can lead to biased estimates of R17.                                It is important to remember that both the generation time
                                                                         and the serial interval are dynamically changing through the
After the chance events at the beginning of the epidemic                 course of an epidemic. For example, as interventions are
(when case numbers are small and reporting unreliable) are               put in place there are different transmission patterns, and
over, the cases of infection (or a measure of this statistic)            therefore different time between infections, often biasing
grow exponentially until herd immunity or control measures               towards shorter generation times early in the epidemic,
move R to less than unity in value. At this early stage the              and longer ones as the epidemic is declining. This will then
instantaneous r of the exponentially growing epidemic                    change the relationship between R and r, and it is important
curve, is approximately given by r = (R0-1)/Ƭ                            to consider what data on these intervals is informing these
                                                                         estimates27,28. In addition, for a highly variable incubation
The equation gives a link between the value of R0 and the
                                                                         period there may be negative serial intervals, which may
speed with which infection spread from one person to the next
                                                                         be misinterpreted as the wrong direction of transmission.
in chains of transmission18,19,20. Both R0 and Ƭ determine r, but
                                                                         Considering this possibility is important in order to trace
R0 dominates the area under the unmitigated epidemic curve
                                                                         the complete transmission chain. If the wrong direction of
and hence the total number of cases, and Ƭ greatly influences
                                                                         transmission is assumed, contact tracing efforts may stop
the time scale of the epidemic’s growth and decay. Note that
                                                                         prematurely and miss new infections that then may lead to
as a statistic, the control of transmission by mitigation measures
                                                                         further uncontrolled transmission events.
requires the value of r < 0.

REPRODUCTION NUMBER (R) AND GROWTH RATE (r) OF THE COVID-19 EPIDEMIC IN THE UK • 24 AUGUST 2020                                      10
4.8 Epidemic growth rate, r 4.9 The doubling time of the epidemic, dt The parameter r is a measure of the rate at which new r is sometimes explained in a more accessible way through cases are arising. It can be a positive number (the number use of the closely related doubling time of the epidemic (the of new infections is increasing) or a negative number (the number of days or time units which leads to a doubling in number of new infections is decreasing). As highlighted cases). The doubling time dt in the early stages is therefore: above, it is driven by a combination of R – the higher the dt = ln(2)/r number of cases caused by each infectious individual, the faster the epidemic will grow – and the timescale over which To give a simple example, the doubling times of cases in infections occur. A useful comparison for understanding the UK in the rapid growth phase of the epidemic in March the effects of R and the generation time of new infections 2020 before 'lock down', was of the order of 3 to 4 days30. is provided by HIV, which has an R0 of around 2 in some Taking a value of 3.5, this gives an r estimate of 0.2 per day. populations, and influenza, which has an R0 around 1.329, the It is important to note that there was some debate on this most important being the reproduction number R, but the value early in the epidemic, with some groups reporting timescale from one infection to the next is days for influenza longer doubling times due to uncertainty in the natural but months or years for HIV. history of infection. FIGURE 3 R values depending on the generation time Ƭg and the epidemic growth rate r with indications where individual viral diseases fall within this parameter space. The longer the generation time and the higher the epidemic growth rate, the higher the value of R. The goal of any intervention is to move the epidemic system as far to the bottom left of the parameter space as possible. Data from Wallinga & Teunis 2004 (SARS)31, Cowling et al 2011 (influenza)32, Cauchemez et al 2014 (MERS)33, Li et al 202034 (Sars-CoV-2), Ferretti et al 202035 (Sars-CoV-2). REPRODUCTION NUMBER (R) AND GROWTH RATE (r) OF THE COVID-19 EPIDEMIC IN THE UK • 24 AUGUST 2020 11
The doubling time is an intuitive number – the time taken for            4.10 The probability distribution of R in a defined population
cases to double – and so it facilitates understanding during             All of the quantities described in the preceding sections are
the early stages of this epidemic, but it has limited usefulness         distributed variables with, in some cases, great variability
during the current phase where the number of new infections is           around any average value. Of greatest importance to the
stable or declining slowly. As the value of r potentially switches       central topic of this paper is the ability to place some sort
from positive to negative (and possibly back again during a              of uncertainty interval around estimates of Rt. This and the
resurgence), it passes through zero, at which point the doubling         following sections describe different sources of variability
time briefly tends to infinity. For a stable decline in infections,      that all contribute to the question of how best to accurately
r informs us about the halving time, the time required for the           express this uncertainty. In this section we focus on R itself
number of cases to halve and hence how rapidly or slowly the             and data on other infections plus what is available for
remaining cases will decline to eradication.                             COVID-19. One of the best descriptions of the overall pattern
                                                                         of variability in R within small defined populations is by
For parameter estimation, the problem with determining R                 Lloyd-Smith et al (2005)36 drawing on data from a variety of
is that two epidemiological quantities determine its value,              infectious diseases including SARS. In all the cases examined
r and the generation time, and to get estimates of both,                 by the authors, contact tracing played a key role in describing
either some other epidemiological information is required,               the variation in R within a defined group of individuals.
or model fitting procedures must be employed. Figure
3 illustrates the relationship between r, the generation                 In general, for virtually all infectious diseases where good
time and R and where different respiratory pathogens fall                contact tracing data are available, most transmission is
within this parameter space. It is important to note that the            generated by a small fraction of the infected group of
parameter r itself can only be directly measured providing               people. The term ‘super spreading events’ is often used.
case reporting, hospital admissions, recorded deaths due                 Some have coined the phrase the ‘20/80 rule’ to define that
to COVID-19 or serological data are good (the topic of                   in many cases 80% of the transmission results from 20% of
data quality will be examined in a later section). There is              the infected in any one generation of infection spread37.
a close relationship between r for infections and cases
given information on the incubation period and the fraction              More precisely, the distribution of the quantity R where
who go on to have symptoms, but when the main source                     contact tracing has been available is best described by the
of data is deaths other information is required such as the              negative binomial probability model where the variance
probability distribution of times from infection to death                is typically much greater than the mean. It can take many
and the fraction who die from infection. Interestingly, the              shapes from a J shaped pattern with most zeros, to a humped
Warwick model employed in the SPI-M range of models, has                 unimodal distribution with a big mean and a longer right-
a higher uncertainty bound around r when their model is                  hand tail when compared with the left-hand tail. The discrete
fitted to deaths compared with hospital admissions. When                 probability distribution has two parameters, the mean and
fitting a transmission model to case data, both r and R are              a parameter k which measures inversely the degree of
estimated concurrently because they are linked through the               aggregation of the transmission events within the population.
assumptions in the model and are therefore influenced by                 As k gets large (>5), the distribution converges on the Poisson
the inputs to and structure of the model (see later sections).           distribution. In some of the COVID-19 modelling a parameter
                                                                         eta is used so that its value is positively related to the degree
                                                                         of aggregation where eta=Rm/k (MRC Cambridge model)
                                                                         where Rm is an average value.

REPRODUCTION NUMBER (R) AND GROWTH RATE (r) OF THE COVID-19 EPIDEMIC IN THE UK • 24 AUGUST 2020                                         12
The variance of the distribution, V is given by: V= Rm+Rm2/k The plot below in Figure 4 shows how the inverse
from which it can be seen that the variance is always bigger aggregation measurement parameter k influences how P
than the mean. varies as a function of Rm for low (large k) and high (small
k) aggregation which reflects the importance of super
For all studies with good data, k tends to be small (FIGURE 5 FIGURE 6 SARS in Singapore in 2003 (Leo et al 2003)39. The white Predicted fraction of secondary cases generated by circles are the fit of the negative binomial probability different fractions of the primary cases from contact tracing distribution. Note the superspreading events in the right- studies for a variety of infections including SARS based on hand tail of the distribution. The negative binomial k value is negative binomial fits to the observed data. Taken from around 0.01 describing extreme heterogeneity in the R value Lloyd-Smith et al 200541. across a small sample of people, with a mean close to 3. Taken from Lloyd-Smith et al 200540. Other graphs from the Lloyd-Smith paper are also FIGURE 7 illuminating. Figure 6 shows the expected (negative binomial fit – a reasonable mirror of observed pattern but tending to The super spreading events (SSEs) as defined in the original fail to capture extreme super spreaders) proportion of cases publications are marked by the diamonds. generated by a measured fraction of the infectious cases for Taken from Lloyd-Smith et al 200542. a range of infectious agents. Amongst these, SARS seems to be an extreme case which may be closest to COVID-19. The aggregation goes from small to moderate as you move from SARS to plague reflecting high aggregation at the low values of k. Of equal interest are the fraction of super spreaders. To identify such a group, a case generation number must be defined, but this is obvious from contact tracing data since these individuals lie in the extreme righthand side of the negative binomial distribution. This is illustrated in Figure 7. REPRODUCTION NUMBER (R) AND GROWTH RATE (r) OF THE COVID-19 EPIDEMIC IN THE UK • 24 AUGUST 2020 14
The data for COVID-19 at present is very limited although                The authors of this study also looked at how mitigation
a wide variety of papers and reports use the term “super                 measures introduced in Tianjin starting on 28 January
spreading events” and many such explosive events (called                 influenced R and k. The mean R decreased from 0.74 to 0.53
SSEs) have occurred in mass gatherings in enclosed                       and k increased (less aggregation) from 0.14 to 0.77. This is a
settings43. One recent report focuses on the distribution of             small study, but it does clearly illustrate the variance around
R in a study of 135 cases in Tianjin, China during January               any estimate of R, even in a defined population in one city
and February 2020. Contact tracing enabled chains of                     over a short interval of time.
transmission to be deduced44. They included what was
described as one super spreading event of 6 cases. The                   Leclerc et al (2020)46 are compiling a live database of
negative binomial model was employed to describe the                     clusters of cases, showing high variability and associations
distribution of cases and to deduce confidence bounds                    with particular venues, such as shared accommodation
around the estimates of the mean R. This approach                        (including prisons, and elderly care), but the authors caution
produces understandably wide confidence bounds (R                        that this may be a very biased view of the transmission
values with 95% confidence regime of roughly 0.14 to 1.06),              dynamics of the disease.
as would be expected from a distribution with a variance
                                                                         Effective contact tracing should offer an opportunity to
bigger that the mean value.
                                                                         capture these distributions in close to real time, and for
This study is illustrated in Figure 8 which records the R                specific settings in the UK.
bounds and the range of k estimates (varies inversely with
                                                                         4.11 Inferring R from deaths or diagnosed cases
the degree of aggregation of case generation in a few
                                                                         One of the challenges of estimating R for COVID-19 has
transmitters). It is important to note that this study straddled
                                                                         been the incomplete and lagged data on deaths caused
a period in which mitigation measures were introduced such
                                                                         by the infection (the average time from infection to death
that the mean R was less than unity in value.
                                                                         is estimated as 18.8 days)47. In the early stages of the
                                                                         epidemic, R could not be estimated accurately from either
 FIGURE 8                                                                cases or deaths since under reporting was a function of time
                                                                         – getting better as those responsible for diagnosing and
The circle cross-hairs represent the estimated 95%
                                                                         reporting became more familiar with the infection and the
confidence intervals for R and k from a contact tracing study
                                                                         morbidity and mortality it caused.
of COVID-19 transmission in China. Note the wide bounds
on R with a mean of 0.67. The average k value was 0.25                   It is important to note that there are real challenges inferring
showing much aggregation in case transmission amongst a                  the underlying dynamics from the data streams that were
few primary cases. Figure taken from Zhang et al, 202045.                available by examining reports of either cases or deaths
                                                                         over time, rather than fitting a model to the shape of the
                                                                         epidemic, because it is necessary to back calculate when
                                                                         these cases were likely to have been infected/symptomatic
                                                                         and then try and say who infected who.

REPRODUCTION NUMBER (R) AND GROWTH RATE (r) OF THE COVID-19 EPIDEMIC IN THE UK • 24 AUGUST 2020                                         15
5. Sources of variability in model predictions and the The answer to the second question is yes and no. It is
estimation of R values no, if the structural components of R are ignored and the
Section 4.10 discussed the variability in the value of R for epidemiological parameter is simply estimated from the
a sample of people and defined this distribution as well rate of change in case numbers or another epidemiological
described by the negative binomial model. Section 9 and variable such as those seropositive at a series of time
Appendix 2 outline the diversity of models employed by points, perhaps stratified by confounding variables such as
the groups making predictions for SPI-M. There are clearly spatial location, age and gender. If case numbers are used,
many sources of variability influencing the estimation of due note must be taken of the average interval between
transmission between people, in the data itself, in the infection and diagnosis, and if at all possible, its distribution.
structure of the models, and over time and spatial location. This is done in certain of the modelling efforts (see Table A1
All will influence the confidence and uncertainty in estimated in Appendix 2).
R values. The following sections look at the key issues.
It is yes if separate estimates of the components that
5.1 Structural variability arising from different model make up R, such as average infectious periods and their
assumptions distribution, are used in estimating the overall value of R.
In terms of model predictions, do structural differences This again points to the need to do robust model output
matter and do they also influence how R is estimated? comparisons.
The reply to the former is yes – quantitative detail and Perhaps one of the most important structural issues
even qualitative patterns will depend on model structure. concerns acquired immunity. In the longer term, which may
As illustrated in the Table in Appendix 2 much structural encompass next year (2021), a key question is clearly the
heterogeneity exists in each of the models making duration of protective immunity. All models to date make
predictions for SPI-M (Scientific Pandemic Influenza Group the assumption that, if an individual recovers they are
on Modelling advising the UK government). As yet, it immune for the duration of the epidemic. However, infection
is not clear if model outputs have been compared in a spread may last, with peaks and troughs, for some time until
systematic manner given a defined prediction problem and effective vaccines are in wide scale use. Epidemiological
a defined set of parameters. Such sensitivity analyses are data on other coronaviruses does suggest reinfection within
time consuming but necessary. Given that the immediate one year is possible, but it is uncertain if those infected
emergency of trying to assess what mitigation strategies a second or third time are infectious or show symptoms
could be put in place and how might each work to reduce R, of infection48,49. For short term predictions (the rest of this
now is the time to try and conduct such sensitivity analyses year) this issue is not important, because the proportion
across the models with defined data and parameter sets and of individuals with immunity will remain small. In the longer
make the results accessible to all. The distinction between term it is very important, as is the duration of protection
qualitative and quantitative predictions is important. If all created by vaccines that hopefully will become available.
give the same qualitative conclusion that mitigation strategy The duration of immunity will also influence the proportion
A works best – then the advice to policy makers is clear of the population that will need to be vaccinated to ensure
even when large quantitative differences arise between that the level of herd immunity is always above the value
each model outputs. However, if qualitative differences arise required to halt the epidemic. A further important structural
in important areas that affect policy such as the requirement issue concerns whether or not asymptomatic infection is
for hospital beds over time or the number of predicted associated with infectiousness to others.
deaths, then it is necessary to identify which assumption, or
set of assumptions, create the differences.
Ideally, a comparative study of the behaviour of the models
should be conducted in the shorter term, before a possible
‘second wave’ of infection arises in the autumn or earlier, to
create more confidence in model predictions.
REPRODUCTION NUMBER (R) AND GROWTH RATE (r) OF THE COVID-19 EPIDEMIC IN THE UK • 24 AUGUST 2020 165.2 Parameter assignments informing COVID-19 models • T
o improve our understanding of the importance of
Many parameters influence the predictions generated by asymptomatic cases in driving transmission, further studies
models, including the obvious components that make up are required to:
R and various social, behavioural and demographic factors
– p
rovide more robust estimates of the proportion of
which all can change over time and space (eg different
asymptomatic COVID-19 infections, including in sub-
regions of the country and different types of locations such
populations such as children;
as city or small village). In many cases parameter uncertainty
and parameter distributional properties have been addressed – to quantify the relative infectiousness of asymptomatic
by the different modelling groups but perhaps not always and symptomatic and pre-symptomatic individuals.
in a clear manner and not in a systematic way across the
• F
urther estimates of other COVID-19 natural history
modelling groups. Again, given that the urgency issue that
parameters described in this document (incubation
pertained in the early stages of the epidemic may have
time, generation time/serial interval), stratified by age,
slightly abated, it should be a priority to examine this aspect
particularly for children and young people.
given that data are constantly emerging that may necessitate
changing parameter assignments of model structures. • O
ngoing data collection and reporting for those inputs that
are particularly context specific eg, duration from symptom
A good example is the fraction of asymptomatic individuals. onset to hospitalisation, which varies between and within
Initially, many assumed this was moderate to low50. Although countries and over the course of the epidemic.
estimates in different studies vary widely, the surprising
feature is the high overall values emerging especially in • M
odel input estimates vary in quality, methodological
certain demographic groups such as the young51,52,53. A approach in derivation, peer-review status of where
crucial question is how infectious are asymptomatic people? data are reported and relevance to the epidemiological
Clinical studies of virus dynamics in patients tentatively landscape of the UK. We recommend repeated review
suggest no great difference in viral titres to those recorded going beyond the analysis presented here, with rigorous
in people with symptoms54,55. However, data are limited at evaluation of the quality and relevance of each included
present. How this influences prediction is not clear from the study, to develop consensus around the best estimates
work that has been published in the peer reviewed literature to use for inputs. As evidence rapidly accumulates and
(or as a prepublication print) or provided in reports. evolves, this must be an ongoing process.
• Improved clarity is recommended for authors publishing
Sensitivity analyses, parameter by parameter, starting with
model input estimates, both as preprints and peer-
the most uncertain such as the generation time and its
reviewed publications: clear identification of version
distribution, should be conducted and released as soon
numbers, dates of submission and publication, listing
as possible. Some idea of the degree of uncertainty in key
previous versions with explanation of any changes in
parameters is provided in Table 1.
results between version.
Recommendations relating to use of the most appropriate • E
ncourage authors reporting model input estimates
estimates of epidemiological parameters to inform to make individual-level data publicly available so that
mathematical models of COVID-19: modelling groups may fit to the data according to their
• Further
studies to estimate generation time empirically own model needs and assumptions and/or to allow for
rather than derived from estimates of the serial interval. more nuanced statistical analysis (eg accounting for
This is always a difficult parameter to estimate and even truncated observations and exponential growth in the
more so with an infection that can asymptomatic in a high number of infected cases).
fraction of people. Contact tracing is the most valuable • Encourage
PHE to make all data available to them more
source of data, but such data may be biased to the interval widely available to modelling groups.
in symptomatic people.
REPRODUCTION NUMBER (R) AND GROWTH RATE (r) OF THE COVID-19 EPIDEMIC IN THE UK • 24 AUGUST 2020 17You can also read