Quarterly Global Outlook Q4 2019 - Slower growth, lower rates and a stubbornly strong US Dollar - UOB
←
→
Page content transcription
If your browser does not render page correctly, please read the page content below

Quarterly Global Outlook Q4 2019
Slower growth, lower rates and
a stubbornly strong US Dollar
CONTENT
                      04
            EXECUTIVE SUMMARY                                        CHINA � 38
        Slower Growth, Lower Rates And
         A Stubbornly Strong US Dollar                           HONG KONG � 39

                     10                                               INDIA � 40
FX, INTEREST RATE & COMMODITIES FORECASTS
                                                                  INDONESIA � 41

                         11                                          JAPAN � 42
                 VIETNAM FOCUS
      Asia’s Bright Spot Amid Trade Tensions                       MALAYSIA � 43

                                                                   MYANMAR � 44
                       14
              SINGAPORE FOCUS                                    PHILIPPINES � 45
       A Global Slowdown, An Easing MAS?
                                                                  SINGAPORE � 46

                        17                                      SOUTH KOREA � 47
             INDONESIA FOCUS
           East Kalimantan To Host                                  TAIWAN � 48
      New Capital City Of Indonesia By 2024
                                                                   THAILAND � 49

                         19                                         VIETNAM � 50
                  ASEAN FOCUS
                 Real Estate Outlook
                                                                   AUSTRALIA � 51
                       24
                                                                  EUROZONE � 52
                 CHINA FOCUS
 Understanding PBoC’s Revamped Loan Prime Rate
                                                                NEW ZEALAND � 53

                       26                                     UNITED KINGDOM � 54
                  FX STRATEGY
            Will The USD Stay Strong?                     UNITED STATES OF AMERICA � 55

                      30                                       FX TECHNICALS � 56
               RATES STRATEGY
  Singapore Rates Behaviour Around MAS Events             COMMODITIES TECHNICALS � 61

                          34                                Information as of 13 September 2019
           COMMODITIES STRATEGY
   Never Underestimate The Supply And Demand
          Driven Volatility In Commodities                  GlobalEcoMktResearch@UOBgroup.com
                                                                   www.uob.com.sg/research
                                                                      Bloomberg: UOBR

         Scan the QR Code for a list of all our reports
EXECUTIVE SUMMARY
                       Slower Growth, Lower Rates And A Stubbornly Strong US Dollar

                  Fuelled By Widespread Asian And EM FX Weakness, FED's Broad Dollar Index Has Now Made A New High Above 130

                Source: Bloomberg, UOB Global Economics & Markets Research

                 140

                 130

                 120

                 110

                 100

                  90

                  80

                  70

                  60
                   Sep 89    Nov 91    Jan 94    Feb 96    Apr 98    Jun 00   Jul 02   Sep 04   Nov 06   Dec 08   Feb 11   Apr 13   May 15    Jul 17   Sep 19
                                                          FED's Broad USD Index                                      DXY Index

     As 2019 progressed, the prognosis                         China’s growth outlook could slump further              Philippines, Indonesia and Thailand. All
     of global macroeconomic health has                        towards our Worst Case Scenario. Indeed,                these benchmark rate easing will drive the
     deteriorated in line with the escalation of               with the latest tariff escalation after August,         respective money market rates lower in
     US-China trade tensions. By now, most                     we now see China’s GDP falling below 6%                 the months ahead.
     major economies in the world have either                  to 5.9% in 2020. Similarly, the CNY has now
     downgraded their growth forecasts for next                fallen past 7.00 and is likely to target 7.30           Global bond yields are of course way
     year, or sounded their recession alarm.                   by early 2020.                                          ahead of the curve and have literally
     Most prominently, Germany and Japan                                                                               collapsed over the past quarter leading to
     are at risk of slumping into a technical                  What is comforting is that amidst this                  instances of yield curve inversion across
     recession. The US has fared much better,                  challenging macroeconomic and trade                     key economies globally. If the upcoming
     but growth is still seen slowing from 2.5%                backdrop, the PBoC has intensified its                  synchronized easing lead by the FED is
     this year to 1.3% in 2020.                                push for interest rate reform by reinforcing            effective, it may well help stabilize yield
                                                               the Loan Prime Rate (LPR). Going                        curves and rejuvenate longer dated bond
     Overall, from last year’s 3.7% global                     forward, the transmission of monetary                   yields should the front loading of rate
     growth rate, the IMF has downgraded                       policy is expected to be more efficient and             cuts restore global growth and inflation
     this year’s global growth rate repeatedly                 market driven, now that new loan rates                  expectations.
     to a low of 3.2%. Most recently, in line                  and mortgage rates are referenced to the
     with rising concerns over global trade                    LPR, which is in turn linked to the Medium-             What remains at odds to this dovish
     slowdown, on 9th September, the IMF                       term Lending Facilities (MLF). As of this               narrative of slower growth and lower rates
     launched a new World Trade Uncertainty                    latest quarterly report, we start forecasting           is that of a stubbornly strong US Dollar.
     Index. This index tracks the trade outlook                the 1Y LPR and expect it to drop to 3.9%                Since the US-China trade conflict started,
     for 143 economies from 1996. Needless                     by end of this year and 3.65% by 1Q20.                  the USD has climbed from strength to
     to say, the IMF warned that “Globally, the                                                                        strength. In fact, the FED’s trade weighted
     trade policy uncertainty index is rising                  Similarly, we can expect the FED to lead                Broad Dollar Index has now shot above 130
     sharply, having been stable at low levels                 global central banks into synchronized                  to a new high, above the previous peak last
     for about 20 years".                                      rounds of monetary policy easing. With                  seen in 2002. And from the narrower US
                                                               the FED now expected to front load its 3                Dollar Index (DXY) perspective, the recent
     The epicenter of the global growth slowdown               cuts for the remaining 3 FOMC meetings                  climb in DXY towards 100 is at further
     is of course China. In our previous quarterly,            of the year, we can also expect varying                 odds against expectations of upcoming
     we warned that should US-China trade                      intensities of rate cuts forthcoming next               FED rate cuts as well as the deteriorating
     tensions escalate further, there is a risk that           year across Asia, particularly in Malaysia,             10 year weighted yield spread.

      Quarterly Global Outlook 4Q2019
04    UOB Global Economics & Markets Research                                                                                                EXECUTIVE SUMMARY
While we are certainly not fans of                SORA, dated 03 Sep). We note that many          towards USD 1,650 / oz. The strength in
President Trump’s trade policies, he may          specific details are still pending from the     gold has also rubbed on silver which is
not be wrong in his regular remonstrations        authorities at the moment and will update       trying to play catch up.
against US Dollar strength. Treasury              as and when more announcements are
Secretary Steven Mnuchin has went                 available.                                      In the energy space, despite the
further to entertain albeit briefly the                                                           depressing       global     macroeconomic
thought of intervention against US Dollar         _________________________________               landscape, on-going supply discipline
strength. While the practical mechanics                                                           from Saudi Arabia and OPEC+ has helped
of an official US Dollar intervention is          FX Strategy                                     keep Brent Crude Oil afloat above USD 60
unlikely to be endorsed by the US Federal         Will The USD Stay Strong?                       / bbl. In the industrial metals space, LME
Reserve, there is nothing to stop President       In the currency space, we note that the         Copper was deceptively stable above
Trump from making this one of his top             US Dollar remains stubbornly strong and         USD 5,800 / MT. On the other hand, LME
agenda next year as the 2020 Presidential         this appears to be at increasing odds to        Nickel rocketed by around 50%, jumping
election cycle heats up. At this stage, we        deteriorating yield spreads amidst further      from USD 12,000 / MT to USD 18,000 /
are uncertain when precisely the US Dollar        easing from the US Federal Reserve.             MT over the past quarter. This was after it
will finally succumb to slower growth and         Indeed, in the FX Majors, we now expect         was dealt a supply shock after Indonesia
lower rates. Indeed, our FX forecasts             the gradual tapering off of USD strength        brought forward its nickel ore ban by 2
appear conflicted and reflect an uncertain        against the EUR and AUD. Back in 2015, it       years to Jan 2020.
divide of gradual USD weakness against            is worth noting that the EUR had weakened
the Majors, countered by on-going USD             ahead of the ECB’s QE program. As for           Hereafter is a brief synopsis of key Focus
strength against the CNY and Asian FX.            Australia, the aggressive twin rate cuts by     pieces as well as key FX and Rates views.
Nonetheless, risk has increased that the          the RBA appear to have fired up Australia’s
currency space will be increasingly volatile      exports and current accounts. After near
in the months ahead.                              term uncertainties pass, we can expect          Vietnam Focus
                                                  EUR/USD to head back up from 1.10 to            Asia’s Bright Spot
                                                  1.14 and AUD/USD to climb from 0.68 to          Amid Trade Tensions
Rates Strategy                                    0.71. Overall, we can expect the US Dollar      As the trade dispute between the US and
Interest Rates Are                                Index (DXY) to peak under 100 and turn          China shows little signs of abating, Vietnam
Finally Heading Back Down                         back down to 95.8 by 3Q20.                      becomes one of the key Asian destinations
Amidst the broad synchronized global                                                              for foreign manufacturers relocating their
monetary policy easing led by the US              As for Asian currencies, they remain            production facilities. Geographic proximity
Federal Reserve, it is now clear that interest    tethered to the CNY. In other words, Asian      to China, a young labour pool, competitive
rates in key economies are heading back           currencies are likely to stay weak alongside    wages, multilateral trade privileges and
down. In line with our expectations for the       the CNY. With this latest escalation of         FDI incentive policies have helped position
US Federal Reserve to front load the three        US-China trade conflict, USD/CNY will           Vietnam as an attractive investment
rate cuts, we now expect Federal Fund             likely establish a new normal above 7.00        destination in Asia, laying out a positive
Rate to drop from 2.25% to 1.50% by end-          and head higher towards 7.30. Similarly,        growth trajectory in the years ahead
2019. Consequently, we expect 3M US               we can expect the rest of USD/Asia to           for the country. Over the mid- to long-
Libor to drop below 2% to 1.45% by the            follow with USD/SGD trading above 1.40.         term, Vietnam is striving for sustainable
end of this year. Similarly, from their current   However, least one gets carried away with       development by tapping Industry 4.0 to
levels of around 1.8%, both 3M SOR and            expectations of excessive USD strength,         help improve growth quality and elevate
3M Sibor are expected to drift back down          we note the risk that USD/Asia will have        standards of living. On this front, the
to 1.45% and 1.55% respectively by end of         difficulty sustaining gains in the second       government has shown its resolve and
this year. With the MAS widely expected to        half of 2020.                                   determination in carrying out policies
ease monetary policy in Oct via a reduction                                                       relating to Industry 4.0, helping to underpin
in the S$NEER policy slope, we can expect         _________________________________               Vietnam’s growth potential in the years
SG rates to decline one month before the                                                          ahead.
event and rise in the month later.                Commodities Strategy
                                                  Never Underestimate Supply                      _________________________________
In the meantime, the pace of money market         And Demand Driven Volatility
rate reforms has intensified globally. The        In the commodities space, unique demand         Singapore Focus
US Federal Reserve has pushed forth               and supply dynamics injected a fair bit of      A Global Slowdown,
prepare global investors for the eventual         volatility into their respective commodities.   An Easing MAS?
transition away from Libor into SOFR in           Gold continues to be the clear winner           The likely persistent negative output gap in
2021 (Rates Strategy: Interim Update on           amidst the surge in safe haven demand.          the second half of this year (and possibly
Money Market Rates Transition, dated              The list of positive drivers for gold is        beyond) could persuade MAS to ease
03 Sep). In Singapore, the MAS has also           growing. These range from synchronized          monetary policy at the October meeting.
recently announced initial broad strokes          monetary policy easing, lower global            We expect MAS to lower the S$NEER
to transit away from SOR to SORA (Rates           bond yields and increased central bank          policy slope by 0.5% point from a currently
Strategy: Transitioning from SOR to               allocation. We expect further gold strength     estimated 1.0% appreciation, while

                                                                                                                 Quarterly Global Outlook 4Q2019
EXECUTIVE SUMMARY                                                                                       UOB Global Economics & Markets Research    05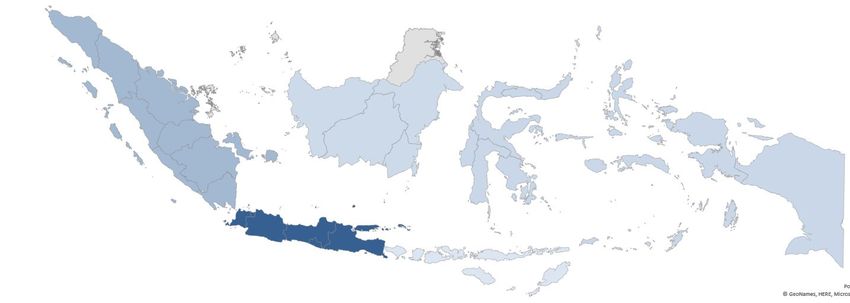
keeping the rest of its policy parameters      China Focus                                    underpinned by the various headwinds
     (i.e. midpoint and width of bands)             Loan Prime Rate:                               against the CNY, we believe USD/CNY
     unchanged. This brings the estimated           What Has Changed?                              will trade in the new normal of above 7.00
     appreciation slope to 0.5%, reversing          In this short infographic, we describe the     going forth. Our new point forecasts for
     one of the two steepening moves made           changes to China’s Loan Prime Rate             USD/CNY are 7.20 at 4Q19, 7.25 at 1Q20
     in 2018. There is a growing risk that MAS      (LPR) which was first introduced in Oct        and 7.30 for both 2Q and 3Q20.
     may flatten the appreciation slope and         2013, and was recently enhanced in Aug
     ease the policy all the way to neutral.        2019. We also provide a short graphic          USD/SGD: As USD/CNY rises towards
                                                    explanation on how the new LPR will            7.30 in the next few quarters, USD/SGD
     _________________________________              affect banks’ loan pricing.                    is biased on the upside. At the prevailing
                                                                                                   spot of 1.38, we expect USD/SGD to rise
     Indonesia Focus                                _________________________________              towards 1.40 in 4Q19, 1.41 in 1Q20, and
     East Kalimantan To Host New                                                                   1.42 in both 2Q and 3Q20.
     Capital City of Indonesia by 2024              GLOBAL FX
     The idea of moving the capital emerged         USD/JPY: With intensifying speculation of      USD/HKD: Overall, in the near term,
     several times since the country gained         a global recession, portfolio reallocation     geopolitical pressures are likely to tether
     independence in 1945. However, it has          has been geared towards preparing for          the HKD near the weaker end of its peg
     never been discussed in a planned and          one. We expect the JPY to stay strong and      at 7.85/USD in 4Q19 and 1Q20 before a
     matured manner, until recently the idea        update our view towards further strength       subsequent normalisation towards 7.80/
     was brought back. Indonesia’s leader           towards 103/USD by mid-2020.                   USD starting 2Q20.
     expects the relocation of the capital will
     help ease inequality and relieve some of       EUR/USD: Near term, the spectre of QE          USD/TWD: Although domestic growth
     the burden from Jakarta, and the island        is likely to pin EUR/USD at low levels near    prospect is looking more optimistic, the
     of Java. Java, especially Jakarta, is          1.10. Further out, with a more aggressive      TWD is still weighed down by external
     already overcrowded, which is home to          easing profile by the Fed, we expect EUR/      developments such as the protracted US-
     approx. 60% of the country’s population        USD to gradually recover to 1.12 in 2Q20       China trade conflict. Overall, we expect
     and represents more than half of its           and 1.14 in 3Q20.                              USD/TWD at 31.60 at 4Q19, 31.90 at
     economic activity. If approved by the                                                         1Q20, and 32.00 for both 2Q and 3Q20.
     Parliament, the new capital city will sit      GBP/USD: The recent rebound of GBP/
     1,400 km northeast from Jakarta on 1800        USD from 1.20 to 1.23 in early-September       USD/KRW: Unless there is a breakthrough
     km2 (vs. Jakarta 661.5 km2) of land; in        is likely to be short-lived as long as the     in either of the trade conflicts in which
     the regencies of North Penajam Paser           underlying Brexit issue is not resolved.       South Korea is implicated, the KRW is
     and part of Kutai Kertanegara in East          Overall, we maintain the view that the         likely to track the CNY closely for further
     Kalimantan. The entire project will cost a     GBP/USD would stay depressed at 1.20           losses. We maintain that the KRW should
     total of IDR486tn. The first phase of the      in the immediate two quarters until the fog    continue to underperform within Asian
     new capital development will start at the      of Brexit is lifted.                           FX, ending the year at 1,210/USD. For
     end of 2020, while the actual relocation                                                      next year, our updated USD/KRW point
     will start in 2024.                            AUD/USD: With the RBA on a wait-and-           forecasts are 1,220 in 1Q20 and 1,230 for
                                                    see approach, pressures on the AUD             both 2Q and 3Q20.
     _________________________________              due to aggressive rate cut expectations
                                                    may start to abate. Overall, we expect the     USD/MYR: We keep the view of a
     ASEAN Focus                                    AUD/USD to stabilize at 0.69 for the next      modestly higher USD/MYR and update
     Real Estate Outlook                            two quarters before a modest recovery          the point forecasts to 4.19 in 4Q19, 4.23
     As concerns grow over weaknesses in            towards 0.71 by 3Q20.                          in 1Q20, and 4.26 for both 2Q20 and
     global property markets amid elevated                                                         3Q20. A key risk event to watch out for
     prices and economic slowdown, we               NZD/USD: The spectre of further rate cuts      is FTSE Russell’s decision whether to
     assess the real estate outlook in ASEAN-4      (30bps priced in over the next six months)     exclude Malaysia bonds from its World
     (SG, MY, ID, TH), taking a closer look at      and unconventional monetary policies           Government Bond Index (WGBI) on 26
     key risks & emerging opportunities.            should ground the kiwi at around 0.64 for      Sep.
                                                    the next two quarters at least. Further out,
     Dark clouds have gathered over Kuala           we forecast a gradual recovery of NZD/         USD/IDR: The worsening global economic
     Lumpur (KL) and ASEAN-4 residential            USD towards 0.66 in 3Q20, underpinned          backdrop is unlikely to bode well for the
     markets. KL residential, retail and office     by a pullback of the broad USD in the          IDR. Internally, Indonesia’s twin deficit in
     segments are dragged by oversupply;            G-10 space.                                    fiscal and current account, together with
     ASEAN-4 residential markets are facing                                                        more rate cuts by the BI next year would
     a slowdown or decline due to a mixture                                                        continue to weigh on the IDR. Overall, we
     of cooling measures and demand-supply          ASIAN FX                                       maintain a higher trajectory for USD/IDR.
     imbalances. On balance, prospects are          USD/CNY: Our weaker outlook of                 Our point estimates are 14,300 for 4Q19,
     favourable for SG office with limited supply   China’s economy also supports our view         14,400 for 1Q20 and 14,500 for both 2Q
     expected to underpin growth.                   of a weaker CNY going forth. Overall,          and 3Q20.

      Quarterly Global Outlook 4Q2019
06    UOB Global Economics & Markets Research                                                                      EXECUTIVE SUMMARY
USD/THB: As the trade conflict drags on       it wasn’t just a return to QE, but QE in          rate cut in May, and wait out for further
and together with the BoT shifting to an      perpetuity. However, the ECB declined             developments on the economic front.
easing mode, we keep to the view that         to discuss whether it would lift the cap on       Nonetheless, we see August’s bigger-than-
THB would eventually weaken alongside         the proportion of a country’s bonds it is         expected move as pre-emptive in nature
its Asian peers against the USD, albeit       allowed to hold (a limit it is already close to   and the RBNZ is likely to wait it out before
at a more measured pace. Overall, our         hitting). Furthermore, the question remains       considering further cuts in interest rates
updated point forecasts for USD/THB are       whether what has just been unveiled will          again. For now, we are keeping our year-
30.9 in 4Q19, 31.2 in 1Q20, and 31.5 in       be sufficient to get Eurozone growth and          end OCR forecast unchanged at 1.00%.
both 2Q and 3Q20.                             inflation back on track as fiscal policy          But just like the RBA, developments in
                                              remains a huge issue. The September               the global backdrop will have important
USD/PHP: Weighed by significant BSP           meeting will not be Draghi’s last, but we         implications on the timing and extent of
rate cuts of up to 75bps for the next         do not expect any major announcements             further easing.
4 quarters coupled with Philippines’          at the October meeting. Whilst Draghi has
persistent twin deficits, we reiterate our    certainly left plenty of room for maneuver        BOJ: We believe as long as the Japanese
expectation for further weakness of the       to his successor Christine Lagarde, her           government stays on course to implement
PHP against the USD. We expect USD/           first policy meeting in December is also          the next sales tax hike in Oct (which can be
PHP at 52.50 in 4Q19, 53.0 by 1Q20            unlikely to be groundbreaking.                    taken as a sign it is keeping its pledge to
followed by 53.5 by 2Q20 and 3Q20.                                                              fiscal discipline and restore fiscal balance
                                              BOE: As reflected in the statement,               at some point), that may be sufficient
USD/VND: Overall, we reiterate a              minutes, and press conference by BoE              to convince the BOJ to use this as an
modestly higher USD/VND trajectory, with      Governor Mark Carney at the August                opportunity to reassert its easy monetary
point forecasts at 23,400 in 4Q19, 23,600     monetary policy meeting, the BoE “is less         policy position without changing the policy
in 1Q20, and 23,800 in 2Q and 3Q20.           confident than usual about the outlook for        targets, i.e. “allow” the Finance Ministry to
                                              the UK economy because of Brexit”, but it         issue more debt (JGBs) which the BOJ in
USD/MMK: We still expect the MMK to           offered little new insights into the impact of    turn will buy so as to push its JGB buying
remain under pressure from a persistent       a no-deal Brexit scenario ahead of the 31         closer to the JPY80trn annual pace. This
current account deficit which is expected     October deadline. Yet, the main takeaway          may happen as early as 18/19 Sep MPM.
to widen from 5.3% of GDP in 2018 to          continues to be the fact that “monetary
5.7% in 2019 and 5.9% in 2020. As such,       policy response to Brexit, whatever form
USD/MMK is forecast to be at 1,530 in         it takes, will not be automatic and could         ASIAN INTEREST RATES
4Q19, 1,540 in 1Q20, and 1,550 in 2Q          be in either direction”. On balance, this         PBoC: The PBoC announced its third
and 3Q20.                                     suggests that the BoE is unlikely to act          cut to banks' reserve requirement ratio
                                              until the path of Brexit becomes clearer,         (RRR) this year in Sep, encompassing
USD/INR: With the downside growth risks       and would be on a wait-and-see approach           both broad and targeted cuts. Further out,
persisting and RBI staying dovish, USD/       for now.                                          we believe there is room for one more
INR is still biased higher. We update our                                                       RRR cut in 4Q19. The PBoC has also
forecast, expecting USD/INR at 72.5 in        RBA: As expected, the RBA kept its OCR            revamped the Loan Prime Rate (LPR)
4Q19, 73.0 in 1Q20, and 73.5 in 2Q and        on hold at 1.00% in September. We expect          which will replace the 1Y Lending Rate to
3Q20.                                         the RBA to monitor developments for a few         price new loans going forward. The LPR
                                              months. By November, the RBA will have            which is pegged to the 1Y Medium-term
_________________________________             received more data on inflation, as well          Lending Facility (MLF) is expected to fall
                                              as further labour market information. For         with PBoC potentially looking at directly
GLOBAL INTEREST RATES                         now, there are good reasons for the RBA           lowering of borrowing costs through
FOMC: The intensification of the US-China     to remain on a “wait-and-see” approach,           an easing in the MLF rate. We see the
tariff fight in 3Q took us by surprise and    especially since the OCR is already at a          likelihood for 1Y MLF to be cut by 25 bps
the worsening trade policy development        historic low of 1.00%. Our current forecast       and by more should the US-China trade
will likely “push” the Fed to take on more    is for a steady OCR of 1.00% for the rest         tensions escalate further. From 4.25% (as
“insurance” rate cuts in 2019. We now         of this year. Further easing in 2020 cannot       of 20 August), we expect the LPR fixing to
expect the Fed to cut the FFTR by another     be ruled out. We will, as such, keep watch        move lower to 3.90% by end-4Q19 and to
25bps in the 17/18 Sep 2019 FOMC. We          on global trade tensions, soft consumer           3.65% by end-1Q20.
also project two more 25bps rate cuts in      spending, undershooting inflation, and
the 29/30 Oct and the 10/11 Dec FOMC,         mediocre wages, which will be factors that        MAS: The likely persistent negative output
bringing the upper bound of the FFTR          may prompt us to revise our view further          gap in the second half of this year (and
lower to 1.5%, well below the 2% inflation    ahead.                                            possibly beyond) will likely persuade
target.                                                                                         MAS to ease monetary policy at the
                                              RBNZ: The RBNZ delivered a more-                  October meeting. We expect MAS to
ECB: In his penultimate meeting as ECB        aggressive interest rate cut in August,           lower the S$NEER policy slope by 0.5%
President, Mario Draghi unveiled a fresh      slashing its OCR by 50bps to 1.00%. We            point from a currently estimated 1.0%
package of stimulus measures. This was        had thought the RBNZ would prefer more            appreciation, while keeping the rest of
Draghi’s final “whatever it takes”, whereby   time to evaluate the impact of the first          its policy parameters (i.e. midpoint and

                                                                                                               Quarterly Global Outlook 4Q2019
EXECUTIVE SUMMARY                                                                                     UOB Global Economics & Markets Research    07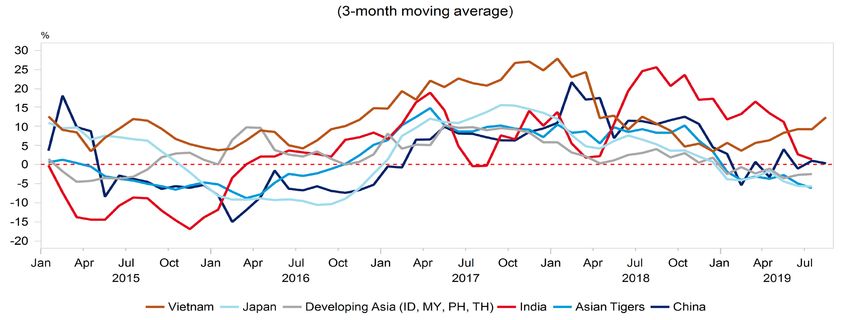
width of bands) unchanged. This brings            BOK: Given the race to lower interest              BOT: For the rest of 2019, we now expect
     the estimated appreciation slope to 0.5%,         rates amongst central banks, the BOK               the BoT to maintain the policy rate at
     reversing one of the two steepening               has tried to manage market’s expectation           1.50% in order to gauge the transmission
     moves made in 2018. Moreover, there is            of its monetary policy easing by flagging          mechanism of monetary policy first before
     a growing risk that MAS may flatten the           out the limitations of further rate cuts. Still,   considering the next move. Additionally,
     appreciation slope and ease the policy all        with the trade uncertainties and downside          the real policy rate is already at a low level
     the way to neutral, a signal that a looser        growth risk as well as the weaker-than-            compared with those of other ASEAN
     monetary policy is needed to cushion both         expected domestic inflation, we continue           countries. However, if incoming economic
     inflation and growth risks into 2020.             to see the possibility of a second rate cut        data remain sluggish over the coming
                                                       by the BOK this year (after the 25 bps cut         months, we would likely see another cut
     RBI: We downgraded our full-year growth           in July) to bring the base rate to 1.25% by        by the BoT to take the policy rate to 1.25%,
     outlook to 6.0%, down from an initial             end-2019, matching the record low during           given that the BoT has already signaled
     outlook of 6.8%, below RBI’s growth               June 2016-October 2017. We think the               that it still has policy space left.
     forecast of 6.9%. We view inflation to            rate cut could be delivered on the 17th
     average 3.4% in H2 2019/20, at the                October meeting which will be the second           BSP: Despite expectations of further Fed
     lower bound of RBI’s H2 outlook range             last BOK meeting for the year.                     rate cuts, we do not expect BSP to follow in
     of 3.4 – 3.7%. Should this come to pass,                                                             lock step but to adjust its overnight reverse
     India’s inflation rate will average 3.2% in       BNM: Although the US Fed is expected to            repurchase rate according to domestic
     FY2019/20, the lowest since FY 1978/79.           embark on further rate cuts, we think BNM          inflation and domestic growth prospects
     RBI has cut rates by a cumulative 110bps          is likely to be more cautious and gradual in       as well as the movement of the local
     since the year started. On the back of            their monetary approach to avoid setting           currency. We maintain our call for another
     softer growth and inflation environment           rates “too low and too fast”. This will be         25bps rate cut in 4Q19 to 4.00%, followed
     seen to-date, we pencil another 25bps             accompanied by necessary fiscal support            by another 50bps cuts in 1H20. This will
     rate cut in 4Q19.                                 as the government is expected to step up           bring the overnight reverse repurchase
                                                       spending, and adopt a more pragmatic and           rate to 3.50% by end-2020.
     BI: In line with our expectations, BI 7-day       expansionary approach in the upcoming
     Reverse Repo Rate was lowered by total            budget to support the economy. As such             SBV: The State Bank of Vietnam (SBV)
     of 50 bps to 5.50% across July and August         we project OPR to stay at 3.00% for the            unexpectedly announced a 25bps cut to
     2019 monetary policy meetings (MPC),              rest of the year, followed by a potential          its policy refinancing rate to 6.0% on 13
     as a pre-emptive measure to safeguard             25bps cut to 2.75% in 1Q20.                        Sep. The cut will take effect on 16 Sep
     economic growth momentum against the                                                                 (Mon). The cut was a surprise, but it will
     impact of global economic moderation.                                                                be viewed as helpful to better anchor
     Going forward, we view that BI will                                                                  growth. Thereafter, we expect SBV to
     maintain an accommodative monetary                                                                   maintain refinancing rate at 6.00% for
     stance and utilize various policy tools such                                                         the rest of 2019. At the latest policy rate,
     as macroprudential intermediation ratio                                                              the monetary policy stance is clearly
     (RIM), reserve requirement, strengthening                                                            conducive to the continuation of economic
     payment system policy and financial                                                                  growth, while preserving financial stability.
     market deepening, as well as expanding
     economic financing through green finance.
     This is in line with the low inflation forecast
     as well as ensuring an attractive yield
     differential. With that, we are forecasting
     the BI rate to remain unchanged at 5.50%
     until the end of 2019.

      Quarterly Global Outlook 4Q2019
08    UOB Global Economics & Markets Research                                                                              EXECUTIVE SUMMARY
Real GDP Growth Trajectory

y/y% change                   2018            2019F               2020F       1Q18         2Q18       3Q18       4Q18         1Q19          2Q19     3Q19F      4Q19F
China                           6.6             6.1                5.9         6.8          6.7        6.5       6.4          6.4           6.2           6.0    6.0
Eurozone                        1.9             1.1                1.1         2.4          2.1        1.7       1.2          1.3           1.2           1.1    1.1
Hong Kong                       3.0             0.5                1.2         4.6          3.6        2.8       1.2          0.6           0.5           0.1    1.0
Indonesia                       5.2             5.1                5.2         5.1          5.3        5.2       5.2          5.1           5.1           5.1    5.1
Japan                           0.8             0.5               -0.8         1.3          1.5        0.1       0.3          1.0           1.0           1.0    -1.0
Malaysia                        4.7             4.6                4.4         5.3          4.5        4.4       4.7          4.5           4.9           4.6    4.5
Philippines                     6.2             5.8                6.2         6.5          6.2        6.0       6.3          5.6           5.5           6.0    6.0
India                           6.8             6.0                7.0         8.0          7.0        6.6       5.8          5.0           5.7           7.6    5.6
Singapore                       3.1             0.6                1.5         4.6          4.2        2.6       1.3          1.1           0.1           0.9    0.1
South Korea                     2.7             2.2                2.1         2.8          2.9        2.1       2.9          1.7           2.0           2.5    2.5
Taiwan                          2.6             2.4                2.4         3.2          3.3        2.4       1.8          1.8           2.4           2.6    2.7
Thailand                        4.1             2.8                3.2         5.0          4.7        3.2       3.6          2.8           2.3           3.1    3.1
US (q/q SAAR)                   2.9             2.5                1.3         2.5          3.5        2.9       1.1          3.1           2.0           2.0    1.8
Note that India’s annual growth refers to its fiscal year print
Source: CEIC, UOB Global Economics & Markets Research

                                                                    Heat Map Of Key Macro Indicators In The Region

Latest Indicators

                                                     Indonesia            Malaysia      Philippines   Thailand    Vietnam       Singapore          China        India
Real GDP Growth (%)                                       5.1               4.9             5.5         2.3            6.7           0.1            6.2          5.0

Manufacturing PMI (Index)                                49.0               47.4           51.9         50.0           51.4          49.9          50.4         51.4

Foreign Direct Investment (Annual, USD bn)               20.2               1.1             9.8         0.6            14.1          82.0           6.9          7.0

Merchandise Trade Balance (USD bn)                       -7.4               3.4            -42.6        1.7            1.7           31.9          34.8         -13.4

Current Account (Annual, % Of GDP)                       -3.1               3.1            -2.6         5.6            3.0           17.3           0.4         -2.1

Fiscal Balance (Annual, % Of GDP)                        -2.9               -3.7           -2.3         -2.4           -1.8          -0.6          -4.2         -3.4

Unemployment Rate (%)                                     5.0               3.3             5.1         1.0            2.0           2.2            3.6          8.5

Inflation (%)                                             3.1               0.6             3.0         1.1            2.3           0.8            2.6          3.1
Color Code

Source: Bloomberg, UOB Global Economics & Markets Research

                                                                                                                                         Quarterly Global Outlook 4Q2019
EXECUTIVE SUMMARY                                                                                                               UOB Global Economics & Markets Research    09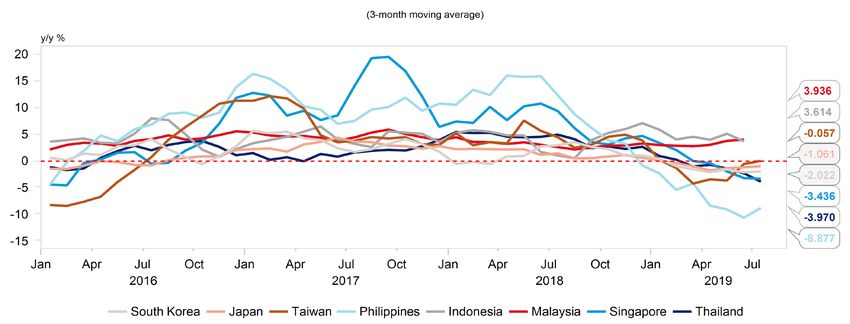
FX, INTEREST RATE & COMMODITIES FORECASTS

     FX              13 Sep 19 4Q19F 1Q20F 2Q20F 3Q20F            RATES                        13 Sep 19   4Q19F   1Q20F   2Q20F   3Q20F

     USD/JPY            108       106      105    103     103     US Fed Funds Rate              2.25      1.50    1.50    1.50    1.50

     EUR/USD            1.11      1.10     1.10   1.12    1.14    USD 3M LIBOR                   2.13      1.45    1.45    1.45    1.45

     GBP/USD            1.23      1.20     1.20   1.21    1.22    US 10Y Treasuries Yield        1.77      1.70    1.70    1.70    1.80

                                                                  JPY Policy Rate                -0.10     -0.10   -0.10   -0.10   -0.10
     AUD/USD            0.69      0.69     0.69   0.70    0.71
                                                                  EUR Refinancing Rate           0.00      0.00    0.00    0.00    0.00
     NZD/USD            0.64      0.64     0.64   0.65    0.66
                                                                  GBP Repo Rate                  0.75      0.75    0.75    0.75    0.75
     DXY                98.4      98.7     98.4   96.8    95.8
                                                                  AUD Official Cash Rate         1.00      1.00    1.00    1.00    1.00
     USD/CNY            7.08      7.20     7.25   7.30    7.30    NZD Official Cash Rate         1.00      1.00    1.00    1.00    1.00

     USD/HKD            7.83      7.85     7.85   7.80    7.80
                                                                  CNY 1Y Loan Prime Rate         4.25      3.90    3.65    3.65    3.65
     USD/TWD           31.04     31.60    31.90   32.00   32.00   HKD Base Rate                  2.50      1.75    1.75    1.75    1.75
     USD/KRW           1,191     1,210    1,220   1,230   1,230   TWD Official Discount Rate     1.38      1.38    1.38    1.38    1.38

     USD/PHP           51.95     52.50    53.00   53.50   53.50   KRW Base Rate                  1.50      1.25    1.25    1.25    1.25

                                                                  PHP O/N Reverse Repo           4.25      4.00    3.75    3.50    3.50
     USD/MYR            4.16      4.19     4.23   4.26    4.26
                                                                  SGD 3M SIBOR                   1.88      1.55    1.45    1.35    1.35
     USD/IDR          13,994     14,300 14,400 14,500 14,500
                                                                  SGD 3M SOR                     1.77      1.45    1.45    1.35    1.35
     USD/THB           30.45     30.90    31.20   31.50   31.50
                                                                  SGD 10Y SGS                    1.72      1.80    1.70    1.70    1.70
     USD/MMK           1,532     1,530    1,540   1,550   1,550
                                                                  MYR O/N Policy Rate            3.00      3.00    2.75    2.75    2.75
     USD/VND          23,208     23,400 23,600 23,800 23,800
                                                                  IDR 7D Reverse Repo            5.50      5.50    5.25    5.00    4.75
     USD/INR           71.14     72.50    73.00   73.50   73.50
                                                                  THB 1D Repo                    1.50      1.50    1.50    1.25    1.25

     USD/SGD            1.38      1.40     1.41   1.42    1.42    VND Refinancing Rate           6.25      6.00    6.00    6.00    6.00

     EUR/SGD            1.52      1.54     1.55   1.59    1.62    INR Repo Rate                  5.40      5.15    5.15    5.15    5.15

     GBP/SGD            1.70      1.68     1.69   1.72    1.73
                                                                  COMMODITIES                  13 Sep 19   4Q19F   1Q20F   2Q20F   3Q20F
     AUD/SGD            0.94      0.97     0.97   0.99    1.01
                                                                  Gold (USD/oz)                  1,501     1,550   1,600   1,650   1,650
     SGD/MYR            3.03      2.99     3.00   3.00    3.00
                                                                  Brent Crude Oil (USD/bbl)       60       60-70   60-70   60-70   60-70
     SGD/CNY            5.15      5.14     5.14   5.14    5.14

     JPY/SGDx100        1.27      1.32     1.34   1.38    1.38    LME Copper (USD/mt)            5,833     5,600   5,400   5,200   5,200

     Quarterly Global Outlook 4Q2019
10   UOB Global Economics & Markets Research
VIETNAM FOCUS
                                             Asia’s Bright Spot Amid Trade Tensions

                Thanks to robust domestic                                                                          Geographic proximity to China,
                demand and increasing FDI,                                                                         a young labour pool, competitive
                Vietnam’s economy is expected                                                                      wages, multilateral trade privileges
                to expand 6.7% in 2019 as                                                                          and foreign direct investment (FDI)
                one of the fastest growing                                                                         incentive policies have helped
                economies in the world.                                                                            position Vietnam as an attractive
                                                                                                                   investment destination in Asia, laying
                                                                                                                   out a positive growth trajectory in the
                We expect the central bank, State Bank                                                             years ahead for the country.
                of Vietnam (SBV), to keep the policy rate
                steady at 6.25% for the rest of this year,
                thus ensuring a conducive environment for
                economic activities.

                                                                                                                   Over the mid to long term, a key
                As the trade dispute between
                                                                                                                   driver underpinning Vietnam’s growth
                the US and China shows little
                                                                                                                   potential will be the Fourth Industrial
                signs of abating, Vietnam
                                                                                                                   Revolution (Industry 4.0). This
                becomes one of the key
                                                                                                                   could potentially increase the size
                Asian destinations for foreign
                                                                                                                   of Vietnam’s economy by between
                manufacturers relocating their
                                                                                                                   US$28.5bn and US$62.1bn,
                production facilities.
                                                                                                                   equivalent to economic growth
                                                                                                                   rate of 7-16% annually, until 2030,
                                                                                                                   according to the Central Institute for
                                                                                                                   Economic Management (CIEM).

                 Vietnam Is Expected To Continue To Grow                                  Asia - Annual Real GDP Growth (Forecasts to 2020)
                    Amid The US-China Trade Tensions                                     ASEAN Is One Of The World’s Fastest Growth Engines
Source: Bloomberg, UOB Global Economics & Markets Research                      Source: Macrobond, UOB Global Economics & Markets Research

 8                                                                         30

 7
                                                                           25
 6
                                                                           20
 5

 4                                                                         15

 3
                                                                           10
 2
                                                                           5
 1

 0                                                                         0
     Q1Q2Q3Q4Q1Q2Q3Q4Q1Q2Q3Q4Q1Q2Q3Q4Q1Q2Q3Q4Q1Q2
         2014         2015         2016         2017         2018   2019
                 GDP Growth (%)                  Export Growth (%, RHS)

                                                                                                                             Quarterly Global Outlook 4Q2019
VIETNAM FOCUS                                                                                                       UOB Global Economics & Markets Research    11
SBV Is Expected To Maintain Its Key Rate Vietnam’s Transport Infrastructure Development
For The Rest Of 2019 To Improve Competitiveness
Source: Bloomberg, UOB Global Economics & Markets Research Source: World Bank, UOB Global Economics & Markets Research
12 128 130
120
10 107
100
8
6
55
4
2
0
1
-2
2012 2013 2014 2015 2016 2017 2018 2019F US Thailand Cambodia Vietnam Indonesia Malaysia Laos
Output Gap (%) Refinancing Rate (%) Inflation (%) Rank Road Connectivity Index (2018)
Despite Raising Minimum Wages,
Half Vietnam’s Population Are Under The Age Of 35
Vietnam’s Labor Costs Are Still Cheaper Than That Of Thailand
Source: Trading Economics, UOB Global Economics & Markets Research Source: Macrobond, UOB Global Economics & Markets Research
274
180
170
128
91
Thailand Vietnam Cambodia Laos Myanmar
Minimum Wages (US$/Month)
Around 40% of Vietnam’s Labour Force FDI (Realised Capital) To Vietnam
Engaged in Agricultural Sector Rose To A New Record In 2018
Source: Macrobond, UOB Global Economics & Markets Research Source: Ministry of Planning & Investment, UOB Global Economics & Markets Research
19.1
17.5
16
10.6
9.1
7.3
5.7
4.12
2.58
1.55
Jul
201605 Jul
201705 Jul
201805 Jan 19 Feb 19 Mar 19 Apr 19 May 19 Jun 19 Jul 19
FDI To Vietnam (US$ Billion, YTD)
Quarterly Global Outlook 4Q2019
12 UOB Global Economics & Markets Research VIETNAM FOCUSVietnam Foreign Direct Investment, New Projects China Is The Biggest Investor In Vietnam
Source: Macrobond, UOB Global Economics & Markets Research Source: Macrobond, UOB Global Economics & Markets Research
FDI Inflows To ASEAN Surged Stronger FDI Into VN & MY Since Onset Of US-China Trade Tensions
Amid Escalating US-China Trade Tensions ASEAN FDI Inflows (BOP basis): Comparison of quarterly averages
Source: Macrobond, UOB Global Economics & Markets Research Source: Macrobond, UOB Global Economics & Markets Research
Nearly 75% of FDI Into Vietnam
Table 1: FDI Incentives In Vietnam
Has Been Concentrated In Manufacturing
Incentives Economic Zones (EZs) Industrial Parks Outside EZs Source: Macrobond, UOB Global Economics & Markets Research
Exemption 4 years after 2 years after commercial
period commercial operation operation
50%
Corporate reduction 9 years 4 years
Income period
Tax
Tax rate
after 10% for first 2 years
20%
holiday 20% after that
period
50% reduction for
Normal rate 5-35%
Personal Income Tax both foreign and local
(progressive rate)
workers
Source: TDRI, UOB Global Economics & Markets Research
Scan the QR Code for full report:
Vietnam: Asia’s Bright Spot Amid Trade Tensions
or click here
Quarterly Global Outlook 4Q2019
VIETNAM FOCUS UOB Global Economics & Markets Research 13SINGAPORE FOCUS
A Global Slowdown, An Easing MAS?
ASEAN economic fundamentals remained soft since our last update on the trade tensions and its impact to ASEAN. Manufacturing
and trade momentum in Singapore and the region continued to stay lackluster to-date.
Singapore, being an export-oriented economy and a price-taker, remains vulnerable to the ongoing US-China trade tensions.
Singapore’s output gap has turned negative since 4Q18 and is at risk of remaining so for the rest of 2019.
We expect MAS to ease monetary policy at the October meeting by lowering the policy slope by 0.5% point from a currently
estimated 1.0% appreciation. This would reverse one of the two steepening moves made in 2018. There is also a risk that MAS may
ease the policy slope all the way to neutral, a signal that a looser monetary policy is needed to cushion both inflation and growth
risks into 2020.
Coupled with the relatively poorer economic backdrop, the weakening of the S$NEER would likely come to pass, as seen during
the early 2000s recession and the Global Financial Crisis of 2008/9. In the run up to October’s MAS policy meeting, a weaker SGD
could be in place that would naturally guide the S$NEER lower in anticipation of a looser monetary policy.
The Global Picture Tainted With Trade Tensions
As both the US and China threatened to slap tariffs on each other’s goods since relations deteriorated in early Aug, hope for a quick and
firm resolution of the US-China trade woes is rapidly fading away.
Industrial Production Growth Is Tapering Across Key Asian Economies
Source: Macrobond, UOB Global Economics & Markets Research
With the escalation of trade tensions, ASEAN economic fundamentals remained soft since our last update on the trade tensions and its
impact to ASEAN. Manufacturing and trade momentum in the region continued to stay lackluster to-date, seen especially in Thailand,
Singapore and the Philippines, and Indonesia. While there may be some signs of stabilization in Singapore’s industrial production numbers
recently, manufacturing sector has nonetheless contracted 1.7% in the first seven months of 2019. Beyond ASEAN, China’s industrial
production growth had also slowed to 4.8% y/y in July, the slowest since February 2002. Japan also saw 5 months of manufacturing
contraction in the past 7 months, while South Korea clocked 5 straight months of negative growth into June 2019. Even production
momentum in the U.S. slowed considerably to 0.5% y/y in July 2019, the softest since November 2016.
Quarterly Global Outlook 4Q2019
14 UOB Global Economics & Markets Research SINGAPORE FOCUSSimilarly on the trade front, export momentum has slowed considerably since the start of the year. Anemic export growth continued to
persist in many Asian economies including Singapore, Thailand, Indonesia, South Korea, Hong Kong and Japan. Singapore’s key non-oil
domestic exports (NODX) contracted in eight out of the past nine months, led by declines in both electronic and non-electronic exports.
Export Momentum Across Key Economies
Source: Bloomberg, UOB Global Economics & Markets Research
Singapore’s Negative Output Gap Likely to Persist
As such, the abysmal global economic environment has sent Singapore’s output gap, defined as the difference between the actual GDP
growth and potential GDP growth, into negative territory since 4Q18. Note that the Monetary Authority of Singapore (MAS) has projected
Singapore’s economic growth pace will be below potential this year, in line with our output gap estimates. This is in sharp contrast to the
October 2018 policy statement where it reported that economic output was slightly above potential back then. Looking back, we note that
MAS has generally eased monetary policy at times when the output gap has fallen into negative territory (except for 14th October 2011,
although output gap turned lower in the subsequent quarter). A negative output gap also indicates the presence of growth slack in the
economy and that inflation will likely be kept in check.
Singapore Output Gap (%)1 Has Worsened Into 2019
Source: Macrobond, UOB Global Economics & Markets Research
1 We estimate Singapore’s output gap via the Hodrick and Prescott (1997) filter, using a smoothing parameter of 1,600 for quarterly data and estimate the cycle for the period between
2000 and 2019.
Quarterly Global Outlook 4Q2019
SINGAPORE FOCUS UOB Global Economics & Markets Research 15With the objective to “maintain price stability conducive to sustained growth of the economy”1, the likely persistent negative output gap
in the second half of this year (and possibly beyond) will likely persuade MAS to ease monetary policy at the October meeting. We
expect MAS to lower the S$NEER policy slope by 0.5% point from a currently estimated 1.0% appreciation, while keeping the rest
of its policy parameters (i.e. midpoint and width of bands) unchanged. This brings the estimated appreciation slope to 0.5%, reversing
one of the two steepening moves made in 2018. Moreover, there is a growing risk that MAS may flatten the appreciation slope and ease
the policy all the way to neutral, a signal that a looser monetary policy is needed to cushion both inflation and growth risks into 2020.
As such, in the run up to October, the expectation for MAS to ease monetary policy should weigh on the S$NEER: The S$NEER has
already declined from as high as +1.8% above mid-point in the first quarter of this year, to +0.8% above mid-point by end-August.
As such, we expect the S$NEER to soften into October for the following reasons:
Firstly, the past five easing moves in October 2008, October 2011, January 2015, October 2015, and April 2016, were done when the
S$NEER was below the estimated mid-point. In the weeks before the eventual monetary easing move, market participants had guided
the S$NEER lower in anticipation of such a move.
MAS’ Easing Policy Made In Last Five Moves Are Accompanied By The S$NEER Below Mid-Point
Source: Macrobond, UOB Global Economics & Markets Research
130
Oct 2011
Oct 2008
125
120
115
110
105
Jan 2015
Apr 2016
Oct 2015
100
95
2006 2007 2009 2011 2013 2015 2017 2019
UOB S$NEER Perceived Mid-point Upper Band Lower Band
Secondly, on a premise that the MAS monetary policy is forward looking and focused on the medium term economic outlook, a monetary
easing move into October 2019 may indicate policy-makers’ reduced optimism on Singapore’s economic outlook into the four to six
quarters ahead. The MAS noted that their econometric models suggest that the “peak impact of a change in exchange rate policy on
the economy occurs only after four to six quarters,” which is then cited as the main reason why monetary policy formulation needs to be
forward-looking. As such, further expected weakness in Singapore’s economic outlook may weaken the S$NEER, as seen during the
early 2000s recession and the Global Financial Crisis of 2008/9.
Can Singapore Avoid A Technical Recession?
While it is evident that Singapore’s growth momentum has deteriorated markedly in the first half of 2019, there are signs that growth will
likely stabilize into the third quarter of 2019. Our econometric model indicates that Singapore will likely avoid a technical recession, given
that the 1H19’s lackluster growth has been largely due to the high base in 1H18 while recent incoming manufacturing data showed some
signs of stabilisation. In other words, after recording -3.3%q/q SAAR in 2Q19, we see a low likelihood of a consecutive negative q/q figure
in 3Q19. Generally, a technical recession is defined as two consecutive quarters of negative q/q SAAR readings.
While we have recently downgraded our full-year GDP growth for 2019 to +0.6% (down from an initial 1.0% forecast, official forecast:
0-1%) and expect manufacturing to contract by 1.9% (down from the previous -1.0% forecast), a contraction for the full year appears
unlikely at this juncture. For instance, Singapore’s labour market continues to stay resilient to-date, amid pockets of silver lining including
the positive contribution from the modern services cluster and a recovering construction industry which had seen two consecutive
quarters of expansion after ten straight quarters of contraction.
With our expectation of an easing MAS policy stance in October, the S$NEER is likely to be weighed down. This development reinforces
our end-2019 USD/SGD projection of 1.40.
Quarterly Global Outlook 4Q2019
16 UOB Global Economics & Markets Research SINGAPORE FOCUSINDONESIA FOCUS
East Kalimantan To Host New Capital City Of Indonesia By 2024
The idea of moving the capital emerged several times since the country gained independence in 1945. The first was proposed by
the country's founding father Sukarno in the 1950s, then a decade ago under the current President predecessor, Susilo Bambang
Yudhoyono. However, it has never been discussed in a planned and matured manner, until recently the idea was brought back.
Why Move The Capital?
Indonesia’s leader expects the relocation of the capital will help ease inequality and relieve some of the burden from Jakarta, and the
island of Java. The economic gap between Java and outside Java has continued to widen despite the regional autonomy policy launched
in 2001. Furthermore, the rationale behind changing the capital includes:
Java, especially Jakarta, is already overcrowded. With an area of 128,297km2, Java is home to approx. 60% of the country’s
population and represents more than half of its economic activity (Figure 1).
Jakarta, in particular, is the most populous in Southeast Asia with a population density of around 15,000 people/km2, which is also
the highest population density in Indonesia (Indonesia population density: 142 people/km2). This is bound to some critical issues
such as inadequate infrastructure, lack of affordable housing, flooding, pollution, slum creation, crime, congestion and poverty.
Jakarta is sinking; two-fifths of Jakarta lies below sea level and parts are dropping at a rate 20cm a year, due to subsidence. The
city does not pipe in enough drinkable water, so the society relies largely on wells which extract water from shallow aquifers, leading
to the land above it collapsing. Modelling from researchers at the Bandung Institute of Technology has shown that 95% of northern
Jakarta could be under water by 2050.
The city's low-laying nature also makes Jakarta chronically prone to regular flooding during the annual tropical wet season — a
recurring problem which is persistent until today.
Again, due to the high population density, Jakarta is struggling with pollution and traffic congestion. Air quality in the city has plunged
over the last few months, recording worse conditions than notoriously polluted cities such as Delhi and Beijing. Meanwhile, the
gridlock costs an estimated IDR100tn (USD7bn) a year in lost productivity.
Figure 1. Indonesia Regional GDP Growth
Source: Statistics Indonesia, Bank Indonesia, UOB Global Economics & Markets Research
4.64 4.55 4.62 5.39 5.60 9.80 9.83 5.27
4.34 3.24 3.35 1.58 0.68 5.06 5.07 5.05
Q1 Q2 Q1 Q2
Q1 Q2 Q1 Q2 Q1 Q2 Q1 Q2 Q1 Q2 Q1 Q2
2018 2019
2018 2019 2018 2019 2018 2019
Sulawesi, Maluku, and
Sumatera (22%) Kalimantan (8%) Papua (9%) National (100%)
5.70 3.77 3.56 4.74 5.05
5.67 5.68
5.65
Q1 Q2 Q1 Q2
Q1 Q2 Q1 Q2
2018 2019
2018 2019
Bali and Nusa Tenggara
Jawa (58%) (3%)
Where Will The New Capital Be?
At the end of August, the incumbent has announced the national capital will move from Jakarta. If approved by the Parliament, the new
capital city will sit approx. 1,400 km northeast from Jakarta on 1800 km2 (vs. Jakarta 661.5 km2) of land already owned by the government;
in the regencies of North Penajam Paser and part of Kutai Kertanegara in East Kalimantan (Figure 2). Kalimantan is the Indonesian portion
of the island of Borneo, which is also shared with Malaysia and Brunei. Kalimantan is deemed more central in Indonesia’s archipelago of
17,000 islands. Currently, Kutai Kertanegara’s economy is heavily dependent on the mining sector which the goods are exported to the
Quarterly Global Outlook 4Q2019
INDONESIA FOCUS UOB Global Economics & Markets Research 17global market. Meanwhile, North Penajam
Paser’s main economy is centered on Figure 2. The Location of The New Capital City
agriculture, construction and trading. Source: GeoNames, HERE, Microsoft, UOB Global Economics & Markets Research
Funding & Development Stages
The entire project will cost a total of
IDR486tn (roughly USD33bn), financed
through the state budget (19.2%), private
sector (26.2%), and public-private-
partnership (PPP, 54.6%) to accommodate
an estimated 1.5 million people (Figure
3). National Development Planning
(Bappenas) reiterated that the first phase
of the new capital development will start
at the end of next year (2020), following
further study, area design, and building
layout between 2019 – mid 2020. The
construction of basic infrastructure will
take about 3 to 4 years, while the actual
Figure 3. Source of Funding
relocation will start in 2024 (Figure 4).
Source: National Development Planning, UOB Global Economics & Markets Research
What Will Happen To Jakarta?
Jakarta, on the other hand, will remain Public-Private State Budget State Budget
as the country’s main financial and Partnership (PPP) 19.2% Construction Istana Negara
business center; therefore, relocation will 54.6% and Strategic Building of
not deprive Jakarta of economic growth. National Arm Forces (TNI),
Police (Polri), Civil Servant
It is estimated that Jakarta (with current
population approx. 10 million in the city Private
and 30 million across Greater Jakarta IDR 486tn Residential/Housing
area) will only lose 800,000 of its current Complex, Shopping mall
inhabitants (civil servants in particular).
Private PPP
Even though several hundred thousand of
Other Infrastructures which
its population are expected to move to the Companies are not covered above
new capital city, problems and challenges 26.2%
still remain. Jakarta’s population is on the
track to break through the top 10 most
populated cities in the world. This would
Figure 4. Development Stages
mean that Jakarta will continue to face
traffic congestion and air pollution. Source: National Development Planning, UOB Global Economics & Markets Research
Other Countries Study New capital city is ready, Development of national
begin the relocation parks, conservation
That Moved Their Capital process area, non-civil servant
The question of whether this capital clusters, etc.
relocation will result in some type of
2019 - 2020 2024 2030 - 2045
political, social, or economic benefit
remains unanswered. Countries that
have shifted their capital include Brazil
and Myanmar among others. Brazil’s 2020 - 2024 2025 - 2029
economic expansion was concentrated
Land preparation and Property development
in the old capital of Rio de Janeiro, while for education and health
spatial implementation
Sao Paulo, Santos and other inland parts Basic infrastructure facilities, as well as
including Amazon are behind. In addition, development military bases
Brazil would like to take stronger hold of
its vast territory which is surrounded by 10
other countries. To address the economic and security issue, Brazil’s government decided to shift the capital to Brasilia in 1960, which
is located more to the center of the country. Brazil’s capital relocation was considered a success as the new capital Brasilia experienced
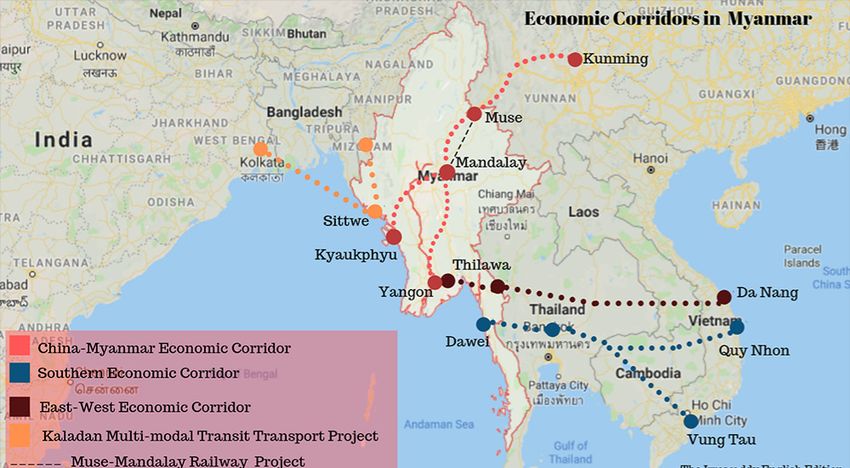
rapid growth, and has become the region with the highest income per capita in the country. For Myanmar, the modern capital since 2006
is Naypyidaw. However the previous capital city Yangon remains the main economic driver while the new capital Naypyidaw’s economy
has yet to surge. Certainly, moving the capital will not be quick nor cheap. It carries massive hidden costs and takes years to establish a
fiscally viable city with higher proportion of economic contribution overall.
Quarterly Global Outlook 4Q2019
18 UOB Global Economics & Markets Research INDONESIA FOCUSASEAN FOCUS
Real Estate Outlook
Dark clouds have gathered over Kuala
Lumpur (KL) and ASEAN-4 residential
As concerns grow over weaknesses markets. KL residential, retail and office
in global property markets amid segments are dragged by oversupply; ASEAN-4
elevated prices and economic residential markets are facing a slowdown or
slowdown, we assess the real estate decline due to a mixture of cooling measures
outlook in ASEAN-4 (SG, MY, ID, and demand-supply imbalances. On balance,
TH), taking a closer look at key risks prospects are favourable for SG office with
& emerging opportunities. limited supply expected to underpin growth.
Residential Property Clock Office Property Clock
Source: UOB Country & Credit Risk Management Source: UOB Country & Credit Risk Management
Fa
g
Fa
in
g
Singapore
llin
in
ak
llin
Bangkok
ak
g
Pe
g
Kuala
Pe
Lumpur
Bangkok
Kuala Lumpur
Jakarta
Singapore
Jakarta
g
g
in
R
in
m
R
is
m
is
tto
in
tto
in
g
Bo
g
Bo
Industrial Property Clock Retail Property Clock
Source: UOB Country & Credit Risk Management Source: UOB Country & Credit Risk Management
Kuala
Fa
g
Fa
g
in
Lumpur
in
llin
llin
ak
ak
g
g
Pe
Pe
Kuala Lumpur
Jakarta
Bangkok
Bangkok
Singapore
g
g
Singapore
in
in
R
R
m
is
m
is
Jakarta
tto
in
tto
in
g
g
Bo
Bo
A rating scale of 1-6 is used: 1- low risk, 2- moderately low risk, 3- moderate risk, 4- moderately high risk, 5- high risk, 6- highly vulnerable.
Quarterly Global Outlook 4Q2019
ASEAN FOCUS UOB Global Economics & Markets Research 19Residential markets in SG, KL and Bangkok (BKK) could face sustained downward pressure. Punitive cooling measures, elevated
supply resulting from the en bloc boom and global economic slowdown will continue to weigh on SG. Meanwhile, demand in BKK will be
dampened by stricter mortgage lending rules w.e.f. Apr 19 and easing demand from Chinese investors (~20% of condo presales, highest
in ASEAN). In KL, oversupply pressures could persist with the high-end segment most affected. Jakarta (JKT) residential has been
subdued post-commodities downturn though relaxation in LTV and ebbing elections uncertainty could help support.
ASEAN-4 Cities At Risk Of Sustained Downturn/Slowdown
Contributing Factors
Sustained
Country Housing Oversupply Sensitivity To Slower
Downside Pressure Policy Tightening Mortgage Loan Growth
Pressure Regional / Global Growth
Singapore
Kuala Lumpur
(high end)
Bangkok
(selected districts) (condos)
Jakarta
(policy easing)
Source: UOB Country & Credit Risk Management
ASEAN-4 Residential Prices Singapore Residential Market’s Decline Caused By Cooling Measures
Source: BIS, National sources, UOB Country & Credit Risk Management Source: URA, UOB Country & Credit Risk Management
Note: 4QMA = 4 qtr moving average. Transactions include both new launch & secondary sales
2010 levels=100 %
250 160
50
230
210
30
190 150
170 10
150
130 -10
140
110
90 -30
70
50 130 -50
Jun 10 Dec 11 Jun 13 Dec 14 Jun 16 Dec 17 Jun 19 Jun-16 Dec-16 Jun-17 Dec-17 Jun-18 Dec-18 Jun-19
Jul 18 cooling measure
Singapore Kuala Lumpur PPI
Bangkok Jakarta Transactions 4QMA%YoY (RHS)
Thailand’s New Mortgage Rules wef Apr 19
Kuala Lumpur Market Down Since 4Q17 On High End Oversupply
Expected To Dampen Bangkok’s Housing Market Ahead
Source: NAPIC, UOB Country & Credit Risk Management Source: CEIC, UOB Country & Credit Risk Management
Note: High end is defined as over RM500k/unit
2010 levels=100 % 2009 levels =100
210 200 80%
90%
200 190
40%
190 60%
180
180 0%
30%
170
170
-40%
0% 160
160
150 -30% 150 -80%
Mar-15 Dec-15 Sep-16 Jun-17 Mar-18 Dec-18 Jun 16 Mar 17 Dec 17 Sep 18 Jun 19
Tighter mortgage rule announced
KL House Price Index Condo Price Index
Transaction 4QMA %YoY (RHS) Transactions 12MMA YoY (RHS)
Housing Developer's Sentiment Index 6M (RHS)
>RM500k launches as % of total (RHS)
Quarterly Global Outlook 4Q2019
20 UOB Global Economics & Markets Research ASEAN FOCUSDownside to housing prices could however be benign based on historical episodes. The drivers in the current episode are largely domestic (e.g. oversupply, policies), against a backdrop of moderating economic growth. On the other hand, the sharpest downturn faced by ASEAN-4 in the last 30 years occurred during the Asian Financial Crisis where prices fell by as much as 45% in SG and 37% in BKK. Ex-SG, housing markets have been largely resilient in the face of adverse events, with the next most severe downturn at
Mortgage quality risk mitigated by macro-prudential
     measures, firm labour markets and downward pressure on                                                                                                  Household Debt To GDP Ratio Has Mostly Declined In ASEAN-4
     rates. Except for ID, property measures have been tightened in                                                                                     Source: BIS, UOB Country & Credit Risk Management
     ASEAN-4 and these have helped curb credit-fuelled excesses
     and stabilise household debt levels. While ID’s recent removal of                                                                                   % of GDP
                                                                                                                                                        80
     first time buyer’s down payment may be credit negative, this could
     be mitigated by lower rates, healthy labour market and prudent                                                                                     70
     credit underwriting by the banks. Impact of tighter LTVs in TH may                                                                                 60
     be limited as likely only a minority of new housing loans would be
                                                                                                                                                        50
     affected.
                                                                                                                                                        40
     Office demand increasingly reliant on co-working; oversupply        30
     still weighing on KL & JKT. Co-working has grown rapidly in
                                                                         20
     ASEAN (c.40% CAGR from 2014-17) with a proliferation of
     operators though still accounting for minimal share of overall      10
     stock (4+% in SG, ~2% in ASEAN). With sustainability of co-          0
     working business model untested and major players still in the       Dec-10     Jun-12                                                                                                Dec-13           Jun-15           Dec-16             Jun-18
     red, potential consolidation could negatively impact the sector as           ID                                                                                                  MY                 Global                SG                 TH
     underlying demand from traditional occupiers has lagged. Given
     rising tenant concentration risk, EU banks have curtailed lending
     to office assets whereby an established shared workspace company is a major tenant.

     Retail buffeted by additional headwinds from China slowdown amid e-commerce disruption. SG and TH are more susceptible
     to a China slowdown as shopping expenditure by Chinese tourists contribute c.6% and c.4% of retail sales respectively in 2018. With
     ASEAN e-commerce penetration still lagging (SG: 8%, rest of ASEAN
You can also read