Tagging Baltic Cod - TABACOD - Eastern Baltic cod: Solving the ageing and stock assessment problems with combined state-of-the-art tagging methods ...
←
→
Page content transcription
If your browser does not render page correctly, please read the page content below
DTU Aqua
 National Institute of Aquatic Resources

Tagging Baltic Cod – TABACOD
Eastern Baltic cod: Solving the ageing and stock assessment
problems with combined state-of-the-art tagging methods
By Karin Hüssy (ed.)

DTU Aqua Report no. 368-2020
Tagging Baltic Cod – TABACOD
Eastern Baltic cod: Solving the ageing
and stock assessment problems with
combined state-of-the-art tagging methods
DTU Aqua Report no. 368-2020

By Karin Hüssy1 (ed.), Michele Casini2, Stefanie Haase3, Annelie Hilvarsson2,
Jan Horbowy4, Maria Krüger-Johnsen1, Uwe Krumme3, Karin Limburg2, Kate
McQueen3, Monica Mion2, Hans Jakob Olesen1, and Krzysztof Radtke4
1 Technical University of Denmark, National Institute of Aquatic Resources (DTU Aqua), Denmark
2 Swedish University of Agricultural Sciences, Department of Aquatic Resources (SLU Aqua), Sweden
3 Thünen Institute of Baltic Sea Fisheries (TI-OF), Germany
4 National Marine Fisheries Research Institute (MIR-PIB), Poland

 Funding:
 BalticSea2020 (balticsea2020.org)
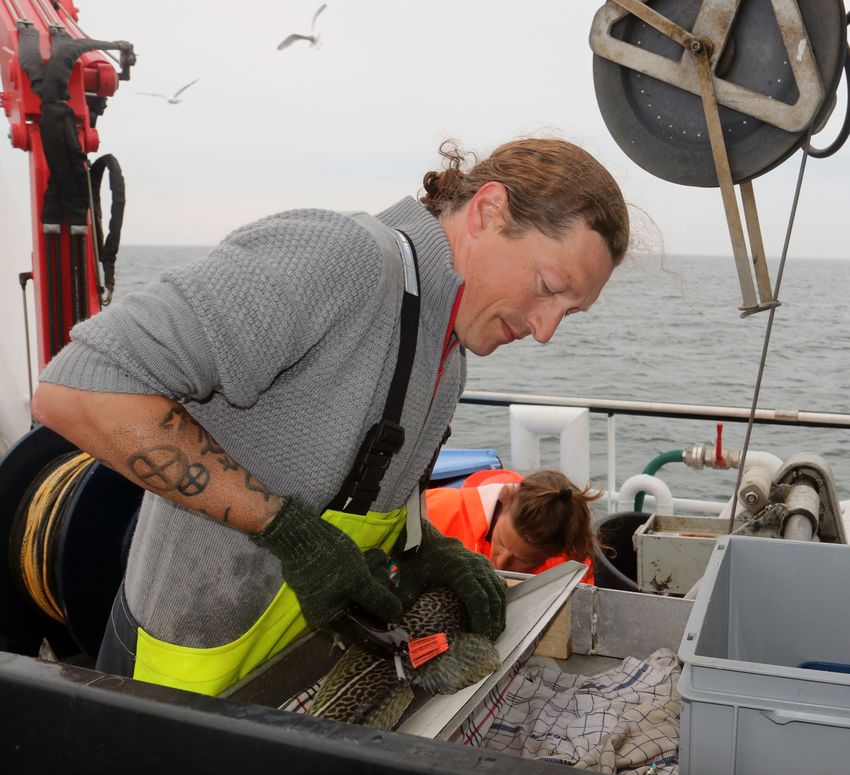
Colophon

Title: Tagging Baltic Cod – TABACOD. Eastern Baltic cod: Solving the ageing and
 stock assessment problems with combined state-of-the-art tagging methods

Authors: Karin Hüssy1 (ed.), Michele Casini2, Stefanie Haase3, Annelie Hilvarsson2, Jan
 Horbowy4, Maria Krüger-Johnsen1, Uwe Krumme3, Karin Limburg2, Kate
 McQueen3, Monica Mion2, Hans Jakob Olesen1 and Krzysztof Radtke4 (alpha-
 betical order)
 1
 Technical University of Denmark, National Institute of Aquatic Resources (DTU Aqua),
 Denmark
 2
 Swedish University of Agricultural Sciences, Department of Aquatic Resources (SLU
 Aqua), Sweden
 3
 Thünen Institute of Baltic Sea Fisheries (TI-OF), Germany
 4
 National Marine Fisheries Research Institute (MIR-PIB), Poland

DTU Aqua Report no.: 368-2020

Year: The scientific work was finalized in May 2020. The report was published in June
 2020.

Reference: Hüssy, K., Casini, M., Haase, S., Hilvarsson, A., Horbowy, J., Krüger-Johnsen,
 M., Krumme, U., Limburg, K., McQueen, K., Mion, M., Olesen, H.J. & Radtke, K.
 (2020). Tagging Baltic Cod – TABACOD. Eastern Baltic cod: Solving the ageing
 and stock assessment problems with combined state-of-the-art tagging me-
 thods. DTU Aqua Report no. 368-2020. National Institute of Aquatic Resources,
 Technical University of Denmark. 64 pp. + appendices

Cover photo: Hans Jakob Olesen (DTU Aqua) tagging a Baltic cod. Photo: Line Reeh

Published by: National Institute of Aquatic Resources, Kemitorvet, 2800 Kgs. Lyngby, Den-
 mark

Download: www.aqua.dtu.dk/publikationer

ISSN: 1395-8216

ISBN: 978-87-7481-290-6

DTU Aqua Reports contain results from research projects, reviews of specific topics, expositions for au-
thorities etc. Unless stated in the colophon, the reports are not peer reviewed, which means that the content
has not been reviewed by researchers outside the project group.

Contents

Preface ................................................................................................................................ 4

Executive summary ............................................................................................................. 5

1. Introduction ............................................................................................................... 9

2. WP 1: Historical tagging data.................................................................................. 12
2.1 Introduction .......................................................................................................................... 12
2.2 Methods ............................................................................................................................... 12
2.3 Results ................................................................................................................................. 13
2.4 Conclusions ......................................................................................................................... 14

3. WP 2: New tagging program ................................................................................... 15
3.1 Introduction .......................................................................................................................... 15
3.2 Methods ............................................................................................................................... 16
3.3 Results ................................................................................................................................. 23
3.4 Conclusions ......................................................................................................................... 27

4. WP 3: Data analyses for stock assessment ........................................................... 29
4.1 Time series of growth ........................................................................................................... 29
4.2 Comparison of stock-specific growth.................................................................................... 32
4.3 Migration patterns from historic and new tagging data ......................................................... 33
4.4 Horizontal migrations of individual fish: Geolocation using DST .......................................... 39
4.5 Vertical Movements of individual fish ................................................................................... 43
4.6 Estimation of fishing and natural mortality basing on tagging data ...................................... 47

5. WP 4: Methods for future growth estimation ........................................................... 50
5.1 Introduction .......................................................................................................................... 50
5.2 Methods ............................................................................................................................... 51
5.3 Results ................................................................................................................................. 54
5.4 Conclusions ......................................................................................................................... 64

6. Lessons learned ...................................................................................................... 66

7. Conclusions and future perspectives ...................................................................... 69

8. Acknowledgements ................................................................................................. 72

References ........................................................................................................................ 74

Appendix 1: Publications and Dissemination .................................................................... 81

Appendix 2: Manual for internal tagging with tetracycline-hydrochloride .......................... 88

Appendix 3: Manual for tagging with T-bar and Data Storage Tags ................................. 89

TABACOD Final Report 3
Preface

The TABACOD project was granted from 01-01-2016 to 31/12/2019, and extended to 31-05-
2020 and supported by BalticSea2020 with 27 mil. SEK.

The scope of the project was to provide the biological knowledge on age, growth and mortality
of the cod (Gadus morhua) stock in the eastern Baltic Sea. The lack of biological information on
growth and mortality has hampered stock assessment since 2013, leading to uncertainty of the
stock productivity and status and the suspension of the Marine Stewardship Council (MSC) cer-
tificate.

The work carried out within TABACOD was focused on providing data, analytical approaches
and estimates to increase the reliability of the stock assessment now and in the future. Some of
the TABACOD results have already been used at the International Council for the Exploration of
the Sea (ICES) Benchmark Assessment in 2018-2019 and at the Baltic Fisheries Assessment
Working Group (WGBFAS) in 2019 and 2020, and contributed to the re-installation of an analyti-
cal stock assessment model for the eastern Baltic cod stock.

Following this recent evaluation of the stock status, in 2019 and 2020, the European Commis-
sion decided, on advice from ICES, a closure of the fishery with only a bycatch quota for east-
ern Baltic cod. Since cod is one of the ecologically and commercially most important fish spe-
cies in the Baltic Sea, this situation has also had severe consequences for the ecosystem and
the fishing industry.

This report presents all major results achieved during the TABACOD project. The majority of the
results presented have already been published in peer-reviewed literature or will be in the fore-
seeable future.

Kgs. Lyngby, May 2020

Karin Hüssy
Project coordinator

4 TABACOD Final Report
Executive summary

Historical tagging data
The objective of WP1 was to collate data from previous tagging experiments in the Baltic Sea to
provide the empirical information for the development of statistical growth models and the esti-
mation of historical growth for stock assessment purposes.

Data from cod tagging experiments (using conventional tags) performed between the 1950s and
1990s by Sweden, Poland, Latvia, Finland, Denmark and Germany in the Baltic Sea have been
collected from the respective national archives, digitized, quality-checked and combined in a
common database. The database contains information about ~ 86200 cod releases. Data for a
total of 10143 recaptured cod are available covering a release period between 1955 and 1993.
The records in the compiled database of all recaptured cod includes information on release and
recapture date, location (geographical coordinates or ICES Subdivisions) and total length, as
well as occasional information on total weight, sex and maturity stage. The length of recaptured
cod ranged between 140-1100 mm and the time between release and recapture ranged be-
tween 0-3928 days. In addition, tagging data for a more recent project CODYSSEY (446 fish
tagged with Data Storage Tags between 2002 and 2006), covering the southern Baltic Sea,
were also combined with the historical database adding 234 cod recaptured between 2003 and
2006. The length of recaptured CODYSSEY cod ranged between 450-985 mm and time be-
tween release and recapture ranged between 1-607 days.

These data provided key information to estimate the historical baselines of eastern Baltic cod
growth and therefore contributed substantially to the re-establishment of an analytical stock as-
sessment for the eastern Baltic cod in 2019 (WP3). In addition, these data provides detailed in-
formation that can be used to estimate horizontal movements of the population between differ-
ent areas of the Baltic Sea (WP3).

New tagging program
The objective of WP2 was to design and carry out a large-scale cod tagging program in the
southern Baltic Sea (ICES subdivisions 24, 25, 26), which is currently the main area of Eastern
Baltic cod distribution. The purpose of conducting this tagging study was to gain new data on
contemporary growth rate and otolith development of eastern Baltic cod. The tagging data were
also to be used to investigate movement patterns, mortality rates, fish behavior and environ-
mental experience.

In addition to designing and conducting the new tagging program, publicity work to advertise the
project and the creation and maintenance of a tagging database was also conducted within this
WP. The recaptured cod were assigned to stock of origin using genetics or otolith shape analy-
sis. Experiments to estimate tag-loss rates, short-term mortality rates and freezing-induced
shrinkage of cod were also carried out, to address potential biases in the interpretation of the
tagging results.

TABACOD Final Report 5

Between March 2016 and May 2019, 25352 cod were tagged and released in different regions
of the southern Baltic Sea. Cod were tagged with external T-bar tags and injected with tetracy-
cline-hydrochloride (hence forward referred to as tetracycline), to induce a permanent mark on
their otoliths. In addition, 5% of tagged cod were implanted with electronic Data Storage Tags.

By April 2020, 383 recaptured cod had been returned, corresponding to a return rate of 1.5%.
This return rate is low in comparison to historical cod tagging studies in the Baltic Sea, though
contemporary recapture rates of cod in the western Baltic Sea are similarly low. 76% of recap-
tured cod were assigned to the eastern Baltic stock, 12% were assigned to the western Baltic
stock, and 12% could not be assigned to a stock. Short-term mortality rates and tag loss were
estimated. Significant freezing-induced shrinkage of Baltic cod was observed.

The data collected through this tagging program provides the only contemporary, directly meas-
ured growth information presently available for cod in the southern Baltic Sea, independent from
unreliable age estimates. The chemically marked otoliths of the recaptured cod provide the es-
sential material for validation of the future age estimation method currently being developed.

Data analyses for stock assessment
The objective of WP3 was to use these data from WP1 and WP2 to 1) develop and apply
growth models to estimate changes in cod growth rates and implement them in analytical stock
assessment models, 2) provide current fisheries-independent estimates of mortality based on
the new TABACOD tagging program, 3) analyze the large-scale and small-scale horizontal and
vertical movements of cod.

Temporal changes in eastern Baltic cod growth were estimated using GROTAG (based on the
von Bertalanffy growth function) and Generalized Additive Models using the historical tagging
data and the new TABACOD tagging program. Both analytical methods showed a peak in
growth in the 1980s (~11 cm/y for a 35-cm fish) followed by a drop; the current growth of east-
ern Baltic cod is the lowest (~6 cm/y for a 35-cm fish) ever recorded since the 1950s and signifi-
cantly lower than the growth of the neighboring western Baltic cod (~14.5 cm/y for a 35-cm fish).
The different environment experienced by the respective stocks apparently contribute signifi-
cantly to explain the current differences in growth. The estimated parameters of the von Ber-
talanffy growth function (L∞ and k) have been directly used in stock assessment and contributed
in to the re-establishment of an analytical stock assessment for the eastern Baltic cod in 2019
by ICES. The growth estimates have been refined in the last part of the TABACOD project
(2019-2020) using the additional recaptures and will be used in future stock assessments.

The data associated with conventional tags were used to investigate the migration patterns and
mean distances covered by the individuals between release and recapture. In the historical pe-
riod (1955-1990) there were long distance movements from the northern Baltic towards the
southern Baltic, probably linked to spawning in the main southern spawning area. Fish tagged in
the southern Baltic covered shorter distances, both in the historical and current period, suggest-
ing that the geographical range of these fish is smaller and did not change in time.

6 TABACOD Final Report
Geolocation techniques were used to produce movement trajectories of individual cod by com-
paring the temperature and depth profiles of recaptured Data Storage Tags with environmental
information obtained from a regional ocean model. This allowed detection of the existence of
more stationary individuals and others moving across larger distances, which are likely exposed
to different fishing pressure if not equally distributed in space and time. The analysis confirmed
that cod often cross management borders (SDs 24 and SDs 25) and especially that the central
and western part of the Arkona basin (western Baltic) is extensively used by eastern Baltic cod.

The data registered by the Data Storage Tags from the recent tagging were analyzed for recur-
ring patterns in depth use and experienced temperature. The eastern Baltic cod performed diel
vertical movements correlated with the periods of dusk and dawn likely following their pelagic
prey, although during spawning fish tended to stay more in deeper spawning grounds. Vertical
movements were also related to the lunar cycle with larger vertical activity during new moon.
Whether vertical movements visible in the Data Storage Tag profiles reflected vertical move-
ments in the open water column or up and down along a coastal slope is still unclear.

Fisheries-independent mortality rates using recent tagging data were estimated using a method
similar to Brownie’s and the classical equations of population dynamics. The model, fitted using
maximum likelihood approach, was fitted to data on tagged and recaptured cod in 2016-2019
and the parameters estimated were fishing mortalities, natural mortality and reporting rates. Nat-
ural mortality was confirmed to be high (M=0.6-0.8). The reporting rate was estimated to be very
low (0.05). Both estimates of natural and fishing mortality are quite close to the parameter esti-
mates used in the SS stock assessment model by ICES. The analyses suggest that the results
of tagging may be included into the ICES assessment of eastern Baltic cod.

Methods for future growth estimation
The objectives of WP4 were to develop methods for using otolith microchemistry as age estima-
tion tool and to validate this approach. Two validation samples were available to this project:
The DECODE sample where winter growth zones had been previously identified using daily oto-
lith growth increments, and the otoliths from recaptured TABACOD individuals.

As a first step, an extensive literature review was carried out in order to identify regulatory
mechanisms for element incorporation into the otoliths. In particular elements under strong
physiological control are candidates as proxies for seasonality in fish growth. Primary candi-
dates identified were copper (Cu), magnesium (Mg), manganese (Mn), phosphorus (P), and
zinc (Zn). Profiles of these elements covering the entire life span of the fish were obtained using
Laser Ablation Inductively Coupled Mass-Spectrometry. A comparative age reading exercise
found age estimates derived from chemical profiles of Mg and P to be more precise than tradi-
tional age readings. The validation exercises therefore focused on these two elements.

Also in the validation studies P emerged as the element with the highest consistency in sea-
sonal pattern formation. Magnesium did show seasonal patterns, albeit somewhat less con-
sistent than P. Otolith P concentrations varied consistently over the seasons with minima co-oc-
curring with otolith winter zones in DECODE otoliths or, in the case of the TABACOD otoliths, in

TABACOD Final Report 7

late winter/early spring. Minima in element profiles of P and Mg were formed when water tem-
peratures were coldest across the size range of Baltic cod. The timing of these minima differs
between stocks, occurring around February in western Baltic cod and two months later during
March in eastern Baltic cod. Also the timing of the seasonal maxima are stock-specific, occur-
ring in August and October, respectively. The amplitude in P is considerably larger in western
compared to eastern Baltic cod corresponding to known stock-specific differences in growth
rate. Phosphorus does therefore indeed seem to be a consistent tracer of growth in Baltic cod.
Seasonal signals with minima during winter/late spring were also evident in Mg for the DECODE
otoliths and especially for Mn in the larger TABACOD fish. However, these element patterns
were less consistent over time and fish size than for P.

Linking information from Data Storage Tags with otolith microchemistry supported the hypothe-
sized link between otolith P and seasonal temperature from the two validation samples, in that
otolith P concentrations are significantly influenced by temperature experienced (in particular
the lowest temperatures) in combination with fish size and growth.

The overall conclusion from this WP is that P incorporation into the otoliths of Baltic cod reflects
seasonality in temperature experience and fish somatic growth. Counting cycles of P maxima
and minima therefore provides an accurate estimate of the cod’s age. This technique has there-
fore proven useful as a tool to obtain fish age and estimates of growth. Microchemistry analyses
may thus be used to provide age and growth information of Baltic cod in future stock assess-
ments and validation of historic age estimates from archived otolith samples.

8 TABACOD Final Report
1. Introduction

The Baltic Sea is a large estuary with shallow connections to the ocean through the Danish Belt
Sea. The Baltic Sea has been partitioned into “sub divisions” (SD) by The International Council
for the Exploration of the Sea (ICES) (Figure 1), depending on the prevailing geographical and
hydrological conditions. SD 25-32 cover the eastern Baltic Sea (EB), SD 22, 23 and 24 the
western Baltic Sea (WB) and SD 21 the Kattegat. Traditionally, cod (Gadus morhua L.) in the
Baltic Sea have been considered as belonging to two separate populations, one east of the is-
land of Bornholm, the other from west of Bornholm to the Sound and Danish Belts (Bagge et al.,
1994). The Baltic cod populations are assessed and managed as two distinct stocks: The EB
cod stock in SD 24-32 and the WB cod in SD 22-24, where individuals are assigned to stock de-
pending on the management area in which they were caught. While the focus of TABACOD has
been on the eastern Baltic cod stock, considerable mixing of the two stocks in SD 24 has re-
quired comparative analyses. Therefore, the reader of this report will find references to both
stocks throughout this report.

 The eastern Baltic cod is
 presently under pressure
 from several drivers (e.g.
 anoxic/hypoxic zones, low
 prey availability, parasite
 infestation) and a number
 of adverse developments
 such as low nutritional
 condition and disappear-
 ance of larger individuals
 indicate that the stock is
 in distress (Eero et al.,
 2015). One of the most
 significant stock develop-
 ments observed in recent
 years is the decline in the
 abundance of larger cod.
 Reasons for this are un-
 clear because the extent
 to which it is associated
 with increased mortality of
 older cod and/or low indi-
 vidual growth is unknown.
 Figure 1. Map of the Baltic Sea area showing ICES sub-divisions Being able to disentangle
 (numbers) and management areas (Kattegat, Western Baltic Sea these two processes (in-
 and Eastern Baltic Sea) enclosed by bold lines. creased natural/fishing
 mortality or reduced

TABACOD Final Report 9
growth) is essential for adequate management advice, as depending on the guiding mecha-
nism, appropriate management actions could go in opposite directions.

The key to distinguishing between the potential effects of reduced growth and increased mortal-
ity lies in accurate age information. The stock assessment methods used for many fish species,
including the eastern Baltic cod stocks, depend on age-classified data (such as catch, relative
abundance index, length, weight, maturity etc.). The age of Baltic cod has traditionally been de-
termined by interpretation of annual growth rings in their otoliths. It is well known that the east-
ern Baltic cod stock assessment has traditionally suffered from severe inconsistencies in age
readings between readers and institutes around the Baltic Sea because no clear annual rings
are deposited in the otoliths (Figure 2). The visual structures used for age estimation often do
not correspond to seasonally recurring growth zones (Tokareva, 1963; DECODE, 2009; Hüssy
et al., 2010). Traditional age reading can therefore not provide a reliable basis for an age-based
assessment. The inconsistencies in age readings have persisted since the beginning of age de-
termination for eastern Baltic cod, despite a wide range of efforts to standardize age readings
through inter-calibration workshops and several research projects, summarized in Hüssy et al.
(2016a). Unfortunately, age information has further deteriorated in recent years, just when accu-
rate growth information would have been most urgently required. Between 2014 and 2018, it
has not been possible to quantify the stock status using age-based stock assessment methods
(ICES, 2014, 2015, 2019).

Figure 2. Examples of sectioned cod otoliths. Left: Western Baltic cod, fish size 56 cm, age = 4 years;
Right: Eastern Baltic cod, fish size = 53 cm, age = unknown.

From a stock assessment perspective, age-based models are only as good as the age esti-
mates, and a different perception of current stock size and mortality of eastern Baltic cod can be
obtained depending on the age data used. Non-age-structured assessment models (e.g. length
based or production models) exist and have also been explored for the eastern Baltic cod
(ICES, 2015). However, age information is still crucial to non-age-structured models where
growth is an important parameter, and information on true age is needed to validate recent de-
velopments in growth. Explaining the absence of larger cod and being able to quantify growth

10 TABACOD Final Report
are essential for understanding the present ecology and drivers of the central Baltic Sea eco-
system, where cod is the main piscivorous fish species. Thus, knowledge of whether there is
massive mortality of larger cod taking place or drastic reduction in growth has implications for
interpreting the present food web and ecosystem interactions. Consequently, obtaining vali-
dated age/growth information is also important in the context of ecosystem-based management.

The objectives of TABACOD were therefore to provide the necessary information on growth of
the eastern Baltic cod, to aid in solving the issues with stock assessment and establish a solid
scientific basis for cod management in the Baltic Sea. This required two interlinked tasks:

 i. Collation of old data and establishment of a spatially comprehensive new sample of cod
 with “known growth” to understand the past and present status of the stock based on
 tagging of cod
 By far the most widely used approach to measure the growth of fish is based on the so-
 called “tag-recapture” technique. In TABACOD, this approach involved marking >
 23.000 individuals from the natural population with an external, easily identifiable tag as
 well as an internal chemical mark on the otolith and returning them to the wild. Such
 tagging programs are a cost-efficient method that are used in fisheries studies world-
 wide to derive the basis for estimating population parameters including fish growth and
 natural as well as fishing mortality. These new data were pooled together with historical
 tagging samples to reconstruct the long-term temporal changes in growth.

 ii. The development and validation of an objective method that continuously allows deriv-
 ing growth information in the future based on otolith chemistry
 The otoliths of fish consist primarily of calcium carbonate and protein and grow as a
 function of environmental conditions and the fish’s metabolic rate. Additionally some
 trace elements are incorporated in response to physiology. By validating chemical sig-
 nals as the internal seasonal time recorder of the tagged fish, their age and growth can
 be estimated, both in archived and future samples.

TABACOD Final Report 11
2. WP 1: Historical tagging data

2.1 Introduction
Data recovery and analysis of fish and fisheries historical data has increased in the last dec-
ades (Zeller et al., 2005; Fortibuoni et al., 2017). Historical data has been demonstrated to be
valuable for stock assessment (Zeller et al., 2005) and for evaluating changes in exploited
stocks over long time periods (Christensen et al., 2003; Cardinale et al., 2014). The digitisation
of historical archival data is an important process that would ensure increased exposure and
use of data that otherwise are vulnerable to be ‘forgotten’ (Zeller et al., 2005). For Baltic cod,
tagging experiments have been performed in the past, with around 50-60000 cod marked with
conventional tags by the countries bordering the Baltic Sea since the late 1950s (Bagge et al.,
1994). These historical data have been mainly used to analyse cod movements over the Baltic
seascape (reviewed in Aro, 1989 and 2002), while they have been underutilized for growth anal-
yses and never combined in a common database (see Mion et al., 2020).

Objectives
 • To create a common and quality-checked historical tagging database for cod in the Bal-
 tic Sea.
 • To extract relevant data for individual fish growth modeling (WP3).

2.2 Methods
In this Working Package, data from cod tagging experiments performed between the 1950s and
1990s by Sweden, Poland, Latvia, Finland, Denmark and Germany in the Baltic area have been
collected from the respective national archives, digitized and combined in a common database.
To this common historical tagging database, data from the more recent projects CODYSSEY
(Cod spatial dynamics and vertical movements in European waters and implications for fishery
management), performed between 2002 and 2006, have been also added. Finally, the data has
been quality-screened before applying the growth modelling in WP3.

Figure 3. Different types of tag used in the Baltic cod tagging experiments during 1955-1993. Peter-
son disc tag (a); Lea´s hydrostatic tag (b); Carlin tag (c); T-bar (d).

12 TABACOD Final Report
2.3 Results
Data for a total of 10143 recaptured cod, were available covering a release period between
1955 and 1993 (Table 1). The records in the compiled database of all recaptured cod included
information on release and recapture location, date and total length, as well as occasional infor-
mation on total weight, sex and maturity stage. A summary of the different tags used (Figure 3)
and tagging procedures regarding releases and recaptures for these data can be found in Mion
et al. (2020) and Mion et al. (in preparation). In total, there were 8622 records with clear infor-
mation on both release and recapture dates, length measurements and geographical position at
least at the ICES subdivision (SD) level (Figure 4). The length of recaptured cod ranged from
140 to 1100 mm (median: 440 mm) and the time between release and recapture (days at lib-
erty, DAL) ranged between 0 and 3928 days (median: 128 days). The return rate (i.e. the % of
tagged cod that were recaptured and returned to the research institutes) for the historical tag-
ging experiments were on average 11.8%.

For the CODYSSEY project, detailed information about tagging methodology can be found in
Neuenfeldt et al. (2007). From 2002 to 2006, 446 fish tagged with DSTs (Data Storage Tags)
have were released in the southern Baltic (SDs 24 and 25), and between 2003 and 2006, 234
cod recaptures were reported (Figure 4). The length of recaptured cod ranged from 450 mm to
985 mm (median: 524 mm) and DAL ranged between 1 and 607 days (median: 47 days).

Table 1. Overview of the historical tagging data and CODYSSEY data by release country and re-
lease period (n = number of cod). * Information about the total number of cod released by Finland
were not available for the period 1979-1984.
 Project Release country Release period Released cod (n) Recaptured cod (n)
 Historical data- Sweden 1955-1993 43343 4981
 base
 Poland 1957-1970 15183 2299
 Denmark 1957-1984 9824 1348
 Latvia 1958-1977 10552 762
 Germany 1959-1974 869 132
 Finland 1974-1984 6425* 621
 All 1955-1993 86196* 10143
 CODYSSEY Denmark 2003-2006 446 234

TABACOD Final Report 13
Figure 4. Overview of Baltic cod tagging data (fish releases for which there was a corresponding
recapture) available by year of release and subdivision of release in percentage for the historical
(1955-1993) and CODYSSEY projects.

2.4 Conclusions
 • The available tag-recapture data of Baltic cod, collected over time by the states border-
 ing the Baltic Sea during national tagging experiments, were digitized, quality-screened
 and collated for the first time in a unique dataset.
 • These data can be used to estimate time series of growth of the eastern Baltic cod
 stock using length based methods and to estimate movement rates between areas.

14 TABACOD Final Report
3. WP 2: New tagging program

3.1 Introduction
Tagging is a widely used approach to measure the growth of fish. In tag-recapture studies, indi-
viduals in a natural population are marked with external, easily identifiable tags, returned to the
wild, and a subset of them are subsequently recaptured. Tag-recapture studies allow individual
growth of wild fish to be directly measured, and can therefore be a useful approach when age
estimation is problematic (e.g. de Pontual et al., 2006). Tagging programs also have the poten-
tial to provide valuable information on the population size, total, natural and fishing mortality
rates (Pine et al., 2003) and movement patterns (Hilborn, 1990) of fish within a stock.

Combining conventional tagging with complementary methods can greatly increase the infor-
mation gained from each recaptured individual. Injecting fish with a calcium-binding chemical
such as tetracycline induces a permanent, visible mark on the otolith. Pairing external tagging of
wild fish with chemical marking allows otolith growth between release and recapture to be ex-
amined (Campana, 2001). Electronic tags, which can measure the temperature and depth expe-
rienced by the fish during its time at liberty, provide information about individual fish behavior
and environmental experience. A tag-recapture study therefore has the potential to provide the
urgently required information on contemporary growth rates and otolith formation of eastern Bal-
tic cod, as well as providing additional information about movement patterns, mortality rates,
fish behavior and environmental experience.

WP2 focuses on the design and implementation of a new tagging study for eastern Baltic cod,
and all associated tasks. To provide information representative of the eastern Baltic cod stock,
the tagging study should cover the main distribution area of the stock, and span several years,
to cover several cohorts and as large a part of the cod’s lifespan as possible. International coop-
eration and the application of a combination of tagging methods is key to ensuring the data col-
lected from the tagging study are as comprehensive as possible.

Although tag-recapture studies can provide valuable information about wild fish, there are some
methodological limitations and uncertainties that should be addressed to reduce bias in the
analysis of tagging data. The rate of tag-loss, short-term tagging-induced mortality, and the re-
porting rate (i.e. the number of recaptured cod which are actually recognized / returned) should
be estimated, to avoid under-estimation of the recapture rate. Shrinkage of fish following frozen
storage should also be estimated, to avoid under-estimation of growth rates. Within the tagging
program we therefore additionally carried out tag-loss, tagging-mortality and freezing shrinkage
experiments. An experiment to estimate reporting rates of recaptured cod on-board commercial
fishing vessels was also considered, but was deemed unfeasible due to the heterogeneity of the
Baltic cod fishery and assumed variability in reporting rate. Additionally, as the Baltic Sea is
home to two genetically distinct cod stocks with overlapping distributions, it was necessary to
assign recaptured cod to their stock of origin, so that data from the two cod stocks could be an-
alyzed separately.

TABACOD Final Report 15
Objectives
The main objective of WP2 was to design and carry out a cod tagging program in the southern
Baltic Sea.

Several additional aims were key to fulfilling this main objective:
 • Raise public awareness of the tagging program
 • Design, create and maintain a database of release and recapture data
 • Perform stock assignment of recaptured cod
 • Estimate tag-loss rates
 • Estimate freezing induced shrinkage
 • Estimate short-term tagging mortality rates

3.2 Methods
3.2.1 Tagging program
Prior to the initiation of the international tagging program, the project participants met in Rostock
in April 2016 to discuss and agree on the standardization of the national catch, handling, tag-
ging and release procedures. This involved practical exercises of (i) tagging live cod with T-bar
tags and tetracycline in the field (from Fehmarn Island, Germany), (ii) DST tagging with dead
fish in the laboratory, and (iii) demonstration of the use of a release cage. Based on these exer-
cises, manuals for both types of tagging were prepared and distributed among the countries
(see Appendix 2, Appendix 3). In addition, among other practical things, the group agreed upon
database templates for tagging and recapture data (kept in a cloud), the joint approaches for
public awareness (national activities and flyers in languages of all Baltic countries) and pay-
ments of rewards (recapture country processes the recapture and transfers the reward).

All countries prepared applications for official licenses for animal testing and submitted them to
the national authorities. All countries were granted permission to tag with T-bar tags, DSTs and
tetracycline, except Poland (only T-bar tagging was allowed). The tagging experiments were
conducted under the following animal test permissions: German T-bar tagging: AZ 7221.3.1-
029/15; German DST tagging: AZ 7221.3.1-007/18; Danish T-bar and DST tagging: 016-15-
0201-00929, Polish T-bar tagging: Permission no 19/2016, dated 28.06.2016, Swedish T-bar
and DST tagging: Dnr 5.8.18-14823/2018.

16 TABACOD Final Report
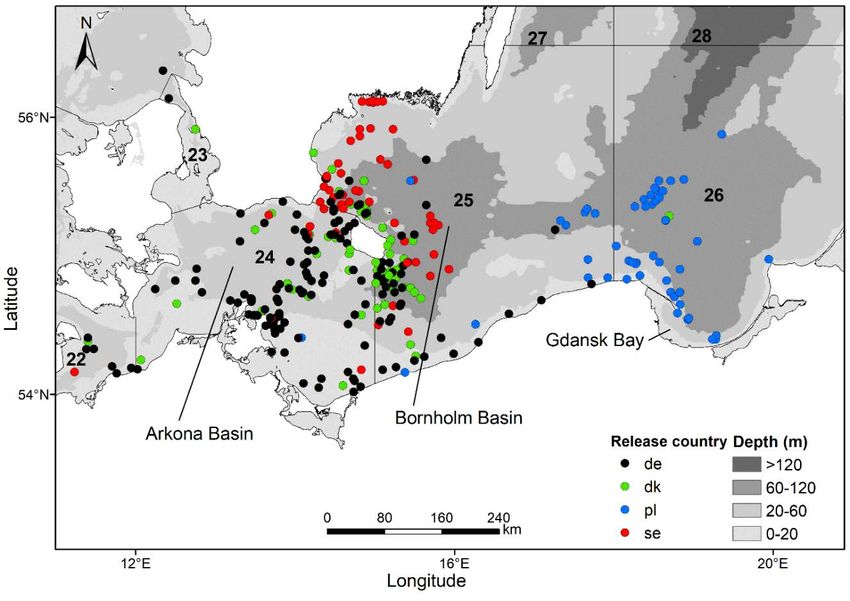
Table 2. Overview of number of cod tagged during the TABACOD project by country and year.
 Year Country Nr T-bar Nr DST
 Denmark 1410 50
 Germany 2073 0
 2016
 Poland 1464 0
 Sweden 1404 99
 Denmark 1466 344
 Germany 3083 0
 2017
 Poland 2171 0
 Sweden 2214 175
 Denmark 1857 227
 2018 Germany 2371 223
 Poland 1774 0
 Sweden 2352 142
 2019 Germany 417 0
 TOTAL 24089 1263

Tagging of Baltic cod was carried out at several locations across the Arkona, Bornholm and
Gdansk basins. Between March 2016 and May 2019, 25352 cod were tagged in Danish, Ger-
man, Polish and Swedish national waters in ICES subdivisions (SDs) 24-26 (Table 2, Figure 5),
covering the main, current distribution of the eastern Baltic cod stock (Eero et al., 2012; Orio et
al., 2019; ICES, 2019a).

Figure 5. Release positions of cod tagged through the TABACOD project, color-coded by country
of release (de= Germany, dk=Denmark, pl=Poland, se=Sweden). ICES subdivisions are numbered
and delimited by black lines.

TABACOD Final Report 17
The fish for this tagging program were mainly caught by short (5-30 minutes) bottom trawls from
research or commercial vessels. A subset (
Figure 7. Length frequencies of cod tagged per month (columns) by each of the four countries
(rows), with all data from 2016-2019 combined. Total number of cod tagged per month and country
is shown within each panel.

Figure 8. Distribution of tagging effort of each country across months (columns) and years (rows)
of the tagging program.

Fishers were paid a 20 Euro (140 DKK, 200 SEK) reward for returning a whole, recaptured cod
to one of the research institutes involved in the study. Double-tagged cod received a reward of
100 Euros (700 DKK, 1000 SEK). Fishers were requested to return the whole cod with the
tag(s), along with information on the recapture location, date, time and gear type. The tagging
study was advertised through the distribution of fliers to commercial fishers and angling shops,
in all Baltic Sea countries (e.g. Figure 9). The project was further advertised through posters
distributed to fishing associations, meetings with fishing organizations and dissemination via
fishery observers and a project web page (Figure 10). Newspaper articles, television and radio
reports were also produced throughout the project (see Appendix 1).

TABACOD Final Report 19
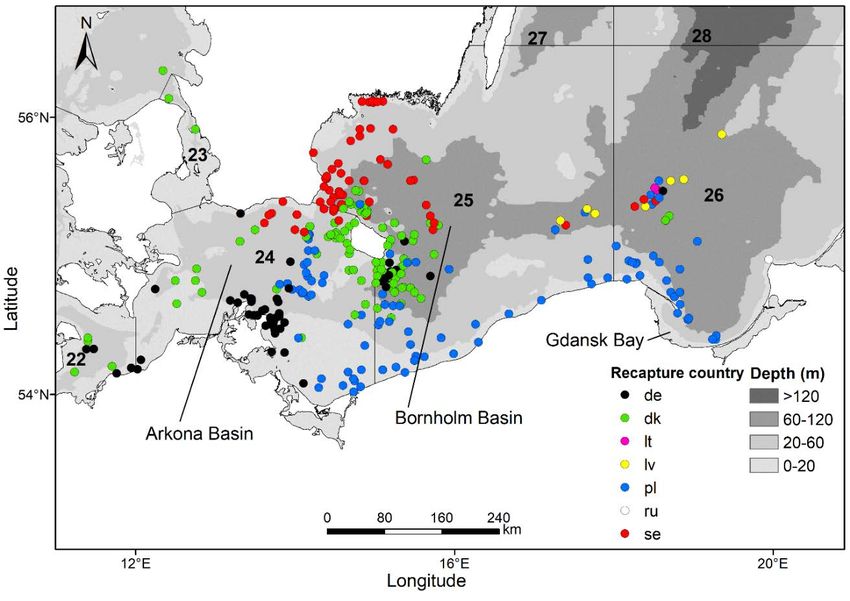
The majority of recaptures were stored frozen until they could be analyzed at a research insti-
tute. For each recapture, the following measurements and observations were recorded: length
(total and standard), weight (whole and gutted), sex, maturity stage, liver weight, gonad weight,
parasites, anomalies, stomach contents, and condition of injection and tagging area. Tissue
samples (from jaw, gill or muscle) were stored in 95% ethanol for genetic analysis. Otoliths were
removed, cleaned, and wrapped in tinfoil or stored in paper bags to avoid fading of the tetracy-
cline marks (Krumme and Bingel, 2016). Otoliths were later weighed, and silhouette photo-
graphs were taken for otolith shape analysis.

The release and recapture data were input to databases developed at the beginning of the pro-
ject. The database contained five tables: (i) a table with information about each tagged fish at
time of release; (ii) a table with information about each capture event for tagging; (iii) a recap-
ture table with biological information about recaptured individuals; (iv) a recapture source data-
base; and (v) a stomach contents database. Each country was responsible for maintaining and
quality checking their own national database. The combined international database was com-
piled and maintained at SLU in Sweden.

 Figure 9. Example of a flier
 used to advertise the TABA-
 COD tagging program. This
 flier was translated to all
 languages of countries with
 substantial fishery in the
 Baltic proper and distributed
 commercial fishers, tour
 boat operators, angling
 shops, first hand buyers and
 producer organizations
 (POs).

20 TABACOD Final Report
Figure 10. The TABACOD project homepage (www.tabacod.dtu.dk) contains information on how to
handle recaptured cod and will serve as a repository for project results.

TABACOD Final Report 21
3.2.2 Stock assignment of recaptures
Most recaptured cod were assigned genetically to their stock of origin. Tissue samples that
were collected during analysis of recaptured cod and stored in ethanol (95%) were genotyped
using 39 single nucleotide polymorphism markers, following the procedures described in Hem-
mer-Hansen et al. (2019).

Although genetic analysis is the most accurate method of stock assignment, it is relatively
costly, and can be time-consuming. In contrast, otolith shape analysis does not require special-
ized equipment, is less costly, and can quickly deliver stock assignment results. Otolith shape
analysis also has one of the highest classification accuracies of a non-molecular method of
stock assignment (83%, Schade et al., 2019). For these reasons, otolith shape analysis has
contributed to stock separation analyses for the Baltic cod stock assessments since 2019
(ICES, 2019b). Recaptured cod which could not be genetically assigned due to time constraints
or deterioration of the tissue sample were assigned to their stock of origin using the otolith
shape analysis method described in Schade et al. (2019).

3.2.3 Tag-loss experiment
To investigate whether tag-shedding was an issue in the tagging study, a subset of cod (n=696)
were tagged with two T-bar tags. Double-tagging experiments are a well-established method of
estimating tag-shedding rates in tag-recapture experiments (e.g. Wetherall, 1982). Double tag-
ging was spread evenly across seven of the tagging cruises conducted by the four countries in
2017.

3.2.4 Shrinkage experiment
The majority of recaptured fish were stored in a freezer before measurements could be taken.
As fish shrink following freezing (Halliday and Roscoe, 1969; Buchheister and Wilson, 2005;
Ogle, 2009), we conducted experiments to quantify the decrease in length and weight of Baltic
cod stored in a freezer for 1 month or 4 months (for full details, see McQueen et al., 2019a). In
brief, during the tagging cruises in 2017 and 2018, each country collected samples of cod of a
range of sizes (160-700 mm, n=925), weighed and measured them, and stored them in the
freezer. After the specified period in the freezer, the cod were thawed, and measurements were
repeated. The data were used to calculate conversion factors for estimating fresh length and
weight of cod from measurements taken from defrosted cod. The data were also used to ex-
plore variation in shrinkage between frozen storage time, region of capture, condition and size.

3.2.5 Short-term tagging mortality experiment
Short-term mortality experiments can be used to ensure that the tagging method has minimal
influence on the survival of the fish, and to determine the optimum gear type and season of tag-
ging (Brattey and Cadigan, 2004). Additionally, estimation of short-term tagging mortality rates
is key to avoiding bias when estimating population size and mortality rate from recapture rate
(Brownie and Robson, 1983).

During tagging cruises in 2017 we conducted nine containment studies using tagged and con-
trol fish (not tagged), to estimate the proportion of Baltic cod that die due to direct effects of the
tagging process (e.g. capture, handling and tagging). The studies were carried out from three

22 TABACOD Final Report
research vessels, in different regions of the southern Baltic, during different months (April, May,
June, September and November). Cod were captured by trawl, handled and tagged using the
same procedures applied throughout the tagging study, and were then transferred to cages with
the same number of non-tagged cod of roughly the same size. Depending on the size of the in-
dividuals, 3-16 cod were placed in each cage, to achieve a density in the cage of about 1 cod
per 0.05m3 (Brattey and Cadigan, 2004). In total, 340 cod with lengths ranging from 150 to 550
mm were included in the containment experiments. The cages were submerged to the seafloor,
at similar depths to the depth of capture (either 20 m, 40m or 50 m, depending on the capture
location). After 5-8 days, the cages were retrieved. Live cod were counted and released.

Total and adjusted mortality rates with associated standard errors (s.e.) were calculated after
Wilde (2002) with an adapted calculation for the sampling variance estimate (VAR) after Wel-
tersbach and Strehlow (2013). A generalized linear mixed effect model was fit to the data to in-
vestigate the effects of month, treatment, fish length, experiment length and tagging site on sur-
vival of individuals. Data analyses are ongoing, and final results will be published in a peer-re-
viewed journal article.

3.3 Results
3.3.1 Tagging program
In total, 383 cod from the TABACOD project were recaptured by April, 2020 (Table 3, Figure
12). The return rate of tagged cod from the TABACOD project was therefore 1.5%. The majority
of recaptures were returned by commercial fishers (89% of recaptures), with a smaller percent-
age recaptured by research vessels (5%) or recreational fishers (4%). For 2% of recaptures, the
recapture source was unknown. For 2% of recaptures, the recapture source was unknown. In-
formation on gear type was available for the majority (94%) of recaptures from the commercial
fisheries. 65% were recaptured by active gears (trawls), and 29% were recaptured by passive
gears (gillnets, pots, traps or hook and long lines). Time at liberty of recaptured cod ranged from
0 to 927 days (mean: 215.6 days, Figure 11).

TABACOD Final Report 23
Table 3. Number of recaptures by recapture country, tag type, and year.
 Year Country T-bar DST
 Germany 19 0
 Denmark 9 2
 2016
 Poland 5 (3) 0
 Sweden 3 (1) 1 (1)
 Germany 17 2
 Denmark 35 (1) 4 (1)
 2017
 Poland 33 (1)
 Sweden 12 (3) 3
 Germany 13 (2) 5 (1)
 Denmark 37 9 (2)
 2018
 Poland 55 (3) 6 (3)
 Sweden 27 (1) 3
 Germany 11 2
 Denmark 13 (1) 6 (1)
 2019
 Poland 13 2
 Sweden 7 2 (1)
 2020 Denmark 1 0
 Sweden 1

 TOTAL 326 58
() denote tags recovered at the processing factory after the fish had been processed, or recaptures for which the DST
was not returned

Figure 11. Time at liberty of recaptured cod.

24 TABACOD Final Report
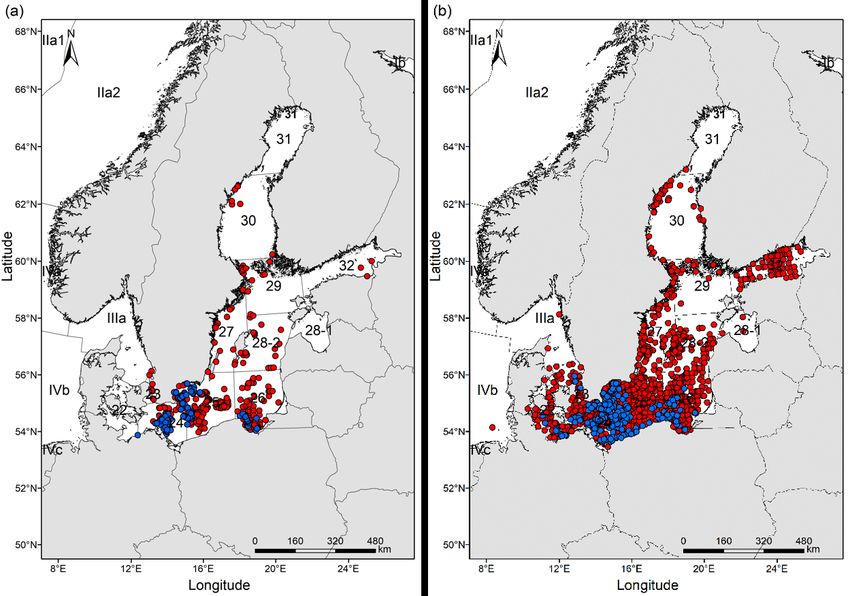
Figure 12. Recapture locations. Top: By recapture country. Bottom: By tagging country.

TABACOD Final Report 25
3.3.2 Stock assignment of recaptures
261 individuals were assigned to a stock through genetic analysis, and 70 individuals were as-
signed to a stock using otolith shape analysis. Additionally, 252 individuals already assigned to
a stock genetically, were also assigned to a stock using otolith shape analysis (Table 4). In to-
tal, 86% of stock assigned recaptures were assigned to the eastern Baltic stock, and 14% to the
western Baltic stock. A small proportion of western Baltic cod were detected in the recaptured
cod released from each subdivision, with the highest proportion observed in SD 24 (Figure 13).

Table 4. Percentage of recaptured cod assigned to the western or eastern Baltic cod stock, using
two methods. The total numbers of assigned individuals are reported in brackets.
 Assignment method Western Eastern
 Genetic 12% (n=31) 88% (n=230)
 Otolith shape 19% (n=60) 81% (n=262)

 Figure 13. Number of cod as-
 signed to the western and
 eastern Baltic cod stock,
 split by SD of release. Cod
 were assigned to stock of
 origin genetically (n=261), or
 using otolith shape analysis
 if genetic assignment was
 not available (n=70).

3.3.3 Tag-loss experiment
Thirteen of the 696 double-tagged cod were recaptured and reported. Time at liberty of recap-
tured, double-tagged cod ranged from 4 to 607 days (mean: 196 days). No tag losses were ob-
served, therefore we have no evidence of tag-shedding from this experiment.

3.3.4 Shrinkage experiment
Frozen and thawed Baltic cod shrank on average by 2.9% in length, and 2.7% in weight. There
was no relationship between fish size and percent shrinkage, and shrinkage did not differ signifi-
cantly between 1 and 4 months frozen storage. Shrinkage varied between region of capture,
and there was a negative relationship between condition of cod and shrinkage (McQueen et al.,
2019a).

26 TABACOD Final Report
The equations to back-calculate fresh (f) total length (TL) and weight (W) from thawed (t) and
thawed, gutted (tg) measurements of TL, W and standard length (SL) are:

 TLf = 1.02 (s.e. ±0.002) X TLt+2.08 (s.e. ±0.77)
 TLf = 1.11 (s.e. ±0.003) X SLt+5.48 (s.e. ± 0.89)
 TLf = 1.02 (s.e. ±0.002) X TLtg+1.82 (s.e. ± 0.70)
 TLf = 1.11 (s.e. ±0.003) X SLtg+5.22 (s.e. ±0.98)
 Wf=1.03 (s.e. ±0.002) X Wt-1.47 (s.e. ±0.78)
 Wf=1.24 (s.e. ±0.005) X Wtg-6.70 (s.e. ±1.98)

3.3.5 Short-term tagging mortality experiment
The total mortality of the experimental fish was 15.59% (s.e. ± 1.97). Mortality rate of the control
group was 12.74% (s.e. ±2.67) and of the tagged group 18.03% (s.e. ±2.85), which resulted in
an adjusted mortality rate for the tagged group of 5.29% (s.e. ±3.9). Fish length and tagging site
(representing the cumulative effects of tagging team and depth of capture) were the only varia-
bles to have a significant effect on mortality rate, with mortality rates decreasing as fish length
increased. As there was no significant effect of treatment on the mortality rate, it is assumed
 that the mortality can be at-
 tributed mainly to the capture
 and handling process, rather
 than the tagging procedure.
 Although month was not a
 significant predictor of mor-
 tality, the lowest survival
 rates were recorded for ex-
 periments conducted during
 summer (June and Septem-
 ber, Figure 14). Therefore,
 we tentatively conclude that
 carrying out tagging activities
 during the winter months,
 when temperatures are low
 and the water column is well-
Figure 14. Percentages of total mortality (white) and total survival mixed, should increase the
(grey) per month. Sample sizes are shown within the bars. likelihood of high survival
 rates.

3.4 Conclusions
 • We successfully conducted a large, coordinated, international tagging program, with
 >25000 cod tagged by four countries over four years in the southern Baltic Sea.
 • The data collected through the tagging program can be used to investigate growth
 rates, movement patterns, behavior, environmental experience and mortality rates of
 contemporary cod in the southern Baltic Sea.

TABACOD Final Report 27
• Stock assignment confirmed that the majority of recaptured cod were from the eastern
 Baltic cod stock. Due to stock mixing, especially in SD 24, a small proportion of recap-
 tured cod were assigned to the western Baltic cod stock.
 • We improved public awareness of the tagging project through reports and advertise-
 ments across various national and international media.
 • Tag-loss was not detected in this tagging study.
 • Freezing induced shrinkage of cod was significant, but unrelated to time spent frozen.
 The conversion factors calculated from the shrinkage experiment should be used to
 convert measurements from defrosted cod before growth analyses are conducted, to
 avoid under-estimation of growth rates.
 • Some short-term tagging mortality was detected, which should be accounted for in cal-
 culations based on tag-recapture rates. Short-term mortality was related to the capture
 and handling procedure, rather than the tagging process itself. Mortality rate decreased
 with increasing fish size.
 • The return rate of tagged cod from this project (1.5%) was lower than return rates from
 historic cod tagging studies in the Baltic Sea, but similar to recent return rates from tag-
 ging experiments on cod in the western Baltic Sea. The lower return rate is likely due in
 part to an unquantifiable percentage of recaptures that are not recognized or not re-
 ported. Possible reasons include the gutting machines onboard the larger vessels
 (which also have the largest catches) that increase the processing speed and reduce
 the handling of individual fish.

28 TABACOD Final Report
4. WP 3: Data analyses for stock assessment

The analysis and quantification of growth, mortality and movement patterns are essential for un-
derstanding the present biological situation of the eastern Baltic Sea cod and inform stock as-
sessment for a better fisheries management. This WP is divided into distinct and well defined
studies, whose description are organized below in different sub-sections with own introduction
and methods, results and conclusions.

Objectives
 • The objective of WP3 was to use the data from WP1 and WP2 to:
 • Develop and apply growth models to estimate changes in cod growth rates and imple-
 ment them in analytical stock assessment models
 • Provide fisheries-independent estimates of current mortality based on the new TABA-
 COD tagging program
 • Analyze the large-scale and small-scale horizontal and vertical movements of cod, in-
 cluding mixing between management areas.

4.1 Time series of growth
4.1.1 Introduction and Methods
Long time-series of reliable growth estimates are crucial for understanding the present and past
status of a fish stock, and to derive appropriate fisheries management actions. In particular, var-
iation in growth can have substantial consequences for populations, since it affects survival, age
at sexual maturity, reproductive success and movement, modulating the response of popula-
tions to environmental changes and anthropogenic pressure, including fisheries (Peters, 1983;
Dortel et al., 2014).

During the last two decades, the eastern Baltic cod (Gadus morhua) stock has suffered a num-
ber of biological changes including a drastic decrease in mean individual size and disappear-
ance of larger individuals. Currently, it is unknown whether this is due to a decrease in individual
growth rates or increased mortality of larger fish, because of the increasing difficulty in age de-
termination, with implications for stock assessment and fisheries management.

Tag-recapture experiments represent one of the most reliable method to estimate growth when
age determination based on otolith reading is uncertain, as is the case of the eastern Baltic cod
stock. Within this working package data obtained in WP1 and WP2 have been applied to two
length-based methods in order to estimate growth: I) the GROTAG model (based on the von
Bertalanffy growth function; Francis, 1988), and II) Generalized Additive Model, which does not
assume any a priori growth function (see Mion et al., 2020 and Mion et al., in preparation for full
details).

Before undertaking growth analyses, data underwent a cleaning and filtering process (see Mion
et al., 2020 and Mion et al., in preparation, for details). In an attempt to reduce the inclusion of

TABACOD Final Report 29
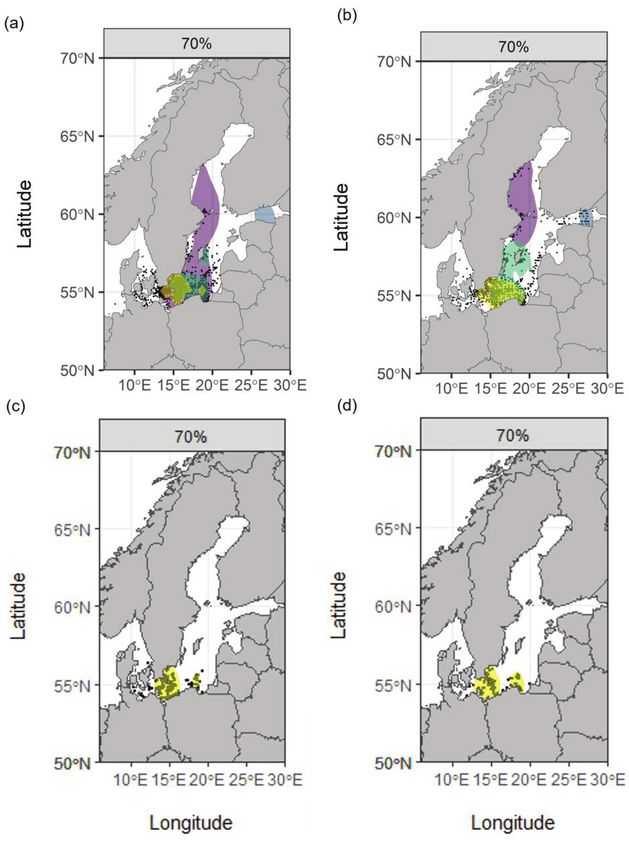
western Baltic cod individuals (inhabiting the SDs 22-24) in the growth analyses of eastern Bal-
tic cod (inhabiting the SDs 25-32) two methods have been used for stock identification: (i) for
the historical and CODYSSEY data (WP1), no information on the stock of origin was available
and thus a regional assignment was used (Mion et al., 2020), where only fish which were both
released and recaptured within the boundaries of the eastern Baltic cod management area (SDs
25-32) were used. (ii) For the recent tagging data (WP2) the recaptures were assigned to stock
of origin using otolith shape (Schade et al., 2019) and genetic (Hemmer-Hansen et al., 2019)
methods. Fish with unrealistically high growth rates and extreme negative growth values (i.e. re-
capture length
You can also read