Quarterly Global Outlook Q2 2019 It's All About Trade! - UOB
←
→
Page content transcription
If your browser does not render page correctly, please read the page content below

Quarterly Global Outlook Q2 2019 It's All About Trade!

CONTENT
                          04
              EXECUTIVE SUMMARY                                        CHINA � 32
                It's All About Trade!
                                                                   HONG KONG � 33
                     10                                                INDIA � 34
FX, INTEREST RATE & COMMODITIES FORECASTS
                                                                    INDONESIA � 35

                         11                                            JAPAN � 37
             SINGAPORE FOCUS I
             MAS April 2019 Preview:                                MALAYSIA � 38
    Monetary Policy Is Likely To Stay Pat In April
                                                                    MYANMAR � 39

                      14                                           PHILIPPINES � 40
             SINGAPORE FOCUS II
   Singapore Budget 2019: Mildly Expansionary                      SINGAPORE � 41
        With A Focus On Social Measures
                                                                  SOUTH KOREA � 42

                         15                                           TAIWAN � 43
                   CHINA FOCUS
 Opportunities From Guangdong-Hong Kong-Macao                       THAILAND � 44
                  Greater Bay Area
                                                                     VIETNAM � 45

                       23
                 FX STRATEGY                                        AUSTRALIA � 46
        USD Increasingly On Shaky Ground
        As FED Signals End To Hiking Cycle                          EUROZONE � 47

                                                                  NEW ZEALAND � 48
                      26
              RATES STRATEGY                                    UNITED KINGDOM � 49
 A More Nuanced Path Ahead For Singapore Rates
                                                           UNITED STATES OF AMERICA � 50

                         28
           COMMODITIES STRATEGY                                  FX TECHNICALS � 51
         Gold Is Best Poised To Strengthen
        As FED Signals End To Hiking Cycle                 COMMODITIES TECHNICALS � 56

                                                               Information as of 22 March 2019

                                                              GlobalEcoMktResearch@UOBgroup.com
                                                                     www.uob.com.sg/research
                                                                        Bloomberg: UOBR
          Scan the QR Code for a list of all our reports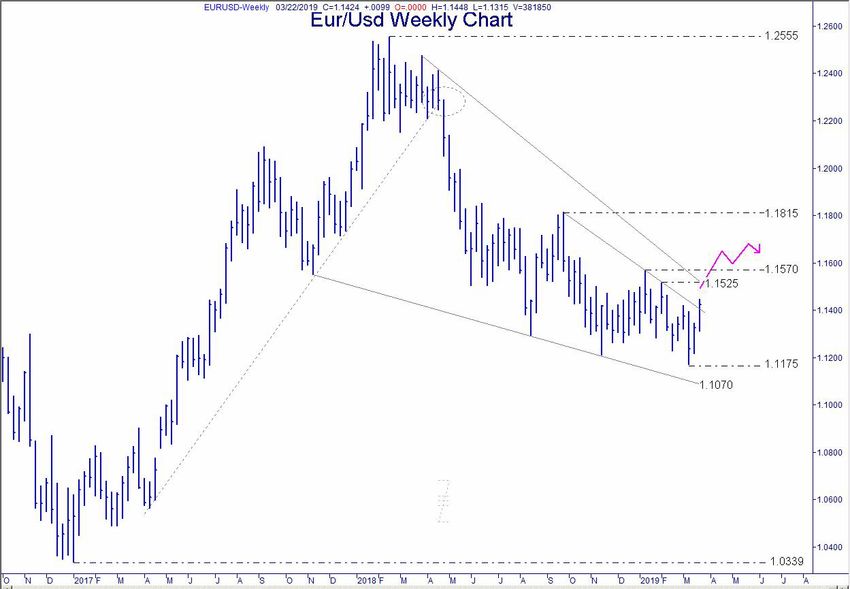
EXECUTIVE SUMMARY
                                                                      It's All About Trade!

                                             China Leads Asian Export Contraction As US-China Trade War Drags On

                Source: Bloomberg, UOB Global Economics & Markets Research

                 50

                 40

                 30

                 20

                 10

                  0

                -10

                -20

                -30
                      Mar 16        Jul 16         Nov 16               Apr 17        Aug 17       Dec 17     May 18         Sep 18           Jan 19
                               Malaysia Export Growth                            Thailand Export Growth                Taiwan Export Growth
                               South Korea Export Growth                         Singapore NODX Growth                 China Export Growth

     Last March, exactly a year ago, US                        As China’s growth and activity slowed           Finally,    the     global   “synchronized”
     President Donald Trump announced his                      down, Asia’s export contraction intensified.    slowdown across China, Asia and Europe
     plans to start imposing tariffs on Chinese                Asian central banks (except the PBoC),          appears to have started to boomerang
     goods to reduce the ballooning US trade                   which had tightened monetary policy en-         back to the US. Various macroeconomic
     deficit with China, effectively triggering                mass last year, are now forced to consider      figures like retail sales, payrolls and PMI
     the start of the US-China trade war.                      unwinding the untimely rate hikes. Going        have turned more volatile for the US. The
     By last August, both the US and China                     forward, we see Bangko Sentral ng               US Federal Reserve’s (FED) has clearly
     had imposed mutual tariffs on USD 50                      Pilipinas (BSP), Bank Negara Malaysia           turned dovish as they dropped the dot
     bn of exports to each other. Since then,                  (BNM), Bank Indonesia (BI) and Reserve          plot. In addition, the FED also guided that
     President Trump’s threat on imposing a                    Bank of India (RBI) leading rate cuts           they are looking to stop Balance Sheet
     higher 25% tariffs (from the existing 10%)                across Asia. The Monetary Authority of          Reduction (BSR) by Sep this year. Bottom
     on USD 200 bn block of Chinese exports                    Singapore (MAS) is also now seen staying        line, we no longer expect any more rate
     did not materialize, but damage is clearly                on hold in April.                               hikes from the FED in this cycle.
     done to global trade and growth.
                                                               Outside of China, Germany narrowly              However, lest one gets overly pessimistic;
     Needless to say, China bore the brunt of the              escaped a technical recession in late 2018      it is worth noting that the trade contraction
     export contraction as the US-China trade                  but Italy unfortunately did not escape that     induced global growth moderation has
     war exacerbated the on-going slowdown.                    outcome. The Eurozone is China’s largest        clearly intensified. But it is important to
     China conceded to a lower growth target                   trading partner and an accelerated growth       note that this growth moderation is still
     range of “about 6.0% to 6.5%” for this year,              slowdown in China will weigh on Eurozone        a far cry from the very severe global
     compared to “around 6.5%” for last year.                  growth prospects. As such, the European         recession during the 2008/09 Global
     Alongside the downgrade in growth target,                 Central Bank (ECB) not only lowered its         Financial Crisis.
     China has also announced broad fiscal                     2019 Eurozone growth forecast from
     stimulus, including a larger-than-expected                1.7% to 1.1%, but also signaled that it
     VAT cut, widening the budget deficit to                   will keep policy rate unchanged till early
     2.8% of GDP (from 2.6% in 2018). From                     next year. To ease funding pains, the ECB
     6.6% last year, we see China GDP growth                   announced yet a third tranche of Targeted
     falling to 6.3% this year.                                Long Term Refinancing Operation (TLTRO
                                                               III).

      Quarterly Global Outlook 2Q2019
04    UOB Global Economics & Markets Research                                                                                         EXECUTIVE SUMMARY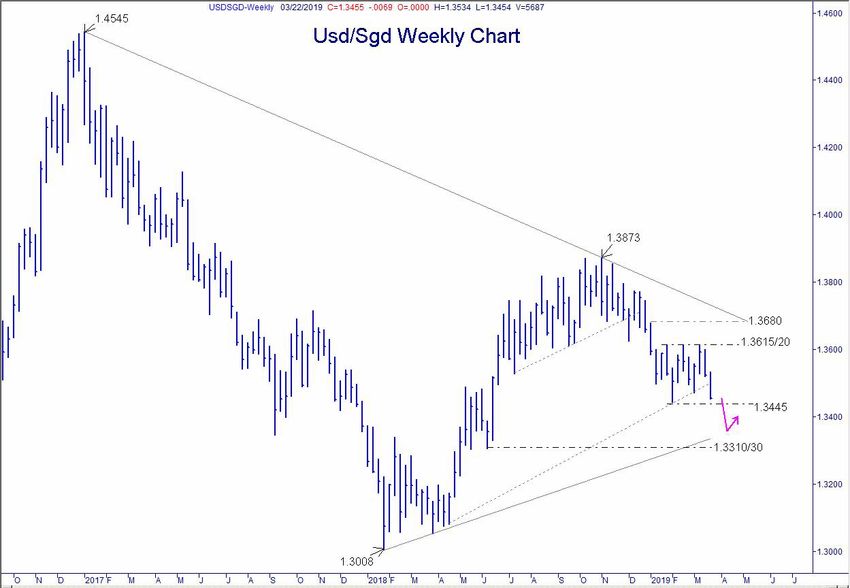
Rates Strategy                                 Over the near term, the PHP, IDR and              Singapore Focus I
A More Nuanced Path Ahead                      INR are still at risk alongside the CNY and       MAS April 2019 Preview:
For Singapore Rates                            KRW. While the MYR, THB and TWD can               Monetary Policy Is Likely
Given that we no longer see any more FED       count more on their strong current account        To Stay Pat In April
rate hikes going forward, Fed Fund Rates       surpluses. Meanwhile, the expected MAS            We expect the MAS to keep monetary
will top out at 2.5% in this cycle. As such,   April pause supports our view of mild             policy parameters unchanged in their
3M US Libor is seen hovering around            SGD weakness. Finally, VND is the outlier         upcoming April 2019 meeting. This means
current level of 2.65% until end 2019.         whose outlook has clearly improved. USD/          keeping the appreciation slope, width
                                               VND spot appears to be stabilizing around         and center unchanged. We view current
Needless to say, the impact of US Libor        23,200 as Vietnam is positioned to benefit        monetary policy to be appropriate despite
on local rates will be lesser now that the     from the manufacturing capital outflow            recent economic softness, given that core
FED’s hiking cycle is coming to an end.        away from China.                                  inflation pressures will likely persist into
Particularly for Singapore, the currency                                                         2H19. We view core inflation to cross its
factor, as well as domestic funding            _________________________________                 2.0% handle as early as July 2019.
dynamics now comes into play to better
support SG rates. Overall, we see both 3M      Commodities Strategy                              _________________________________
SOR and Sibor continuing their gradual         Gold Is Best Poised To Strengthen
rise from around 1.95% now to 2.10% by         As FED Signals                                    Singapore Focus II
end 2019.                                      End To Hiking Cyclee                              Singapore Budget 2019:
                                               Amongst the major commodities, we                 Mildly Expansionary With
_________________________________              believe that gold is set to rally further as we   A Focus On Social Measures
                                               reach the end of the FED’s current hiking         We observe that the budget is mildly
FX Strategy                                    cycle. In addition, the return of net long        expansionary with a focus on social
USD Increasingly On Shaky Ground               position and possible renewed allocation          measures. Into FY2019, Singapore’s
As FED Signals End To Hiking Cycle             of China’s reserves into gold are further         overall budget balance is projected to see
In the previous quarterly report, we warned    positive drivers. Overall, we turn positive       a deficit of $3.5 billion, or 0.7% of GDP.
that cracks have started to appear in the      on gold from neutral and now expect gold          Ministries’ total expenditures are expected
strong USD amour. The latest dovish            to rally further from USD 1,300 / oz now to       to be 1.6% higher at $80.3 billion, while
FOMC has cemented this turn in USD             rise towards the USD 1,450 / oz level by          operating revenue is estimated at $74.9bn
lower. However, this retreat in the USD is     the end of the year.                              (+1.7% higher vs FY2018). We view
not expected to be a straight line down, but                                                     the budget’s thrusts and social policies
may be a choppy affair.                        With regards to Brent crude oil, the on-          continue to suggest the government’s
                                               going disciplined supply cut from OPEC            pre-emptive nature in addressing long-
Specifically,    because     of     growth     and Russia is able to help offset concerns        term challenges of ageing, social mobility,
moderation, expectations for rate hikes        of global growth slowdown. The further            inequality,    economic      transformation,
for both the ECB and RBA have now              loss of production in Iran and Venezuela          and climate change, while reinforcing its
been pushed back from late 2019 to next        is also another supportive factor.                role as a market-enabler in supporting
year in 2020. As such, while we remain         Consequently, Brent is likely to drift higher     Singapore’s business environment.
confident that both the EUR and AUD are        towards the top end of its USD 65 to 75 /
in the process of bottoming, we have to        bbl trading range as well as maintain its         _________________________________
acknowledge the weaker growth outlook          mild backwardation.
will limit the immediate gains in the EUR                                                        China Focus
and AUD.                                       As for LME Copper, given the increasing           Opportunities From Guangdong-
                                               global moderation in growth, it is                Hong Kong-Macao
In Asia, central banks are now seen            premature to expect further strength.             Greater Bay Area
paring back some of the untimely rate          In fact, recent Copper strength in 1Q19           On 18 February 2019, China unveiled
hikes from last year, as further export        may not be sustainable given slowdown             the outline plan for the Guangdong-Hong
contraction, growth slowdown and weaker        in PMI as well as export contraction. The         Kong-Macao Greater Bay Area (GBA) to
inflation trajectory start to bite. As such,   prevailing cash premium may also be a             be developed into a vibrant world-class
Asian currencies are not yet able to take      temporary side effect of China’s tightening       cluster and amongst others, a globally
advantage of the tapering off of FED rate      of scrap import requirements. Industrial          influential international innovation and
hikes. Furthermore, investors are likely to    demand for copper may also ease in the            technology hub.
remain cautious and stay sidelined ahead       near term due to downward pressure on
of the key elections in Thailand, Indonesia    the electronics and automobile sectors.           Physical connectivity is enhanced with the
and India. In short, it will still take some   Thus, we maintain our existing neutral            opening of the 55 km Hong Kong-Zhuhai-
time before Asian currencies benefit from      forecast of LME Copper for USD 6,000 to           Macao Bridge (HZMB) in October 2018 and
the dovish FED and turn higher.                7,000 / MT.                                       the final 26 km phase Hong Kong section
                                                                                                 of the Guangzhou-Shenzhen-Hong Kong
                                               Hereafter is a brief synopsis of key Focus        Express Rail Link (XRL) in September
                                               pieces as well as key FX and Rates views.         2018. Further projects completion will

                                                                                                                Quarterly Global Outlook 2Q2019
EXECUTIVE SUMMARY                                                                                      UOB Global Economics & Markets Research    05
facilitate people, goods, services, capital    still expected to hike rates next year. Also,   come to a successful trade agreement.
     and information flows.                         in the context of a Euro-area slowdown          However, in view of the negative economic
                                                    (rather than a recession) one may find it       fundamentals, we prefer to stay cautious
     The economies of Guangdong, Hong               hard to argue for a crisis-era EUR/USD          on the CNY until we can assess the merits
     Kong and Macao are significantly different     below 1.10. Market-based indicators             of the upcoming US-China trade deal.
     from one another and this allows value to      such as the interest rate differentials and     For now, we maintain our USD/CNY point
     be created by leveraging on their diverse      risk reversals continue to point to further     forecasts for 6.70 in 2Q19, 6.75 in 3Q19
     strengths. In addition, the generally more     stabilization in EUR/USD. Overall, we stay      and 6.80 in 4Q19 and 1Q20.
     mature economies of Hong Kong and              positive on EUR/USD with point forecasts
     Macao will set as benchmarks but also          at 1.15 in 2Q19 and 3Q19, 1.18 in 4Q19,         USD/SGD: Since the last policy meeting
     stand to gain from faster growth rate of its   and 1.20 in 1Q20. EUR/USD remains our           last October, the S$NEER continued
     mainland peers in the combined entity of       conviction trade in the G-10 space.             to persist within the stronger half of the
     GBA.                                                                                           policy band, averaging +1.5% above the
                                                    GBP/USD: Even with an immediate                 policy midpoint, in part due to markets’
     Comparing to other “Bay Areas” around          cliff-edge Brexit is averted on 29-Mar, it      expectations of further tightening from
     the world, there is much potential for GBA     remains uncertain whether Theresa May           MAS come April. So, if MAS stays on
     given the specializations of various cities    can get her deal approved within the            hold this time round, this will limit further
     within GBA and the tightened connectivity      2-week extension. GBP/USD is likely to          S$NEER strength going forward. Overall,
     will help to further synergize these cities’   stay volatile and sensitive to headlines.       our expectation of MAS staying on hold
     capabilities.                                  Overall, we stay cautious on the GBP until      in April reinforces the existing higher
                                                    the uncertainty of the Brexit fog clears.       trajectory in USD/SGD, in line with
     As the GBA will remain at the planning         In terms of point forecasts, we see GBP/        gradual CNY weakness as well. However,
     stage in the immediate period with             USD at 1.28 in 2Q19, 1.30 in 3Q19, 1.30         with latest dovishness from the FED, we
     focus on improving integration, there          in 4Q19 and 1.32 in 1Q20.                       moderate the point forecasts lower, now
     will be substantial leeway given to local                                                      expecting USD/SGD to finish the year at
     governments over how they will pursue          AUD/USD: The AUD/USD was resilient              1.37 from 1.38 previously.
     these goals. We think the vague targets        in 1Q19 – having snapped back from a
     are in recognition of the challenges in        “flash crash” in early January and endured      USD/HKD: Once again, the HKD has
     integrating the region which covers three      a dramatic shift in RBA from hawkish to         fallen to the weak side convertibility limit of
     different customs, legal systems and           neutral in February. Going forward, we          7.85 against the USD. As of early March,
     currencies.                                    reiterate a higher trajectory in AUD/USD.       the HKMA has resumed intervention yet
                                                    A dovish Fed lightens the pressure on           again to limit HKD weakness at 7.85. It is
     _________________________________              the AUD/USD as the wide interest rate           likely that the HKMA will need to continue
                                                    differential between Australia and US           its intervention and drive 3M HKD Hibor
     GLOBAL FX                                      may start to abate or even reverse. The         higher. Overall, we can expect USD/HKD
     USD/JPY: With an overall more risk-            key positive trigger for further upside in      to drift back down towards 7.80 once the
     conducive environment spurred by               the AUD/USD remains that of a US-China          Libor-Hibor gap has narrowed sufficiently.
     positive momentum behind US-China              trade agreement which looks increasingly        Our point forecasts for USD/HKD are 7.85
     trade talks and a very “patient” Fed, USD/     likely in 2H19 in our view. Our point           in 2Q19, and 7.80 in 3Q19, 4Q19 and
     JPY has recovered over 6% from the             forecasts are now at 0.72 in 2Q19, 0.72         1Q20.
     lows of 104.87 during its “flash crash”        in 3Q19, 0.73 in 4Q19, and 0.74 in 1Q20.
     in early Jan. A potential US-China trade                                                       USD/TWD: The TWD has been very
     agreement in 2Q19 could bolster risk-          NZD/USD: Going forward, we expect the           stable in 2019. Year-to-date, USD/TWD
     taking sentiments further, taking USD/         up move in NZD/USD to continue. The             has been confined in a narrow 20 pips
     JPY above 112. Domestically, amidst a          latest dovish shift in Fed would likely be      range between 30.70 and 30.90 against
     weak growth coupled with low inflation         a tailwind for the currency pair, supporting    the USD. Going forward, with subdued
     outlook, it is likely the BOJ will reassert    NZD higher. We reiterate our previous set       domestic inflation and weaker growth
     its dovish monetary policy bias across         of forecasts and expect NZD/USD at 0.69         outlook, we factor in mild weakness of
     2019. Even as the Fed has signaled a           in 2Q19, 0.70 in 3Q19, 0.71 in 4Q19, and        TWD against the USD. Our point forecasts
     potential end to the current hiking cycle,     0.72 in 1Q20.                                   are now at 31.00 in 2Q19, 31.20 in 3Q19,
     the still wide rate differential between US                                                    and 31.30 in both 4Q19 and 1Q20.
     and Japan (255bps in the 10-year) would
     likely be supportive for USD/JPY. Taken        ASIAN FX                                        USD/KRW: A peaking in the global
     together, we reiterate our gradual upwards     USD/CNY: By now it is abundantly clear          electronics cycle has taken its toll on
     trajectory in USD/JPY.                         that the economic slowdown in China             the KRW. Year-to-date, the KRW is the
                                                    has intensified. However, the CNY had           weakest Asian currency and has dropped
     EUR/USD: The FED has handed the                in fact strengthened across 1Q19. This          1% against the USD, at 1,125 per USD.
     monetary policy baton to the ECB as the        contrarian strength in the CNY might            The lack of progress in the second US-
     FED has probably reached its peak in the       be due to positive expectations that            North Korea Summit in late February
     current interest rate cycle while the ECB is   the US-China trade talks will eventually        was also a dampener on sentiments.

      Quarterly Global Outlook 2Q2019
06    UOB Global Economics & Markets Research                                                                         EXECUTIVE SUMMARY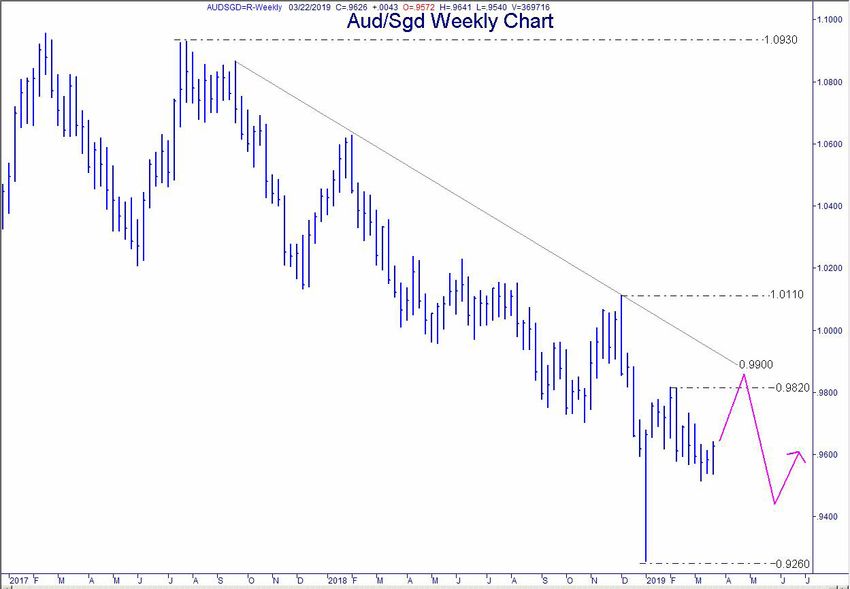
In addition, the KRW is not expected           against further THB strength, which may       think INR may face pressure from further
to receive any near-term support from          dent Thai export competitiveness. Officials   rate cuts from RBI, higher oil prices and
the BOK, which is likely to stay on hold       are also likely to defer any potential rate   uncertainties from the upcoming elections,
throughout 2019. If anything, markets see      hike to 3Q, to allow for more time for the    though part of the expected weakness is
a growing case of a rate cut although BOK      economy to adjust to the uncertain trade      offset by a dovish Fed. As such, we expect
has pushed back against that. In view of       outlook. Overall, we still reiterate our      INR to pare some of its recent gains. Our
moderating domestic fundamentals, we           modestly higher view of USD/THB. Our          point forecasts are now at 68.80 in 2Q19,
still maintain our view for a higher USD/      point forecasts for USD/THB are 31.80 by      69.20 in 3Q19, and 69.50 in both 4Q19
KRW for the next few quarters but the          end-2Q19, 31.90 by end-3Q19, and 32.00        and 1Q20.
trajectory is now shallower than before as     for end-4Q and 1Q20.
the Fed has signaled the end of its rate                                                     _________________________________
hike cycle. The USD/KRW point forecasts        USD/PHP: Given that the central bank is
are now at 1,130 in 2Q19, 1,140 in 3Q19,       likely to focus on stimulating economic       GLOBAL INTEREST RATES
and 1,145 in both 4Q19 and 1Q20.               growth, we expect as much as 50bps of         FOMC: The FOMC kept its policy Fed
                                               rate cut, in the next two quarters (25bp      Funds Target Rate (FFTR) unchanged at
USD/MYR: We keep to the view of a firmer       each in 2Q and 3Q). As such, the rate cuts,   the 2.25%-2.50% range in Mar (2019), as
USD/MYR but adjust our USD/MYR point           together with the persistent twin deficits    widely expected but the big surprise was
forecasts lower to 4.06 in 2Q19, 4.08          are likely put pressure on the PHP. We        that the updated Mar 2019 dot-plot chart
in 3Q19, and 4.11 in 4Q19 and 1Q20             update our view of a higher USD/PHP to        showed a dramatically lowered rate hike
(Previous point forecasts were 4.10, 4.15      53.0 in 2Q19, 53.5 in 3Q19 and 4Q19 and       trajectory which indicates that the Fed
and 4.18 respectively). Prevailing spot        54.0 in 1Q20. Prevailing spot reference       will not hike rates in 2019 (from 2 hikes
reference rate is 4.06. This takes into        rate is 52.8.                                 previously) and the Fed also announced
consideration the strong start for Asian                                                     its intention to taper its balance sheet
FX to date, potential upside if a US-China     USD/VND: Despite positive momentum in         reduction (BSR) program from May 2019
deal is struck, and domestic support           US-China trade talks in the 1Q19, the VND     and to conclude the BSR at the end of Sep
factors including current account surplus      did not track other Asia FX gains against     2019. With the FOMC literally doubling
and stable flows.                              the USD. Instead, the USD/VND pair            down on their patience approach, we have
                                               remains in a small range around 23,200.       revised our expectations and we now think
USD/IDR: Indonesia’s GDP has not               Going forward, we still expect USD/VND to     the Fed is done with the current rate hike
recovered on a sustainable basis. Amidst       track other USD/Asians higher. However,       cycle, i.e. no more hikes in 2019. And with
the increasing external sector uncertainty     the weakness in the VND is likely to          a mild US technical recession potentially
from the US-China trade war, export            be cushioned by Vietnam’s favorable           rearing its head in 2020, we expect the
contraction has resumed and current            macroeconomic performance. This is            Fed to CUT policy rate by a nominal 25bps
account deficit has widened yet again. As      especially so when Vietnam is expected        in 3Q 2020 and will leave the door open to
such, we see renewed rate cuts from BI,        to be a key beneficiary of manufacturing      do more if the slowdown is exacerbated.
effectively unwinding some of rate hikes       capital reallocation away from China.         A major caveat to this projection is that
from last year’s cycle. Renewed rate cuts      As such we reiterate a modestly higher        US inflation stays in check (around 2%)
from BI will reduce the yield support for      USD/VND trajectory, with point forecasts      despite robust wage growth since Oct
the IDR. As Indonesia has both a fiscal        at 23,300 in 2Q19, 23,400 in 3Q19, and        2018.
and current account deficit, this will make    23,500 in 4Q19 and 1Q20.
the IDR vulnerable to renewed weakness.                                                      ECB: The ECB kept interest rates
However, the upcoming rate cuts may also       USD/MMK: After a 18% depreciation             unchanged at the March meeting, but
be viewed positively from the investment       against the USD between last April and        updated its forward guidance for a rate
community as being positive for growth,        October, the MMK has since stabilized         hike. It now expects its key interest rates
triggering renewed investor in-flows           and largely consolidated in a 1,500 to        “to remain at their present levels at least
thereby supporting the IDR. Overall, the       1,600 per USD range. Going forward,           through the end of 2019”. We did expect
expected weakness in IDR is partially          we still expect the MMK to remain under       a delayed rate hike to be flagged in due
offset by a dovish Fed. As such, we            pressure from a persistent current account    course, but definitely was not expecting
reiterate a modestly higher trajectory for     deficit which will widen from 5.3% of GDP     the ECB to formally change the date
USD/IDR. Our point forecasts for USD/          in 2018 to 5.7% in 2019 and 5.9% in 2020.     guidance as soon as the March meeting.
IDR are 14,100 for 2Q19, 14,200 for 3Q19       As such, USD/MMK is forecast to be at         We were previously looking for the ECB
and 14,300 for 4Q19 and 1Q20.                  1,530 in 2Q19, 1,540 in 3Q19, and 1,560       to hike rates later this year, but have now
                                               in 4Q19 and 1Q20.                             pushed back our rate hike call, seeing no
USD/THB: A resilient Thai economy                                                            move earlier than 2Q next year.
amidst trade headwinds, strong current         USD/INR: The INR has been on a roar in
account surplus together with the BoT          March, gaining from 71.00 to 68.80 per        BOE: Members of the BoE’s nine-strong
flagging further rate hikes added to           USD currently, a strong 3% move in three      MPC voted unanimously to leave rates
appreciation pressures on the THB in           weeks. Strong net inflows in local bond and   unchanged at 0.75% during the March
1Q19. Going forward, with exports growth       stock markets contributed to the strong       meeting. The asset purchase facility
moderating, authorities will be on the alert   currency performance. Going forward, we       remained steady at GBP435bn as well.

                                                                                                           Quarterly Global Outlook 2Q2019
EXECUTIVE SUMMARY                                                                                 UOB Global Economics & Markets Research    07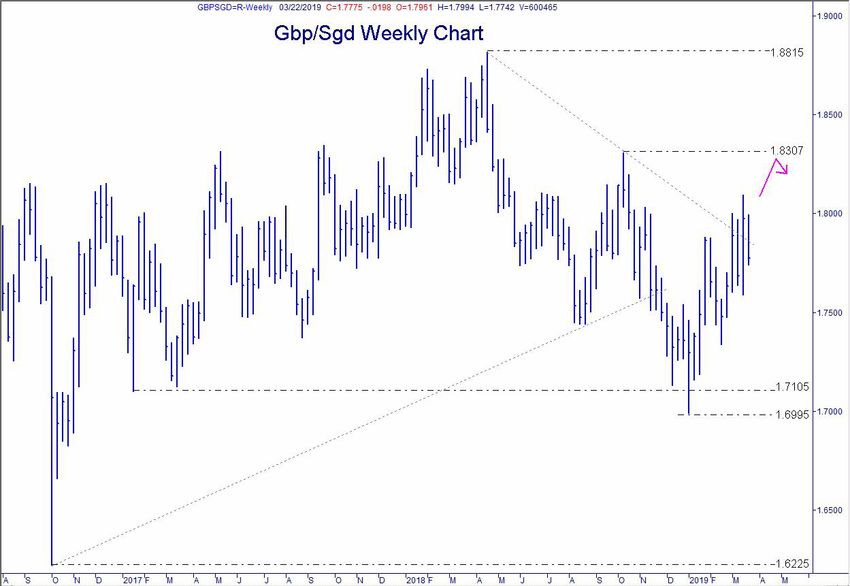
The BoE has suggested rates could go            BOJ may still need to do more “tweaks”         account deficit, which is partly addressed
     in either direction, given the varied Brexit    to monetary policy to reassert its easy        by keeping monetary policy stance not too
     outcomes. If the British Parliament passes      monetary policy position, just like what it    loose.
     Theresa May’s Brexit deal next week             did in the July 2018 MPM.
     and there is a short technical extension                                                       BOK:       Despite     lower-than-expected
     to Article 50 to pass the necessary                                                            inflation, a rate cut does not appear
     legislation, the BoE could resume its           ASIAN INTEREST RATES                           imminent at this point unless the growth
     tightening cycle soon as data suggests a        PBoC: In line with policymakers’ target        and      employment      outlook    deviate
     hike is appropriate. If Brexit continues to     to boost bank lending to small/micro           significantly to the downside from our
     delay, a rate hike in the summer could be       and private companies, we maintain our         base case. The focus remains on using
     likely. After all, the MPC raised rates last    expectation that there could be another        fiscal tools to drive the growth outcome
     August, just eight months before Brexit.        two reserve requirement ratio (RRR)            rather than monetary policy. As such, we
     If, however, there is a no deal, the BoE        cuts this year, following the broad-based      maintain our expectation that the BOK will
     might have to cut rates as early as the next    100bps reduction in January and the 4          stay on hold throughout 2019.
     meeting on 2 May. But until we get more         “targeted” RRR cuts in 2018. The next
     clarity, the BoE is likely to stay firmly on    RRR reduction is likely to take place in       BNM: The US Fed’s ultra-dovish tone in
     the sidelines.                                  early-2Q19 given soft economic data so         the March FOMC statement, lends more
                                                     far. However, we see low probability of        flexibility for BNM to consider easing
     RBA: As widely expected, the RBA held           a PBoC rate cut in the next 3-6 months         rates in view of the external headwinds
     its OCR at 1.50% in March. The RBA has          given the proactive fiscal and monetary        and weaker domestic sentiment. We are
     reaffirmed its mounting concern over the        policy measures in place so far.               pencilling in a 25bps cut in the Overnight
     consumption outlook as households are                                                          Policy Rate (OPR) to 3.00% this year.
     besieged by falling property prices, weak       MAS: While we expect the MAS to keep
     income growth and high debt. Since the          its policy parameters unchanged in their       BOT: The Bank of Thailand (BOT) is
     weak GDP results, financial markets are         upcoming April 2019 meeting, we think          expected to hike the policy rate from
     pricing in a rate cut this year as a done-      that an eventual tightening is still on the    1.75% to 2% in 2H 2019. A rate pause
     deal. We still think that the most likely       cards. Should our call for the MAS to          would give the MPC more time to fully
     scenario is still for an unchanged policy       stay pat in April come to pass, a token        assess the situation. There is no urgency
     rate in 2019.                                   tightening into October will likely occur to   to tighten monetary policy aggressively,
                                                     address the rising price pressures, in line    whilst inflationary pressure is modest.
     RBNZ: The RBNZ kept the OCR steady              with MAS “primary objective of promoting       Current monetary conditions remain
     at 1.75% in February. Unlike the previous       medium term price stability”.                  accommodative and commensurate with
     statement in November 2018, the latest                                                         the needs of the Thai economy.
     accompanying press release included the         RBI: In response to address the falling
     line that “The direction of our next OCR        inflation environment, RBI cut its             BSP: Given the improving inflation
     move could be up or down.” in its opening       benchmark repo and reverse repo to             outlook, moderate growth prospects,
     paragraph. The concluding paragraph was         6.25% and 6.00% respectively in its Feb        and a new BSP Governor who is seen
     the same where “We will keep the OCR at         MPC meeting. We expect inflation is likely     as an advocate of growth, we expect the
     an expansionary level for a considerable        to stay benign and average 3.4% in 2019,       central bank to unwind some of last year’s
     period to contribute to maximising              hovering above 4.0% in 4Q19. Still, this       tightening as a pre-emptive move over
     sustainable employment, and maintaining         means that India’s inflation environment is    the next few months. We project a total of
     low and stable inflation.” We are retaining     likely to remain sub-4.0% for the first nine   50bps cut in interest rate toward year-end,
     our call for the RBNZ to be on hold at least    months, thus likely prompting the central      taking the overnight reverse repo rate to
     until early 2020.                               bank to inject one more 25bps cut to its       4.25% by end of 2019.
                                                     repo and reverse repo rate into 2019, most
     BOJ: Among the G10 central banks, BOJ           likely in either June or August.               SBV: The State Bank of Vietnam (SBV) is
     continues to be the least likely to normalize                                                  expected to maintain refinancing rate at
     its easy monetary policy anytime soon,          BI: BI is likely to keep interest rate         6.25% until Jun 2020. At the current policy
     and it remains premature for the BOJ to         unchanged until Q3 2019. Afterwards,           rate, the monetary policy stance remains
     talk about normalizing/tapering its easing      given stable inflation and a more stable       conducive to the continuation of economic
     program too, because Japan is still far         IDR, we see room for BI to normalize           growth. The strong growth eases pressure
     away from its 2% inflation target. The          its policy rate by a cumulative 50bps in       on the SBV to add more stimuli to achieve
     projected weaker growth environment and         Q4 2019. Real interest rate has been           2019 growth target of 6.7%.
     likelihood of downside price pressures in       relatively high and by reducing slightly the
     2019 adds further challenges to BOJ’s           rate hikes done in 2018, we believe this
     monetary policy. One persistent point           growth-supporting gesture is a welcome
     of contention that is unhelpful to BOJ’s        development by the markets. That said
     “fight” is the projected annual pace of         we do not foresee a full unwinding of
     JGB buying continues to be well below           the 175bps hikes in the last cycle given
     its official target of JPY80tn. We think the    the ongoing concern over the current

      Quarterly Global Outlook 2Q2019
08    UOB Global Economics & Markets Research                                                                       EXECUTIVE SUMMARY
Real GDP Growth Trajectory
      y/y% change                   2018         2019F         2020F     1Q18     2Q18     3Q18      4Q18   1Q19F     2Q19F     3Q19F     4Q19F

      China                          6.6           6.3           6.3      6.8      6.7      6.5      6.4     6.4       6.3        6.3       6.3

      Eurozone                       1.8           1.3           1.4      2.4      2.1      1.6      1.1     1.1       1.2        1.3       1.4

      Hong Kong                      3.0           2.2           2.3      4.6      3.5      2.8      1.3     1.6       2.0        2.5       2.8

      Indonesia                      5.2           5.2           5.4      5.1      5.3      5.2      5.2     5.1       5.3        5.2       5.2

      Japan                          0.8           0.5          -0.8      1.3      1.5      0.1      0.3     0.3       0.3        1.7       0.0

      Malaysia                       4.7           4.6           4.7      5.4      4.5      4.4      4.7     4.5       4.6        4.8       4.6

      Philippines                    6.2           6.2           6.5      6.6      6.2      6.0      6.1     5.9       5.9        6.2       6.5

      India                          7.0           7.0           7.2      8.1      8.0      7.0      6.6     6.5       7.1        7.2       7.9

      Singapore                      3.4           2.5           2.0      4.7      4.2      2.4      1.9     1.5       2.2        2.9       3.4

      South Korea                    2.7           2.5           2.5      2.8      2.8      2.0      3.1     2.6       2.5        2.4       2.4

      Taiwan                         2.6           2.2           2.3      3.2      3.3      2.4      1.8     2.0       2.1        2.3       2.5

      Thailand                       4.1           3.8           4.0      5.0      4.7      3.2      3.7     3.5       3.8        3.9       3.9

      US (q/q SAAR)                  2.9           2.0           1.3      2.2      4.2      3.4      2.6     1.2       2.0        1.2       0.9
      Note that India’s annual growth refers to its fiscal year print
      Source: CEIC, UOB Global Economics & Markets Research

                                                                                                                             Quarterly Global Outlook 2Q2019
EXECUTIVE SUMMARY                                                                                                   UOB Global Economics & Markets Research    09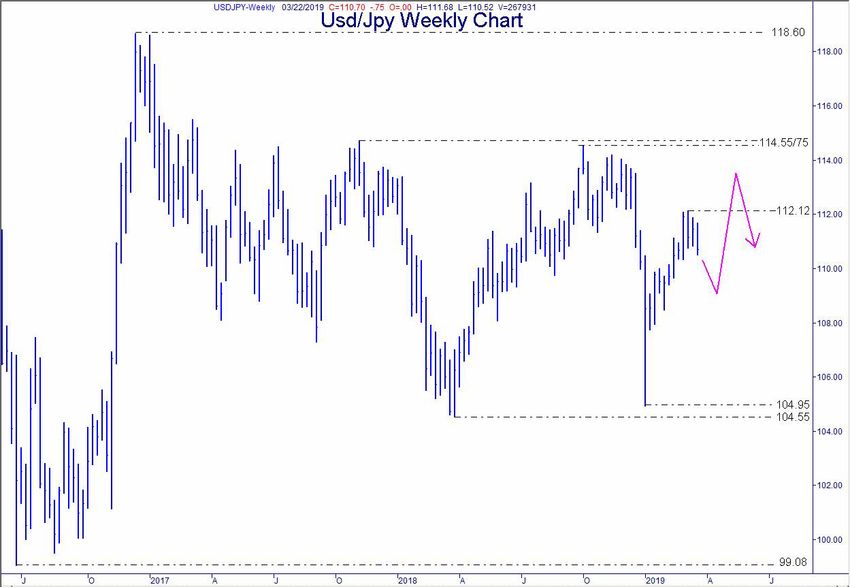
FX, INTEREST RATE & COMMODITIES FORECASTS

     FX              22 Mar 19 2Q19F 3Q19F 4Q19F 1Q20F            RATES                        22 Mar 19   2Q19F    3Q19F    4Q19F    1Q20F

     USD/JPY            111        111     112     113     113    US Fed Funds Rate              2.50      2.50     2.50     2.50     2.50

     EUR/USD            1.14      1.15     1.15   1.18    1.20    USD 3M LIBOR                   2.61      2.65     2.65     2.65     2.65

     GBP/USD            1.31      1.28     1.30   1.30    1.32    US 10Y Treasuries Yield        2.53      2.45     2.60     2.70     2.70

                                                                  JPY Policy Rate                -0.10     -0.10    -0.10    -0.10    -0.10
     AUD/USD            0.71      0.72     0.72   0.73    0.74
                                                                  EUR Refinancing Rate           0.00      0.00     0.00     0.00     0.00
     NZD/USD            0.69      0.69     0.70   0.71    0.72
                                                                  GBP Repo Rate                  0.75      0.75     0.75     0.75     0.75
     DXY                96.3      95.9     95.7   94.1    93.2
                                                                  AUD Official Cash Rate         1.50      1.50     1.50     1.50     1.50
     USD/CNY            6.70      6.70     6.75   6.80    6.80    NZD Official Cash Rate         1.75      1.75     1.75     1.75     1.75

     USD/HKD            7.85      7.85     7.80   7.80    7.80
                                                                  CNY 1Y Benchmark Lending       4.35      4.35     4.35     4.35     4.35
     USD/TWD           30.81     31.00    31.20   31.30   31.30   HKD Base Rate                  2.75      2.75     2.75     2.75     2.75
     USD/KRW           1,130     1,130    1,140   1,145   1,145   TWD Official Discount Rate     1.38      1.38     1.38     1.38     1.38

     USD/PHP           52.61     53.00    53.50   53.50   54.00   KRW Base Rate                  1.75      1.75     1.75     1.75     1.75

                                                                  PHP O/N Reverse Repo           4.75      4.50     4.25     4.25     4.25
     USD/MYR            4.06      4.06     4.08   4.11    4.11
                                                                  SGD 3M SIBOR                   1.94      2.00     2.05     2.10     2.10
     USD/IDR          14,158     14,100 14,200 14,300 14,300
                                                                  SGD 3M SOR                     1.94      2.00     2.05     2.10     2.10
     USD/THB           31.73     31.80    31.90   32.00   32.00
                                                                  SGD 10Y SGS                    2.03      2.10     2.20     2.30     2.30
     USD/MMK           1,515     1,530    1,540   1,560   1,560
                                                                  MYR O/N Policy Rate            3.25      3.00     3.00     3.00     3.00
     USD/VND          23,203     23,300 23,400 23,500 23,500
                                                                  IDR 7D Reverse Repo            6.00      6.00     6.00     5.50     5.50
     USD/INR           68.83     68.80    69.20   69.50   69.50
                                                                  THB 1D Repo                    1.75      1.75     2.00     2.00     2.00

     USD/SGD            1.35      1.35     1.36   1.37    1.37    VND Refinancing Rate           6.25      6.25     6.25     6.25     6.25

     EUR/SGD            1.53      1.55     1.56   1.62    1.64    INR Repo Rate                  6.25      6.25     6.00     6.00     6.00

     GBP/SGD            1.77      1.73     1.77   1.78    1.81
                                                                  COMMODITIES                  22 Mar 19   2Q19F    3Q19F    4Q19F    1Q20F
     AUD/SGD            0.96      0.97     0.98   1.00    1.01
                                                                  Gold (USD/oz)                  1,310     1,350    1,380    1,400    1,450
     SGD/MYR            3.01      3.01     3.00   3.00    3.00
                                                                  Brent Crude Oil (USD/bbl)       68       65-75    65-75    65-75    65-75
     SGD/CNY            4.97      4.96     4.96   4.96    4.96
                                                                                                           6,000-   6,000-   6,000-   6,000-
     JPY/SGDx100        1.22      1.22     1.21   1.21    1.21    LME Copper (USD/mt)            6,421
                                                                                                           7,000    7,000    7,000    7,000

     Quarterly Global Outlook 2Q2019
10   UOB Global Economics & Markets Research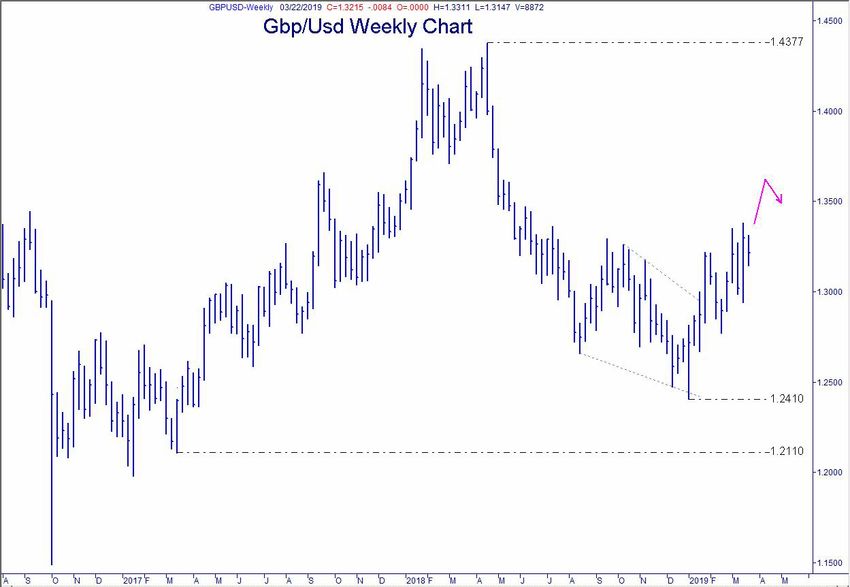
SINGAPORE FOCUS I
MAS April 2019 Preview: Monetary Policy Is Likely To Stay Pat In April
We expect the MAS to keep monetary policy parameters unchanged in their upcoming April 2019 meeting. This means keeping the
appreciation slope, width and center unchanged.
We view current monetary policy to be appropriate despite recent economic softness, given that core inflation pressures will likely
persist into 2H19. We view core inflation to cross its 2.0% handle as early as July 2019.
An eventual monetary tightening in 2019 still remains on the cards. Should our call for the MAS to stay pat in April, a token tightening
into October will likely occur to address the rising price pressures, in line with MAS “primary objective of promoting medium term price
stability”.
A Synchronised Slowdown
Factors such as the US-Sino trade Exhibit 1: Industrial Production Growth Is Tapering Across Key Asian Economies
tensions, fading global tech sector and Source: Macrobond, UOB Global Economics & Markets Research
slower Chinese economic activity have
been quoted as key reasons for the recent
economic slowdown. In the US, we have
already seen softer consumer spending
and government expenditure amid the
longest government shutdown in history
that invariably injected negative spillover
effects to overall growth. In China, the mix
of weakness in its external front, tighter
access to credit and slowing producer
prices are drivers that likely dragged risk
appetite and overall growth prospect.
In Europe, growth stayed lacklustre at
0.9% q/q saar in 4Q19 led by stagnant
performance in the German economy,
although growing optimism for a “soft
Brexit” could buoy risk appetite in the Exhibit 2: Export Growth Turned Negative For Many Asian Economies
near-term.
Source: Macrobond, UOB Global Economics & Markets Research
Collectively, these factors can serve to
inject further external weakness especially
in Asia, which many economies like
Singapore remain to be export-oriented.
Even in many Asian economies, softer
trade and manufacturing prints have
already been observed as early as
last year. The economies that seen a
contraction in manufacturing activities
include Singapore (-3.1% y/y), Taiwan
(-1.9% y/y) and Philippines (-0.7% y/y),
even as export growth in many key Asian
economies tuned to negative growth
prints. For that matter, the World Trade
Organisation (WTO) cited that global trade
Quarterly Global Outlook 2Q2019
SINGAPORE FOCUS I UOB Global Economics & Markets Research 11growth is expected to slow to 3.7% in 2019
(from 3.9% in 2018) with downside risks Exhibit 3: Inflation Pressures Are Easing Across Asia
if trade conditions continue to deteriorate Source: Macrobond, UOB Global Economics & Markets Research
into the year. Kindly see Exhibit 1 and 2 for
further illustration.
Elsewhere, global inflation pressures
continue to fade on the back of lower
food and oil prices on a year-on-year
basis. Specifically, growth in Brent crude
oil on a year-on-year basis has fallen
for three consecutive months (the last
time it happened was during the 2016 oil
price rout), while growth in food prices
as measured by the United Nations FAO
food index declined for nine consecutive
months into February 2019. As a result,
inflation pressures across many key Asian
economies continued to soften into early
2019, especially seen in Philippines and
Exhibit 4: Implied Probability For A Dec 2019 Fed Rate Hike
China which saw their Feb inflation print
hitting its 12-month low while Malaysia Source: Bloomberg, UOB Global Economics & Markets Research
saw its first deflation print since Nov 2009.
100
Closer to home, Singapore’s inflation 91.5%
90
pressures are muted as well, with headline
inflation print below its 0.5% handle for 80
three consecutive months. See Exhibit 3 70
for further illustration. 60
50
Taking A Leaf From 40
Other Central Banks’ Books
30
Weaker-than-expected growth prospects
amid stalling inflation pressures are likely 20
0.6%
the key factors that persuaded policy 10
makers to iterate dovish tones in their 0
latest rhetoric. Taking the lead was the US May-18 Jun-18 Jul-18 Aug-18 Sep-18 Oct-18 Nov-18 Dec-18 Jan-19 Feb-19
Federal Reserve which surprising updated
its March 2019 dot-plot chart in showing
a dramatically lowered rate hike trajectory, Asian central banks in particular are environment in 2017/8 into a period of a
suggesting that the Fed will likely not hike observably quick in adjusting their policy rather anaemic growth environment led
rates in 2019. The Fed also announced tone since then. Particularly, Bank Negara by sustained uncertainties surrounding
its intention to slow its reduction in Malaysia (BNM) has kept its Overnight the US-Sino trade negotiations, slowing
holdings of US Treasuries from the Policy Rate (OPR) unchanged at 3.25% in Chinese economy and a fading technology
current level of US$30bn per month to its latest March MPC meeting, though the boom. This insipid economic growth pace
US$15bn beginning in May 2019 and to overall tone is perceived to be cautious is also met with softening commodity
conclude the balance sheet reduction particularly on the emphasis of downside prices led by lower energy and food
(BSR) program at the end of Sep 2019. growth risks from unresolved trade prices, which had invariably depressed
In addition, the updated Fed economic tensions, heightened uncertainties in the inflationary pressures across many Asian
forecasts showed that the Fed lowered the global and domestic environment, and economies. Singapore, being a price-
2019 GDP growth and inflation forecasts prolonged weakness in the commodity- taker, is also faced with such a paradigm,
and raising unemployment rate forecasts related sectors. Other central banks though also coupled with the recent
slightly. Market-watchers’ response to the which highlighted increased downside economic weakness seen in its recent
gradual turn of economic environment has risks to growth into 2019 – 2020 include fundamental prints.
been observed from the tapering of rate Bangko Sentral Ng Pilipinas (BSP), Bank
hike probability expectations into year- of Thailand (BOT), Central Bank of Taiwan Recent Singapore-Centric
end, which fell from a high of 91.5% in Nov (CBC) and the Reserve Bank of India Prints To Dissuade Tightening
2018 to 0.6% in March 2019. Kindly refer (RBI). Crucially, the synchronised slowdown
to our recent reporreport - US Mar 2019 seen across the globe has also negatively
FOMC: Fed Signals End Of Rate Hike In a nutshell, the global economy has likely affected Singapore. Recent Singapore’s
Cycle for further analysis. moved on from its coveted ‘Goldilocks” economic prints had largely disappointed
Quarterly Global Outlook 2Q2019
12 UOB Global Economics & Markets Research SINGAPORE FOCUS Imarket expectations. These includes
January’s data of industrial production UOB S$NEER
(-3.1% y/y, first contraction since December Source: Macrobond, UOB Global Economics & Markets Research
2017) and NODX (-10.1% y/y, clocking
130
three straight months of contraction).
128
Moreover, inflation pressures remains
muted with January’s CPI at +0.4% y/y 126
while core CPI slowed to 1.7% y/y. For 124
that matter, official forecast for headline 122
inflation in 2019 has been shaded down 120 MAS lifted the
slope "slightly"
to 0.5 – 1.5% from 1.0 – 2.0%, while core 118 in two
Lower imported sessions.
inflation outlook at 1.5 – 2.5% remains 116 inflation and Upward
MAS flattened slope to
unchanged. 114 MAS maintained the defacto 2.0% weaker growth
"neutral". GDP to
pressure on
per annum S$NEER appreciation outlook saw the core CPI to be
MAS flattening its expand at a more led by higher
112 amid supportive global growth and modest pace.
slope "slightly" wages.
We note that the mandate of the Monetary 110
upward wage pressures
Authority of Singapore (MAS) remains Apr-11 Apr-12 Apr-13 Apr-14 Apr-15 Apr-16 Apr-17 Apr-18
to be to promote “medium term price UOB S$NEER Perceived Mid-point Upper Band Lower Band
stability as a sound basis for sustainable
economic growth”. Specifically, the MAS
does not have an explicit inflation target, outlook then”, adding that the current further tightening at this juncture.
but nevertheless has concluded that “a central bank’s stance is “appropriate”
core inflation rate of just under 2.0%, while incoming data is “pretty much as As such, we revise our outlook for the
which is close to its historical mean, is expected, and unchanged”. Note that MAS to keep monetary policy parameters
consistent with overall price stability in the Monetary Authority of Singapore has unchanged in their upcoming April
the economy1”. Empirical core inflation, reiterated a 2019 growth outlook range of 2019 meeting. This means keeping the
which strips out costs of accommodation slightly below 2.5%. appreciation slope, width and center
and private road transport, has softened unchanged. We view current monetary
to 1.7% y/y in January 2019 from 1.9% y/y To Tighten Now Could Be A policy to be appropriate despite recent
in December 2018, while headline inflation Pre-Emptive Move To economic softness, given that higher core
continued to stay below its 0.5% handle Address Higher Inflation inflation pressures will likely persist into
for the third straight month. To that end, Singapore policy makers have 2H19. Should our outlook come to pass, we
tightened monetary policy “measured still view an eventual monetary tightening
Our econometric model suggests that adjustment” in April and October 2018 in the later part of 2019. Barring further
Singapore’s core inflation will eventually by slightly increasing the slope of the negative setbacks from global economic
cross its 2.0% handle in July 2019, and policy band from a neutral zero percent uncertainties, a tightening in October 2019
trend higher to touch 2.5% at end-year previously to our current estimate of a will likely occur in response to the higher
and average 2.0% for the year. This is 1.0% appreciation to-date. At that time, the core inflation print at above 2.0% in 2H19,
starkly different from our initial estimate language in the policy statements centred in line with MAS “primary objective of
for core inflation to cross its 2.0% handle around Singapore’s steady expansion path promoting medium term price stability”.
as early as 1Q19 given the slower-than- in 2018 with output slightly above potential
expected climb in Food, Healthcare, while core inflation is to see “modest but Still, a pre-emptive monetary tightening
Communications and Recreation & continuing pressures, before levelling off in the upcoming April MPC meeting could
Culture prices. Still, we continue to see at just below 2% over the medium term”. still happen, though it is not in our base-
higher inflation pressures into the year, case view. Singapore policy-makers could
given the supportive domestic labour However, accounting for the weaker- pay attention to the gradual rise in core
market conditions which should underpin than-expected economic prints seen inflation in the later part of 2019, which
wage growth, though the likely delay of amid a softening inflation outlook, we in turn see it imperative to inject another
core inflation to cross its critical 2.0% see risks to our initial call for an April’s “measured adjustment” and “slightly
handle into 2H19 could mean less impetus monetary policy tightening. We note that increase” the S$NEER policy slope to
for MAS to tighten monetary policy at this incoming economic prints have been address the eventual rise in domestic
juncture. disappointing which suggest further prices. Still, we think this case to be
headwinds to Singapore’s1Q19 growth unlikely, given the likelihood for further
Moreover, in the issue of slowing growth, outlook. Moreover, even while MAS kept downside to domestic economic growth
MAS chief Ravi Menon added that its core inflation outlook unchanged at as Singapore’s “domestic-oriented sectors
“downside risks have clearly increased” 1.5% - 2.5%, our model suggests that a remained sluggish” while “sluggishness in
and policy buffers to respond are “much core inflation print of above 2.0% will only trade volumes (is) set to continue in the
smaller today”. On MAS decision into come in 2H19. In a nutshell, we observe next few months2”. Moreover, we agree
April, Mr Menon added that “what we will that Singapore economic fundamentals with MAS Chief Ravi Menon’s comment
do depends on the growth and inflation and inflation climate appear softer than that the current monetary policy remains
1 The Monetary Authority of Singapore, Frequently Asked previously anticipated in 2018, which in “appropriate” at this juncture.
Questions on Singapore’s Monetary Policy Framework,
October 2018. turn could suggest some policy inertia for 2 The Monetary Authority of Singapore, Recent Economic
Developments in Singapore, March 2019
Quarterly Global Outlook 2Q2019
SINGAPORE FOCUS I UOB Global Economics & Markets Research 13SINGAPORE FOCUS II
Singapore Budget 2019: Mildly Expansionary With A Focus On Social Measures
Fiscal Position FY2018 - FY2019
S$ Billion
Overall Budget
Surplus/Deficit 2.12 -3.48
Special
Net Investment 15.30 Transfer
Returns Contribution 16.44 9.00 17.17
Example
Example CPF & MediSave Top-ups
Investment reurns Wage Credit Scheme
from MAS, GIC Long-Term Care Support Fund
and Temasek 73.67 78.99 74.90 80.25 Merdeka Generation Fund
Rail Infrastructure Fund
Operating Total
Revenue Expenditure
FY2018 FY2019
For FY2018, the Finance Ministry is expecting an overall budget surplus of S$2.1 billion, or 0.4% of GDP. Into FY2019, Singapore’s
overall budget balance is projected to see a deficit of S$3.5 million, or 0.7% of GDP. We observe that the budget is midly expansionary
with a focus on social measures. The budget has introduced three key thrusts: (1) Deepening Enterprise Capabilities, (2) Deepening
Worker Capabilities and (3) Encouraging Strong Partnership. Other initiatives including the S$6.1 billion Merdeka Generation
Package, increase in defence, security and diplomacy spending to 30% of Singapore’s total expenditure, and tweaks to tax
regulations. Social initiatives include the S$3.1 billion for long-term care support and the S$1.1 billion Bicentennial Bonus.
Revenue Collections For FY2018
Percent of Total Revenue
0.5% Others
2.0% Withholding Tax
2.0% Statutory Board Contributions
Corporate Income Tax 21.9% 3.6% Betting Taxes
3.9% Motor Vehicle Taxes
4.3% Custom & Excise Taxes
6.2% Assets Taxes
Personal Income Tax 15.9%
6.3% Stamp Duty
8.8% Fees & Charges
9.2% Other Taxes
Goods & Services Tax 15.3%
Total Expenditures For FY2018 & FY2019
S$ million
Defence 15.5 FY2019
14.8
Budgeted
Education 13.2
13.1
Health 11.7 FY2018
10.6 Revised
Transport 10.7
11.7
6.7
Home Affairs 6.7
Trade & Industry 4.4
4.7
3.3
National Development 4.1
3.0
Social & Family Development 2.8
2.8
Environment & Water Resources 2.1
Culture, Community & Youth 2.1
2.0
2.0
Manpower 1.8
Communications & Information 1.0
1.2
1.0
Prime Minister’s Office 0.9
Finance 1.0
0.9
0.8
Organs of State 0.7
Law 0.6 Note: The expenditure estimates do not include Special Transfers and
0.4 spending from Government Endowment and Trust Funds.
0.5
Foreign Affairs 0.5 Source: Singapore Budget 2019, Global Economics & Markets Research
For Full Report, please refer to our website www.uobgroup.com.sg/research
Quarterly Global Outlook 2Q2019
14 UOB Global Economics & Markets Research SINGAPORE FOCUS IICHINA FOCUS
Opportunities From Guangdong-Hong Kong-Macao Greater Bay Area
China
Zhaoqing
Guangzhou
Huizhou
Guangdong Province Foshan Dongguan
Greater Bay Area
Shenzhen
Zhongshan
Jiangmen
Hong Kong
Macau
Zhuhai
The Guangdong-Hong Kong-Macao Greater Bay Area (GBA) On 18 February 2019, China unveiled the outline plan for the
consists of Hong Kong SAR, Macao SAR and nine cities Guangdong-Hong Kong-Macao Greater Bay Area (GBA) to be
in Guangdong (Guangzhou, Shenzhen, Zhuhai, Foshan, developed into a vibrant world-class cluster and amongst others, a
Huizhou, Dongguan, Zhongshan, Jiangmen and Zhaoqing). globally influential innovation and technology hub.
The economies of Guangdong, Hong Kong and Macao are
significantly different from one another and this allows value to be
created by leveraging on their diverse strengths. In addition, the
70 million
POPULATION
generally more mature economies of Hong Kong and Macao will
not only be set as benchmarks but also stand to gain from faster
growth rate of its mainland peers in the combined entity of GBA.
Comparing to other “Bay Areas” around the world, there is much
Boasting a population of 70 potential for GBA given the specializations of various cities within
million and land area of nearly GBA and the tightened connectivity will help to further synergize
55,907 sq km, it accounts for these cities’ capabilities.
12.5% of China’s GDP.
At US$1.6 trillion in 2018, we expect the nominal GDP of the GBA
to rise to US$2.7 trillion by 2025 (assuming a conservative nominal
55,907
growth of 7.5% per annum) to become the largest Bay Area in the
world and further rise to US$4.0 trillion in 2030.
sq km
LAND AREA As the GBA will remain at the planning stage in the immediate
period with focus on improving integration, there will be substantial
The nine Mainland cities leeway given to local governments over how they will pursue
12.5 percent
account for nearly a quarter of
Mainland’s total trade while the
region accounts for 39.2% of
these goals. We think the vague targets are in recognition of the
challenges in integrating the region which covers three different
customs, legal systems and currencies.
OF CHINA'S GDP trade in China, Hong Kong and
Macao combined.
Quarterly Global Outlook 2Q2019
CHINA FOCUS UOB Global Economics & Markets Research 15Greater Bay Area Plan: Moving Into Acceleration Phase
China unveiled the outline plan for the Guangdong-Hong Kong- The plan identifies Hong Kong SAR, Macao SAR, Guangzhou
Macau Greater Bay Area (GBA) on 18 February 2019, with the and Shenzhen as the core cities to lead the GBA development.
aim to develop the region into a vibrant world-class cluster. This is important because the plan will lift the status of the
Special Administrative Regions (SARs) of Hong Kong and
The key targets include: Macao in China’s economic development.
1. developing the region into a globally influential innovation
and technology hub, Through the "one country, two systems" model, investors
2. nurturing a dynamic economic region with a cluster of will be able to leverage on Hong Kong’s advantages as the
cities that complement each other in terms of people, most internationalised city within the GBA with developed
capital, goods, services and information, financial/legal infrastructure, to participate in the GBA growth.
3. deepening cooperation between mainland China, Hong It is conceivable that Hong Kong’s status as an international
Kong and Macao, financial hub will be further strengthened in this current GBA
4. establishing a quality living circle for living, working and framework, including its role in further internationalisation of the
travelling and RMB while it will continue to serve the GBA in other areas such
5. acting as a catalyst for the Belt and Road Initiative (BRI) as shipping, trade, aviation, financial services, and as a magnet
for attracting international talent.
The 11 cities in the GBA are situated along the Maritime Silk
Road of the BRI and share the same goal to further open In the immediate period to 2022, the GBA plan aims to achieve
up China’s trade and investment, through enhancement in coordinated regional development where the framework for an
infrastructural connectivity, economic and trade cooperation international first-class bay area and world-class city cluster
as well as people-to-people exchanges with different regions. should be essentially formed. By 2035, the GBA is envisioned to
Hong Kong and Macao will thus become important platforms for become an innovation-driven economic system. As the GBA will
joint participation in the BRI. remain at the planning stage in the immediate period with focus
on improving integration, there will be substantial leeway given
to local governments over how they will pursue these goals. We
think the vague targets are in recognition of the challenges in
integrating a region which covers three different customs, legal
systems and currencies.
Greater Bay Area: Key Milestones
The GBA has received much attention since last year (2018). will realise the GBA target of ‘one-hour living circle’ i.e. bringing
Spun off from the earlier mainland-focused Pearl River Delta all major cities within the GBA in a travel radius of one hour, in
(PRD) economic zone (which did not include SARs of Hong order to speed up regional development.
Kong and Macao in its earliest configuration), the GBA was
set as a national strategy in 2016. In July 2017, the National These two major cross-boundary infrastructure projects are a
Development and Reform Commission (NDRC) and the huge boost to the physical connectivity in the GBA. This will be
governments of Guangdong, Hong Kong and Macao signed further strengthened by two more bridges over the Pearl River
the "Framework Agreement on Deepening Guangdong-Hong which are currently under construction. 1) The second Humen
Kong-Macao Cooperation in the Development of the Bay Area". Bridge that will link Guangzhou and Dongguan is scheduled for
completion in 2019, and 2) the Shenzhen-Zhongshan Bridge
The increasing interest on GBA came along with the opening of to connect these two major cities on the eastern and western
the 55 km Hong Kong-Zhuhai-Macao Bridge (HZMB) in October sides of the PRD is expected to come into operation in 2024.
2018 and the final 26 km phase Hong Kong section of the
Guangzhou-Shenzhen-Hong Kong Express Rail Link (XRL) in The recently proposed Zhuhai-Shenzhen bridge and high-
September 2018. The Guangzhou-Shenzhen and Guangzhou- speed rail project will add further to the list of plans to link up the
Zhuhai sections of the XRL were completed in 2011-12. The various economic nodes of the GBA and hence its attractiveness
HZMB cuts travelling time between Zhuhai and Hong Kong to as well as its upside potential.
under an hour from four hours previously while the completion
of the final 26km of the Hong Kong section in the XRL integrates
commuters in Hong Kong into China’s national rail network. This
Quarterly Global Outlook 2Q2019
16 UOB Global Economics & Markets Research CHINA FOCUSCreating Synergies Through The Strengths Of The Diverse GBA Cities
The economies of Guangdong, Hong Kong and Macao are Hong Kong Is A Services-Driven Economy
significantly different from one another and therein lie their With Deep Specialisation In Trade And Finance
complementarity nature and potential: Guangdong province is Source: CEIC, UOB Global Economics & Markets Research
primarily manufacturing-based (secondary industry is 39% of
GDP) with diverse capabilities among its cities; Hong Kong Hong Kong Economic Structure (% Share of GDP, 2017)
on the other hand, has always been predominantly services- Manufacturing Construction
driven; and Macao’s economy is mainly driven by tourism and 1% 5%
Others Wholesale &
related services. The integration of these varied cities through 32% Retail Trades
enlarged and integrated connectivity, regulation etc will create 21%
value and synergies by leveraging on their diverse strengths. Accommodation
& Food
Services
Guangdong’s Large Manufacturing Sector 3%
Is The Key Driver Of Its Economy Real Estate, Transport,
Prof & Business Storage, Postal
Source: CEIC, UOB Global Economics & Markets Research & Courier
Service
11% 6%
Guangdong Economic Structure (% Share of GDP, 2017) Information &
Financial & Communication
Primary Insurance s
Tertiary: Others Industry
18% 3%
21% 4%
Tertiary: Real
Estate Secondary:
Industry
9% Tourism And Gaming Accounts For The Bulk Of Macao’s Economy
39%
Tertiary:
Source: CEIC, UOB Global Economics & Markets Research
Financial
Intermediation
8% Macao Economic Structure (% Share of GDP, 2017)
Secondary:
Construction Utilities Wholesale,
Construction
3% 1% Retail, Repair,
Tertiary: Hotel
Manufacturing
4% Hotels &
& Catering Tertiary: Tertiary: Restaurants
Service Wholesale & Transport, 0%
12%
2% Retail Trade Storage & Post Transport,
10% 4% Storage &
Communication
s
3%
Public Admin, Financial Int,
Social & Real Estate,
Personal Serv Renting &
incl Gaming Business
Industry Activity
59% 21%
Guangdong: Large Diverse Manufacturing Base And A Driver Of Innovation And Technology
Technology will continue to be a major driver of the GBA growth. to create more value for the manufacturing industries and has
Harnessing Guangdong’s position as one of the fastest growing the potential to propel China’s high-tech export share in the
provinces in China and a leader in advanced manufacturing and coming years (from current 30%).
innovation in the country, the GBA plan aims to turn the region
into an international innovation and technology hub, cementing By province, Guangdong has the highest R&D expenditure which
its status as one of the major high-tech manufacturing centers accounted for 13.3% share of total R&D expenditure in China in
of the world. 2017. The R&D expenditure in the province has continued to
rise over the years to reach 2.5% of Guangdong’s GDP in 2017.
The large and diverse manufacturing base in the Guangdong Guangdong is also ranked highly in urban fixed asset investment
cities ranges from high-tech manufacturing in Shenzhen, white with US$553.6 bn (39.6% of Guangdong’s GDP) recorded in
goods in Zhongshan and Foshan, and automobiles in Jiangmen. 2017. By sector, around 28% of the urban FAI in Guangdong is
The GBA will be able to capitalize on the various supply chains in manufacturing while real estate accounted for 36%.
Quarterly Global Outlook 2Q2019
CHINA FOCUS UOB Global Economics & Markets Research 17You can also read