Killer Heat in the United States - Climate Choices and the Future of Dangerously Hot Days - Union of Concerned Scientists
←
→
Page content transcription
If your browser does not render page correctly, please read the page content below
Killer Heat in the
United States
Climate Choices and the Future
of Dangerously Hot Days


Killer Heat in the
United States
Climate Choices and the Future of Dangerously
Hot Days

Kristina Dahl
Erika Spanger-Siegfried
Rachel Licker
Astrid Caldas
John Abatzoglou
Nicholas Mailloux
Rachel Cleetus
Shana Udvardy
Juan Declet-Barreto
Pamela Worth

July 2019
© 2019 Union of Concerned Scientists The Union of Concerned Scientists puts rigorous, independent
All Rights Reserved science to work to solve our planet’s most pressing problems.
Joining with people across the country, we combine technical
analysis and effective advocacy to create innovative, practical
Authors solutions for a healthy, safe, and sustainable future.
Kristina Dahl is a senior climate scientist in the Climate and
Energy Program at the Union of Concerned Scientists. More information about UCS is available on the UCS website:
www.ucsusa.org
Erika Spanger-Siegfried is the lead climate analyst in the
program. This report is available online (in PDF format) at www.ucsusa.org
/killer-heat.
Rachel Licker is a senior climate scientist in the program.
Cover photo: AP Photo/Ross D. Franklin
Astrid Caldas is a senior climate scientist in the program. In Phoenix on July 5, 2018, temperatures surpassed 112°F. Days
with extreme heat have become more frequent in the United States
John Abatzoglou is an associate professor in the Department and are on the rise.
of Geography at the University of Idaho.
Printed on recycled paper.
Nicholas Mailloux is a former climate research and engagement
specialist in the Climate and Energy Program at UCS.
Rachel Cleetus is the lead economist and policy director in the
program.
Shana Udvardy is a climate resilience analyst in the program.
Juan Declet-Barreto is climate scientist in the program.
Pamela Worth is the staff writer in the communications
department at UCS.
Full Team
Project management: Kristina Dahl, Rachel Licker, and Erika
Spanger-Siegfried
Leadership: Angela Anderson, Brenda Ekwurzel, and Adam
Markham
Additional review: Kate Cell, Jeff Deyette, Abby Figueroa,
Jamesine Rogers Gibson, Matt Heid, Adrienne Hollis, Deborah
Moore, Ashley Siefert Nunes, and Ortal Ullman
Writing and editorial support: Chloe Ames and Seth Shulman
Production: Cynthia DeRocco and Bryan Wadsworth
Design: Tyler Kemp-Benedict
ii union of concerned scientists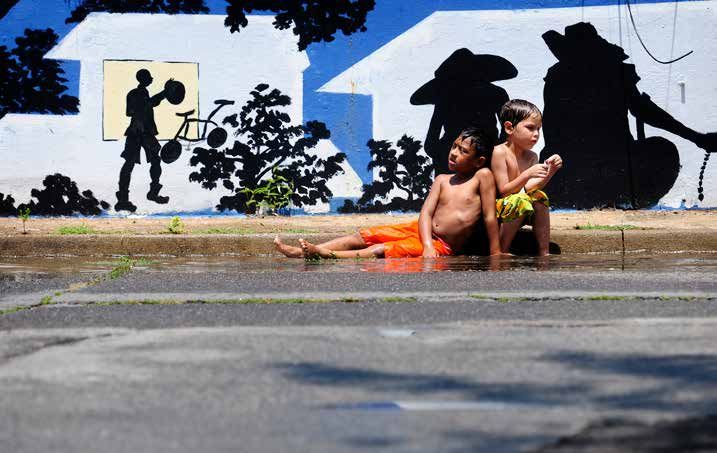
[ Contents ]

 v   Figures, Tables, and Box
vi   Acknowledgments

		 Chapter 1
 1   Introduction
 2   Examining Future Extreme Heat and Emissions Choices
 3   A Snapshot of Results

		 Chapter 2
 4   The Heat Index: What Extreme Heat “Feels Like”
 4   How and Why the National Weather Service Uses Heat Index Thresholds

		 Chapter 3
 8   How Heat Harms Our Bodies
 8   Heat-Related Illnesses and Deaths
 9   Child Bodies
 9   Elderly Bodies
10   Bodies with Special Conditions and Needs

		 Chapter 4
11   Findings: The Future of Dangerously Hot Days
13   Midcentury Results (2036–2065)
17   Late-Century Results (2070–2099)

                                                     Killer Heat in the United States   iii
Chapter 5
                                     22   Implications: How the Heat We Create Threatens Us All—but Some
                                          More Than Others
                                     22   Outdoor Workers
                                     24   City Dwellers
                                     24   Rural Residents
                                     25   People and Neighborhoods with Low Income or Experiencing Poverty
                                     25   People Exposed to Other Extremes

                                     		 Chapter 6
                                     26   Our Challenge and Our Choices: Limiting Extreme Heat and Its
                                          Accompanying Harm
                                     26   Keeping People Safe from Extreme Heat
                                     28   Investing in Heat-Smart Infrastructure
                                     29   Investing in Climate-Smart Power Systems
                                     29   Putting the Nation on a Rapid Path to Reduced Emissions
                                     30   Holding the Line against an Unrecognizably Hot Future

                                     32   Appendix: Methodology
                                     32   What Models Did We Use in This Analysis?
                                     32   What Emissions Scenarios Did We Use?
                                     32   How Did We Project Days with Extreme Heat Index Values?
                                     32   What Are the Key Caveats, Limitations, and Assumptions?

                                     34   Endnotes
                                     35   References

iv   union of concerned scientists
[ Figures, Tables, and Box ]

		Figures
 5   Figure 1. How Temperature and Humidity Create the Heat Index
 6   Figure 2. More People Are at Risk as the Heat Index Rises
 9   Figure 3. How Heat Affects Our Bodies
11   Figure 4. Future Warming Depends on Our Emissions Choices
13   Figure 5. Extreme Heat by Midcentury Becomes More Frequent and Widespread
14   Figure 6. Millions More People Will Face Extreme Heat by Midcentury
15   Figure 7. Urban Areas Face Frequent, Extreme Heat by Midcentury
17   Figure 8. Frequency of Extreme Heat by Late Century Depends on the Choices
     We Make
18   Figure 9. Rapid Action Could Limit the Number of People Facing Frequent,
     Extreme Heat
19   Figure 10. Urban Areas Face Frequent, Extreme Heat by Late Century

		Tables
12   Table 1. Extreme Heat Will Become More Frequent and More Severe in
     All Regions of the Country
15   Table 2. Northeast Cities Face Steep Increases in Days per Year Above 90°F
     by Midcentury
16   Table 3. Southeast and Southern Great Plains Cities Will Face Many More Days
     per Year with a Heat Index Above 105°F by Midcentury
19   Table 4. Midwest and Northern Great Plains Cities Face Many More Days
     per Year with a Heat Index Above 100°F by Late Century
21   Table 5. Sunbelt Cities Face More Frequent Days with a Heat Index Above 105°F
     in Late Century

		Box
 7   Off-the-Charts Days

                                                         Killer Heat in the United States   v
[ Acknowledgments ]

                                     This report was made possible by the generous support of the Barr Foundation,
                                     the Common Sense Fund, the Energy Foundation, the Fresh Sound Foundation,
                                     the MacArthur Foundation, the Rauch Foundation, The Rockefeller Foundation,
                                     The Scherman Foundation, one anonymous funder, and UCS members.
                                          The report team would like to express thanks to the following individu-
                                     als for their invaluable advice, technical guidance, and/or review of the report:
                                     Brooke Anderson, Colorado State University; Rupa Basu, CalEPA; Kristie Ebi,
                                     University of Washington; Meredith Jennings, Houston Advanced Research Center;
                                     Laurence Kalkstein, Applied Climatologists Inc.; Kenneth Kunkel, North Carolina
                                     State University; Benjamin Sanderson, CERFAC/CNRS Laboratoire Climat,
                                     Environnement, Couplages et Incertitudes; Ronald Stouffer, University of Arizona;
                                     and several anonymous individuals at the National Weather Service.
                                          Organizational affiliations are listed for identification purposes only. The
                                     opinions expressed herein do not necessarily reflect those of the organizations that
                                     funded the work or the individuals who informed or reviewed it. The Union of
                                     Concerned Scientists bears sole responsibility for the report’s content.

vi   union of concerned scientists
[ Chapter 1 ]

Introduction

After working outside in her garden on a sweltering Saturday
in late June 2018, a 64-year-old Pennsylvania woman was
                                                                         Temperatures around
taken to the hospital, where she died of cardiac arrest. The             the world have been
next day, a 30-year-old man running a trail race in upstate
New York collapsed a half mile before the finish line. He was            increasing for decades
brought to the hospital and died that day. Hundreds of miles
apart, these two deaths shared a common culprit: extreme
                                                                         in response to rising heat-
heat. By the time the week was out, heat would claim the lives           trapping emissions.
of at least three more people in the United States (Miller and
Park 2018; Palmer 2018).
     North of the border in Quebec, where many homes are not       dangerously hot and would threaten the health, lives, and liveli-
air-conditioned, the same heat wave pushed “feels like” tem-       hoods of millions of people. Such heat could also make droughts
peratures as high as 104°F, killing more than 70 people. During    and wildfires more severe, harm ecosystems, cause crops to fail,
July of that same year, record temperatures occurred around        and reduce the reliability of the infrastructure we depend on.
the Northern Hemisphere, with actual temperatures in Siberia            Climate change and its consequences are already manifest-
topping 90°F; the African continent setting a new heat record in   ing in the form of deadlier storms, rising sea levels, droughts,
Algeria at 124°F; and Japan’s scorching heat sickening more than   wildfires, and floods. Yet the heat extremes forecast in this
22,000 people in a single week (Masters 2018; Pitofsky 2018).      analysis are so frequent and widespread that it is possible they
     Extreme heat is among the deadliest weather hazards           will affect daily life for the average US resident more than any
society faces. During extremely hot days, heat-related deaths      other facet of climate change. But this analysis also finds that
spike and hospital admissions for heat-related illnesses rise,     the intensity of the coming heat depends heavily on our near-
especially among people experiencing poverty, elderly adults,      term choices. By cutting emissions quickly and deeply, we
and other vulnerable groups (NWS 2018; CDC 2017a).                 can slow global warming and limit the increase in the number
     Temperatures around the world have been increasing for        of extremely hot days. Every 10th of a degree we avoid in
decades in response to rising heat-trapping emissions from         increased temperatures will matter to our overheating world.
human activities, primarily the burning of fossil fuels. These          If we wish to spare people in the United States and
rising temperatures are causing more days of dangerous—even        around the world the mortal dangers of extreme and relent-
deadly—heat locally. This Union of Concerned Scientists            less heat, there is little time to do so and little room for half
(UCS) analysis shows that if we stay on our current global         measures. We need to employ our most ambitious actions to
emissions path, extreme heat days are poised to rise steeply       prevent the rise of extreme heat—to save lives and safeguard
in frequency and severity in just the next few decades. This       the quality of life for today’s children, who will live out their
heat would cause large areas of the United States to become        days in the future we’re currently creating.

                                                                                                     Killer Heat in the United States   1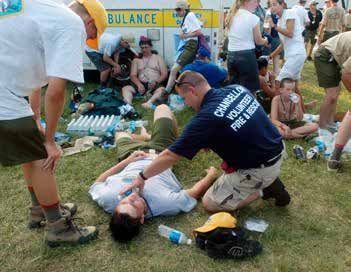
Examining Future Extreme Heat and
Emissions Choices
For the greatest odds
This UCS analysis provides a detailed view of how extreme heat
of securing a safe climate
events caused by dangerous combinations of temperature and future, we need to take
humidity are likely to become more frequent and widespread
in the United States over this century. It also describes the
aggressive action. Our
implications for everyday life in different regions of the country. challenge is great, but the
We have analyzed where and how often in the contigu-
ous United States the heat index—also known as the National threat of not meeting it
Weather Service (NWS) “feels like” temperature—is expected
to top 90°F, 100°F, or 105°F during future warm seasons (April
is far greater.
through October). While there is no one standard definition
of “extreme heat,” in this report we refer to any individual We have conducted this analysis for three global climate
days with conditions that exceed these thresholds as extreme scenarios associated with different levels of global heat-
heat days.1 We also analyzed the spread and frequency of heat trapping emissions and future warming. These scenarios
conditions so extreme that the NWS formula cannot accu- reflect different levels of action to reduce global emissions,
rately calculate a corresponding heat index. The “feels like” from effectively no action to rapid action. Even the scenario
temperatures in these cases are literally off the charts. of rapid action to reduce emissions does not spare our
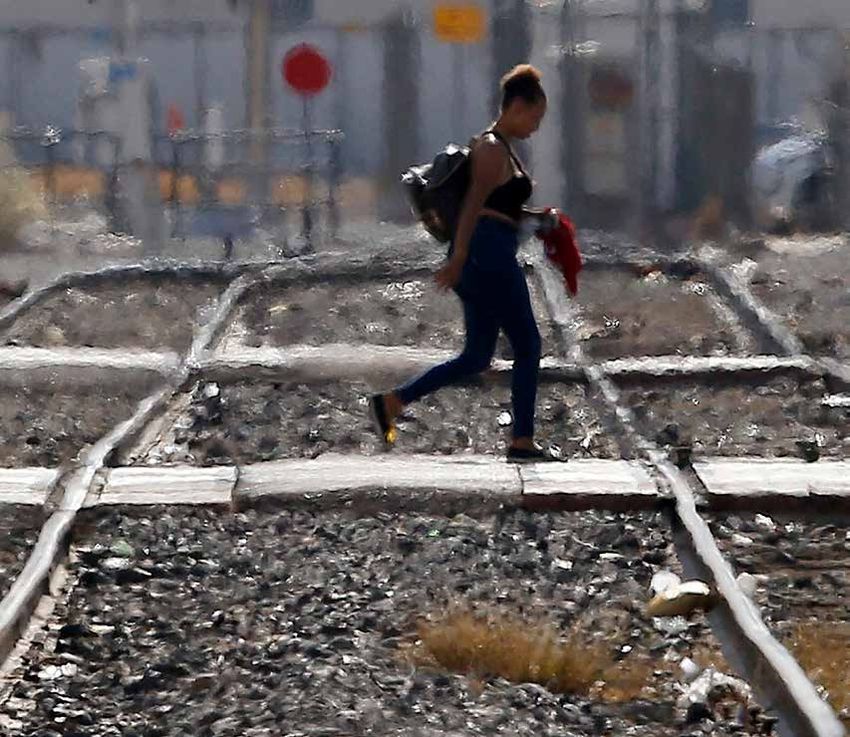
AP Photo/John Locher
A woman works as an advertising sign holder in Las Vegas during a heat wave in July 2014. While extreme heat already affects the lives of many US residents—killing
hundreds each year and sending many more to the hospital with heat-related illnesses—continued global warming will cause a steep increase in extreme heat
conditions nationwide.
2 union of concerned scientistscommunities a future of substantially increased extreme heat. projected to rise to more than 6 million people by mid-
For the greatest odds of securing a safe climate future for our- century—again, assuming no population changes.
selves and the ecosystems we all depend on, we would need Late in the century (2070–2099), with no action to reduce
to take even more aggressive action, in the US and globally, heat-trapping emissions, the following changes can be expected:
than outlined in any of the scenarios used here. Our challenge
is great, but the threat of not meeting it is far greater. • The United States will experience, on average, four times
as many days per year with a heat index above 100°F, and
nearly eight times as many days per year above 105°F, as
A Snapshot of Results it has historically.
• At least once per year, on average, more than 60 percent
Our results show that, with no action to reduce heat-trapping of the United States by area will experience off-the-
emissions,2 by midcentury (2036–2065), the following charts conditions that exceed the NWS heat index range
changes would be likely in the United States,3 compared with and present mortal danger to people.
average conditions in 1971–2000:
• More than 60 percent of urban areas in the United
• The average number of days per year with a heat index States—nearly 300 of 481—will experience an average of
above 100°F will more than double, while the number of 30 or more days with a heat index above 105°F.
days per year above 105°F will quadruple.
• The number of people who experience those same condi-
• More than one-third of the area of the United States will tions—still assuming no population change—will increase
experience heat conditions once per year, on average, to about 180 million people, roughly 60 percent of the
that are so extreme they exceed the current NWS heat population of the contiguous United States.
index range—that is, they are literally off the charts.
• The number of people exposed to the equivalent of a
• Nearly one-third of the nation’s 481 urban areas with a week or more of off-the-charts heat conditions will rise
population of 50,000 people or more will experience an to roughly 120 million people, more than one-third of the
average of 30 or more days per year with a heat index population.
above 105°F, a rise from just three cities historically
(El Centro and Indio, California, and Yuma, Arizona). Our results show that failing to reduce heat-trapping
emissions would lead to a staggering expansion of dangerous
• Assuming no changes in population, the number of heat. In contrast, aggressive emissions reductions that limit
people experiencing 30 or more days with a heat index future global warming to 3.6°F (2°C) or less would contain
above 105°F in an average year will increase from just that expansion and spare millions of people in the United
under 900,000 to more than 90 million—nearly one-third States from the threat of relentless summer heat. With these
of the US population.4 aggressive emissions reductions, the above impacts would,
• Countrywide, more than 1,900 people per year have in most cases, be held at or below their midcentury levels and
historically been exposed to the equivalent of a week or would not grow progressively worse during the second half
more of off-the-charts heat conditions; this number is of the century.
Failing to reduce heat-trapping
emissions would lead to a staggering
expansion of dangerous heat.
Killer Heat in the United States 3[ Chapter 2 ]
The Heat Index: What Extreme Heat
“Feels Like”
The outside temperature according to a car dashboard may
be 90°F, but what we feel when we step out could be worlds
To our bodies’ cooling
apart depending on whether we are parked in Arkansas or systems, humidity makes
Arizona. It is not only hot in Arkansas but also often humid.
To our bodies’ cooling systems, humidity makes all the dif- all the difference.
ference. People sweat to release heat because when sweat
evaporates, it has a cooling effect. A breeze or a fan can help us To warn people of anticipated or ongoing conditions
to cool down by quickening the pace of that evaporation. But that could cause heat-related illnesses or death, the NWS
humidity in the air around us limits the evaporation of sweat combines temperature and relative humidity to produce a
and reduces the associated cooling effect. So high temperature heat index, or a “feels like” temperature (NWS n.d. a) (see
and humidity cause our bodies to accumulate heat. For this Figure 1, p. 5, and box, p. 7).5 The NWS uses heat index–based
reason, temperature is generally considered in tandem with thresholds as the basis for issuing heat advisories and exces-
humidity to measure heat stress conditions, or those in which sive heat warnings. For example, when relative humidity is
the human body has difficulty cooling itself (CDC 2017b). low, at 45 percent, a temperature of 94°F would result in a
When exposed to such conditions, our bodies’ tempera- heat index of 100°F. However, at a higher relative humidity
ture rises, and heat-related illnesses (ranging in severity from of 70 percent, a temperature of only 88°F would result in
mild heat cramps to life-threatening heat stroke) can occur. that same heat index. In humid locations such as Arkansas,
In general, adults over the age of 65, young children, people the heat index may be much higher than the air temperature,
who are sick, people with mental or physical disabilities, whereas in arid locations such as Arizona, the temperature
people in low-income communities (who often lack access and heat index may be the same.
to air-conditioning or the means to pay for its use), outdoor
workers, and military personnel who must exert themselves
outdoors are among the most vulnerable to extreme heat, How and Why the National Weather Service
given their greater exposure and/or their bodies’ diminished Uses Heat Index Thresholds
ability to cope (Morris et al. 2019; Reid et al. 2009). Over
the last 30 years, on average, exposure to extreme heat was While health risks exist at all heat index values above
the top cause of weather-related deaths in the United States 80°F, the severity of those risks varies depending on who is
(NWS 2018). Between 1999 and 2010, exposure to extreme exposed, whether they are engaged in physical activity, and
heat was implicated in 7,415 deaths in the United States—an how long the exposure lasts (Morris et al. 2019). Conditions
average of more than 600 per year (CDC 2012)—but likely that are manageable for some people can be dangerous—or
contributed to many more (Berko et al. 2014; Luber and even fatal—for others (Morris et al. 2019; Grundstein et al.
McGeehin 2008; Donoghue et al. 1997). 2010). Age, underlying health, physical fitness, access to
4 union of concerned scientistsFIGURE 1. How Temperature and Humidity Create the Heat Index
Temperature (°F)
80 82 84 86 88 90 92 94 96 98 100 102 104 106 108 110 112+
40 80 81 83 85 88 91 94 97 101 105 109 114 119 124 130 136 80°F–89°F
45 80 82 84 87 89 93 96 100 104 109 114 119 124 130 137 90°F–99°F
Relative Humidity (%)
50 81 83 85 88 91 95 99 103 108 113 118 124 131 137 100°F–104°F
55 81 84 86 89 93 97 101 106 112 117 124 130 137 105°F+
60 82 84 88 91 95 100 105 110 116 123 129 137
Off the Charts
65 82 85 89 93 98 103 108 114 121 128 136
70 83 86 90 95 100 105 112 119 126 134
[Tyler: update colors. LABEL:
75 84 88 92 97 103 109 116 124 132
Off Off
thethe Charts: Heat index
Charts
80 84 89 94 100 106 113 121 129 Heatformula becomes
index formula invalid with
becomes
85 85 90 96 102 110 117 126 135 extreme
invalid temperature
with extreme and
temperature
and humidity
humidity combinations
combinationsthat will
90 86 91 98 105 113 122 131
that increasingly resultresult
will increasingly from from
global
95 86 93 100 108 117 127 warming.]
global warming
100 87 95 103 112 121 132
Heat is more harmful to human health when humidity is high because humid air hinders the evaporation of sweat, and thus reduces the
body’s ability to cool itself. To determine the effect of both heat and humidity, the National Weather Service formulated the heat index based
on the range of warm-season conditions we typically see on Earth. As our climate warms, we will increasingly find ourselves outside the range
of reliably calculable heat index values, or, quite literally, off the charts. Colors reflect the categories of heat index conditions examined in
this study.
SOURCE: STEADMAN 1979A; NWS N.D. A.
cooling, and a person’s surroundings (e.g., whether they live thresholds have been established because these conditions
in a city or a rural environment) are among the many factors can be dangerous, even deadly (see Figure 2, p. 6). While the
that determine overall heat health risks. thresholds are somewhat arbitrary, given that the impacts of
When developing its guidance for the use of the heat heat are highly individual (Watts and Kalkstein 2004), NWS
index in forecasts and alerts in the 1980s, the NWS consid- guidance and additional research point to the following:
ered the impacts of a range of heat index values on human • With a heat index around 90°F, sun stroke, heat cramps,
health (NWS 1984). The language used by the NWS in heat and heat exhaustion are possible for certain risk groups
alerts today reflects both the general risks extreme heat poses (NWS 1984). In particular, those who engage in physical
to the public and considerations of the groups most at risk exertion outdoors (e.g., outdoor workers, military per-
during an extreme heat event. sonnel, athletes) without being accustomed to the heat
National guidance from NWS suggests, in general, that a are susceptible to heat stress at this threshold (Morris et
local heat advisory be issued when the heat index in a region al. 2019; OSHA n.d.).
is expected to reach or exceed 100°F for 48 hours and that
an excessive heat warning be issued when the heat index • At a heat index of 100°F, NWS heat advisories state that
reaches or exceeds 105°F for 48 hours (NWS n.d. b). These “heat stress or illnesses are possible, especially for elderly
adults and those sensitive to heat,” which includes
children (Iowa State University 2019). Advice such as
Conditions that are “Drink plenty of fluids” and “Check up on relatives and
neighbors” frequently accompanies NWS heat advisories
manageable for some at this level.
people can be dangerous— • At a heat index of 105°F, even healthy adults are at risk
of heat-related illness with prolonged exposure. NWS
or even fatal—for others. excessive heat warnings issued at this level often state
Killer Heat in the United States 5that “heat illness is likely.” Warnings such as “When pos- to extreme heat, have raised the threshold for excessive heat
sible, reschedule strenuous activities to early morning warnings from 105°F to 115°F. The policies of other local
or evening”; “The very young, the elderly, those without offices include factors such as elevation, nighttime tempera-
air conditioning, and those participating in strenuous tures, and time of year (Hawkins, Brown, and Ferrell 2017).
outdoor activities will be the most susceptible”; and However, rising numbers of heat-related deaths in
“Car interiors can reach lethal temperatures in a matter places such as Phoenix, Arizona—where we might expect
of minutes” usually accompany these alerts (Iowa State residents to be accustomed to the heat—suggest that warm-
University 2019). ing temperatures and a range of socioeconomic factors
• For heat index values above 130°F, NWS has no standard (such as access to functional air-conditioning, age, and race)
guidance, though one source indicates that heat stroke is require greater consideration when defining the local risk
“highly likely with continued exposure” (NWS 1984). posed by extreme heat (Maricopa County Public Health
2017; Hayden, Brenkert-Smith, and Wilhelmi 2011; Stone,
• The Occupational Safety and Health Administration Hess, and Frumkin 2010). And while access to ubiquitous
(OSHA) advises that exposure to direct sun can increase air-conditioning has been shown to reduce heat-related
the heat index by as much as 15 degrees. mortality, true physiological acclimatization to heat requires
Local environmental conditions and the degree to which consistent outdoor daily exertion over an extended period of
people are acclimatized—or accustomed—to extreme heat time. The facts of this process suggest that constant access to
affect health outcomes in different regions. Because of this, air-conditioning may preclude acclimatization (Nordio et al.
nearly half of local NWS Weather Forecast Offices have 2015; Acosta 2009).
developed their own revised policies around extreme heat In many northern states, where heat-related mortality is
(Hawkins, Brown, and Ferrell 2017).6 NWS offices in South more prevalent, incidences of heat-related illness start to rise
Carolina, for example, where the population is accustomed with a heat index as low as 80°F to 85°F (Vaidyanathan et al.
FIGURE 2. More People Are at Risk as the Heat Index Rises
Heat Index Heat Index Heat Index Heat Index
Above 90°F Above 100°F Above 105°F Off the Charts
Left to right: AP Photo/Napa Valley Register, Lianne Milton;
AP Photo/Julio Cortez; lzf/iStock; logoboom/Shutterstock
Outdoor workers become Children, elderly adults, Anyone could be at risk Undetermined: any level
more susceptible to heat- pregnant women, and of heat-related illness or of exposure is presumed
related illness. people with underlying even death as a result of extremely dangerous
conditions are at prolonged exposure. for all people and likely
heightened risk of heat- to result in heat-related
related illness. illness or even death.
Heat index conditions as low as 80°F can affect human health. Extreme heat exposure affects people differently depending on their health and
environment. Certain groups of people may become more susceptible to heat-related illness as the heat index rises.
SOURCES: IOWA STATE UNIVERSITY 2019; MORRIS ET AL. 2019; NWS 1984; NWS N.D. B; OSHA N.D.
6 union of concerned scientistsOff-the-Charts Days
The heat index was originally formulated to capture all but
the most extreme combinations of temperature and rela-
AP Photo/Richmond Times-Dispatch, P. Kevin Morley
tive humidity occurring on Earth (Steadman 1979a). In
heat that exceeds the ranges of the temperature and rela-
tive humidity values that were considered, skin moisture
levels are so high that sweating is significantly inhibited
and the equations used by the National Weather Service
(NWS) to calculate the heat index become unreliable
(Alber-Wallerström and Holmér 1985) (see Figure 1, p. 5).
Without a reliable estimate of the heat index, the
NWS cannot adequately communicate the gravity of asso-
ciated risks to public health. Historically, such incalculable
Extreme heat caused hundreds of cases of heat-related illness during the Boy conditions have represented the world’s most oppres-
Scouts of America’s 2005 National Jamboree in Virginia. Susceptibility to heat- sively hot, dangerous, and, fortunately, rare days—those
related illness depends on many factors, including a person’s age and fitness and with a heat index well above 130°F. The only place in the
how acclimated they are to extreme heat.
contiguous United States that has had off-the-charts days
in an average year is the Sonoran Desert, where Southern
2018; Curriero et al. 2002). Because of this, some individual California meets Arizona. Our analysis projects that, as our
overall climate warms, this will change.
states and localities have revised their advisory thresholds
As global average temperatures continue to warm,
downward (Wellenius et al. 2017; NHDPHS n.d.). Officials
driven by our heat-trapping emissions, not only will the
also now consider how long the heat event is expected to last
frequency of extreme heat events increase (USGCRP 2017),
and the time of year it occurs, as heat events occurring earlier but high heat index conditions will also become more
in the year, before people are acclimatized to warmth, have extreme, surpassing dangerous thresholds more frequently
a greater impact on human health than those occurring later and heading—for the first time in most regions—into
in the summer or early fall (Sheridan and Lin 2014; Anderson unprecedented territory holding even greater risk of illness
and Bell 2011). and mortality for residents. Within the next 20 years, many
people in the United States will be faced with heat unlike
any they have dealt with before.
Those not accustomed to extreme
heat conditions are more susceptible
to heat-related illness and mortality.
Killer Heat in the United States 7[ Chapter 3 ]
How Heat Harms Our Bodies
When extreme heat conditions prevent our bodies from ade- Heat-Related Illnesses and Deaths
quately cooling, our core temperatures rise, causing a variety
of symptoms (see Figure 3). This can be made worse by the With heat cramps, people experience cramping or pain in the
environment surrounding us—a blacktop playground with no stomach, arms, or legs as a result of excessive sweating that
shade, for example, or a room with no air-conditioning—and causes loss of large amounts of salt and water from the body.
by underlying health conditions. During heat waves, calls Heat exhaustion can cause dizziness, a weak pulse, nausea,
to emergency medical services and hospital admissions rise and fainting. The most severe heat-related illness, heat stroke,
(Davis and Novicoff 2018; Zhang, Chen, and Begley 2015; can occur when the body’s core temperature rises from its
Dolney and Sheridan 2006; Medina-Ramón et al. 2006). usual 98.6°F to 104°F or higher. High body temperature is
Cooler nighttime temperatures typically provide relief from associated with increased heart and respiratory rates and,
a hot day and give our bodies a chance to cool down, but at extreme levels, damage to the brain, heart, lungs, kidneys,
when nights remain hot, health risks rise, especially for those and liver (Seltenrich 2015). This can be fatal (CDC 2017b).
without access to air-conditioning or for whom the choice Without cooling, heat-related deaths can occur quickly—
of turning on the air-conditioning presents difficult financial typically the same day or the day after outside temperature
trade-offs (Anderson and Bell 2011) (see chapter 5, p. 22). spikes—which signals the need for a quick response to
The longer our bodies remain overheated, the greater extreme heat conditions by public health officials and either
the risk of heat-related illnesses (such as heat cramps, heat the people exposed or their caregivers (Anderson and Bell
exhaustion, and heat stroke) and the greater the risk of death 2011). However, health impacts from heat can also occur one
(CDC 2017b; Choudhary and Vaidyanathan 2014). or more days after the exposure to extreme heat, and each
additional consecutive day of extreme heat increases heat-
related mortality rates (Chen et al. 2017; Hajat et al. 2006).
While one-day heat events are enough to raise the rates of
The longer our bodies heat-related illness, longer heat waves are more likely to have
a larger effect on a variety of adverse health outcomes (Basu
remain overheated, the et al. 2012).
greater the risk of heat- In addition to deaths caused by heat-related illness,
extreme heat conditions increase rates of heart attacks, car-
related illnesses and the diovascular mortality, and respiratory mortality (Mastrangelo
et al. 2007; Medina-Ramón et al. 2006; Braga, Zanobetti, and
greater the risk of death. Schwartz 2002; Curriero et al. 2002).
8 union of concerned scientistsFIGURE 3. How Heat Affects Our Bodies
Head Mouth
• headache • intense thirst
• dizziness • dry mouth
• irritability
• loss of coordination
• confusion
Heart
• rapid heartbeat
• delirium
• irregular heartbeat
• anxiety
• reduced bloodflow to the heart
• loss of consciousness
• heart attack
• seizures
• stroke
• coma Lungs
• increased breathing rate
• worsened allergies and asthma
• worsened chronic obtrusive
Liver
pulmonary disease
• liver injury
Kidneys Arms and Legs
• heat cramps
• kidney disease
• muscle spasms
• kidney failure
• weakness
Skin
• flushed and clammy skin
• profuse sweating
General Physiology and Unique Circumstances
• heat rash
General Pregnant People
• dehydration • vomiting • fetal nutrition
• electrolyte • drop in deficits
imbalance blood pressure • preterm delivery
• fatigue • fever and birth
• nausea • stillbirth
When temperature and humidity climb during extreme heat events, the body’s cooling mechanisms become less effective. The symptoms
shown here—ranging from minor annoyances to truly life-threatening issues—include both those that are indicative of heat-related illness
and those that are signs of pre-existing conditions exacerbated by extreme heat.
SOURCES: BASU ET AL. 2012; BECKER AND STEWARD 2011; CURRIERO ET AL. 2002; DONOGHUE ET AL. 1997; GARCÍA-TRABANINO ET AL. 2015; GLAZER 2005;
LUBER AND MCGEEHIN 2008; LUGO-AMADOR, ROTHENHAUS, AND MOYER 2004; AND SEMEZA ET AL. 1999.
Child Bodies Elderly Bodies
Infants and small children are among the most susceptible People aged 65 and older—and especially 75 and up—have an
to heat-related illness. As temperatures climb, smaller bod- elevated risk of heat-related illness relative to younger adults
ies lose water at a faster rate than larger bodies do, which (Basu et al. 2012). Extreme heat is associated with increases
can lead to dehydration (Stillman 2019; Li et al. 2015). in cardiovascular and respiratory-related deaths among older
Physiologically, children have a higher ratio of body surface adults (Bunker et al. 2016; Anderson and Bell 2011; Åström,
area to mass and a lower total sweating rate compared with Forsberg, and Rocklöv 2011). For seniors, illnesses and medica-
adults (Rowland 2008; Bar-Or 1994). The latter can lead to tions can also slow the body’s cooling mechanisms (Stöllberger,
a slow acclimatization to heat. Children are also less likely Lutz, and Finsterer 2009). Although the increased use of air-
to read their body cues and know they need to rehydrate conditioning by elderly US residents has reduced their rates of
(Rosman 2017). Extreme heat can also increase the incidence heat-related deaths, the percentage of elderly individuals in the
of allergy attacks, electrolyte imbalance, fever, and kidney United States is increasing, which means more vulnerable indi-
disease in children (Xu et al. 2012). viduals are being exposed to dangerous heat (Barnett 2007).
Killer Heat in the United States 9AP Photo/Daily News, Miranda Pederson
Children cool off in a stream of water from a fire hydrant in Bowling Green, Kentucky, in 2011. As extreme heat becomes increasingly frequent and dangerous, outdoor
play could be severely curtailed or require a level of risk management all but inconceivable in much of the country today.
Bodies with Special Conditions and Needs rates and deaths (Schmeltz and Gamble 2017; Hansen
et al. 2008).
People with medical conditions, both physical (such as respi- Exposure to extreme heat can cause complications for
ratory or cardiovascular disease) and psychiatric, have an pregnant women and their developing babies (Basu, Sarovar,
increased risk of heat-related death (Bouchama et al. 2007). and Malig 2016; Basu, Malig, and Ostro 2010). Heat-induced
In fact, many commonly prescribed medications inhibit the dehydration during pregnancy can reduce blood flow to the
body’s ability to regulate its temperature (Westaway et al. uterus, which can lead to premature labor and delivery. It can
2015). Being confined to bed or home, depending on the care also reduce blood flow to the placenta, which can lead to fetal
of another person, or not understanding the need for water nutrition deficiencies. In turn, stillbirths can result. An asso-
or cooling also significantly increases the risk of heat-related ciation between exposure to heat and both preterm delivery
death (Bouchama et al. 2007). Underlying mental health and stillbirths has been found among younger mothers, likely
disorders in combination with alcohol or substance abuse can reflecting the effects of lower socioeconomic status (Basu,
also contribute to higher heat-related-illness hospitalization Sarovar, and Malig 2016; Basu, Malig, and Ostro 2010).
Infants and small children, elderly
adults, and people with medical
conditions have an increased risk
of heat-related death.
10 union of concerned scientists[ Chapter 4 ]
Findings: The Future of Dangerously Hot Days
In this analysis we calculate the number of days per year with (UNFCCC 2015). Results for this scenario are presented
heat index values above 90°, 100°, and 105°F—as well as the alongside late-century results for other emissions sce-
number of off-the-charts days, when conditions fall outside narios, as this warming threshold could be reached dur-
the range of the current heat index formulation—between ing a range of years in the second half of the century.9
now and the end of the century. The numbers presented
here represent the average over 30-year periods—a histori-
cal baseline (1971–2000), midcentury (2036–2065), and late
FIGURE 4. Future Warming Depends on Our Emissions
century (2070–2099)—and the average of 18 independent
Choices
climate models.7 We present results nationally, by region, by
state, and by “urban area,” defined as a city with more than
50,000 people (US Census Bureau 2019). We calculated the 35
Gigatons of Carbon per Year
No Action (7.7°F/4.3°C)
number of people exposed to extreme heat conditions based
30 Slow Action (4.3°F/2.4°C)
on 2010 population statistics and assume no growth in popu-
Rapid Action (3.6°F/2°C)
lation or change in distribution (CIESIN 2017; US Census
25 Historical
Bureau 2010a).
Our analysis includes three scenarios associated with 20
different levels of global heat-trapping emissions and future
warming (Van Vuuren et al. 2011) (Figure 4): 15
1. A “no action” scenario,8 in which heat-trapping emis- 10
sions continue to rise throughout the 21st century and
global average temperatures warm by nearly 8°F (4.3°C) 5
above pre-industrial levels by the year 2100. This sce-
0
nario is consistent with our current and historical emis- 2000 2020 2040 2060 2080 2100
sions growth. -5
Year
2. A “slow action” scenario, in which heat-trapping emis-
sions start to decline at midcentury. This scenario proj- The growth or reduction of global heat-trapping emissions in the
ects a most likely warming of 4.3°F (2.4°C) globally by the coming decades will determine how much more frequent extreme
year 2100. heat events will become in the United States. This analysis examined
three scenarios: “no action,” “slow action,” and “rapid action” to
3. A “rapid action” scenario, in which future global average reduce global emissions.
warming is limited to 3.6°F (2°C) above pre-industrial SOURCES: LE QUÉRÉ ET AL. 2015; IIASA 2009.
temperatures, as prescribed by the 2015 Paris Agreement
Killer Heat in the United States 11If we take no action and global heat-trapping emissions midcentury. And by late century, few refuges from extreme
continue to rise unabated, as they have in recent decades, heat will remain (see Table 1). Yet this future—in which sum-
our findings indicate that, across broad swaths of the United mer becomes a time when being outside is dangerous—is not
States, extreme heat conditions once measured in days per inevitable. Our findings show that with rapid action to reduce
year would need to be measured in weeks or months by emissions, many places can avoid prolonged, dangerous heat.
If we take no action and global heat-
trapping emissions continue to rise
unabated, by late century, few refuges
from extreme heat will remain.
TABLE 1. Extreme Heat Will Become More Frequent and More Severe in All Regions of the Country 10
Heat Index Mid North N. North South S. South
Time Period Scenario Threshold west east Plains west east Plains west US
Historical - 90°F 25 13 13 6 69 71 37 41
Midcentury No Action 90°F 62 40 36 20 113 109 60 69
Midcentury Slow Action 90°F 54 32 31 16 105 102 54 63
Late Century No Action 90°F 90 70 57 37 140 134 84 93
Late Century Slow Action 90°F 63 39 37 21 113 109 60 70
9
– Rapid Action 90°F 56 34 32 17 107 104 56 65
Historical - 100°F 6 3 3 1 15 21 23 14
Midcentury No Action 100°F 30 14 12 4 65 61 24 36
Midcentury Slow Action 100°F 22 10 8 3 51 51 22 30
Late Century No Action 100°F 53 32 24 11 96 88 35 54
Late Century Slow Action 100°F 27 12 10 4 60 57 24 34
– Rapid Action 100°F 22 10 8 3 52 52 22 31
Historical 105°F 3 2 2 0 4 7 13 5
Midcentury No Action 105°F 17 8 6 2 40 39 17 24
Midcentury Slow Action 105°F 12 5 4 1 27 30 17 18
Late Century No Action 105°F 38 20 14 5 73 66 22 40
Late Century Slow Action 105°F 15 7 5 2 34 35 17 22
– Rapid Action 105°F 12 5 4 1 27 30 18 19
Historical - Off the Charts 0 0 0 0 0 0 2 0
Midcentury No Action Off the Charts 2 1 1 1 3 3 8 3
Midcentury Slow Action Off the Charts 2 1 1 0 2 2 6 2
Late Century No Action Off the Charts 7 3 3 2 12 12 10 9
Late Century Slow Action Off the Charts 2 1 1 1 2 3 7 3
– Rapid Action Off the Charts 2 1 1 0 2 2 7 2
As heat-trapping emissions rise, each region of the country is projected to experience an increase in the average number of days per year with
heat above the thresholds analyzed in this study.
12 union of concerned scientistsMidcentury Results (2036–2065) out their retirements and many of today’s children will raise
families.
THE NATION, WITH NO ACTION TO REDUCE EMISSIONS Nationwide, with no action, the average number of days
per year with a heat index above the 90°F threshold would
Across the United States, with few exceptions, the frequency increase by 70 percent from a historical baseline of 41 to 69.
and geographic range of extremely high heat index days The number of days with a heat index above the heat advi-
would increase markedly by midcentury if we take no action sory threshold of 100°F would increase, from 14 historically
to reduce emissions (Figure 5). Midcentury reflects the time to 36. The number of days above the NWS excessive heat
frame in which many of today’s working-age adults will live warning threshold of 105°F would more than quadruple,
storical Historical
Mid-century Slow Action Scenario Mid-century Slow
Mid-century NoAction
ActionScenario
HistoricalScenario Mid-century No Action
Mid-century Slow Scenario
Action Scenario Mid-century
storical FIGURE 5. Extreme Heat
Mid-century by Midcentury
Historical
Slow Becomes
Action Scenario More Frequent
Mid-century
Mid-century
Slow
No and
Historical
Action
Action WidespreadMid-century
Scenario
Scenario Mid-century
No Action
Slow Scenario
Action Scenario Mid-century
storical Mid-century Slow Action Scenario
Historical Mid-century
Mid-century No
Slow ActionScenario
Historical
Action Scenario Mid-century
Mid-century Slow Scenario
No Action Action Scenario Mid-century
storical Mid-century Slow Action Scenario
Historical Mid-century
Mid-century No
Slow ActionScenario
Scenario
Historical
Action Mid-century
Mid-century
No Action
Slow Scenario
Action Scenario Mid-century
Historical Midcentury No Action Midcentury Slow Action
> 90 F > 90 F
> 90 F > 90 F
> 90 F > 90 F
> 90 F
90°F+ > 90 F
> 100 F > 100 F
> 100 F > 100 F
100°F+
> 100 F > 100 F
> 100 F > 100 F
> 105 F > 105 F
> 105 F
105°F+ > 105 F
> 105 F > 105 F
> 105 F > 105 F
Late Century Slow Action Late Century No Action Late Century Rapid Action
>90°F
>100°F
Off the
Charts
Off >105°F Off
the
Off the
Off
Charts
the Charts
the
Off
Off
Charts
the Off the Charts
the
Off Charts Off
Charts
the Charts
the
Charts Charts
per year Average
average days Days per
per yearYear 0–1 average
>1–10 days per year
>10–25 >25–50 >50–100 >100–200
per year average days per year average days per year
per yearBy midcentury 0-1 0-1
average daysregions
(2036–2065), per year average
of the United States with little to nodays per
extreme year
heat in an average year historically—such as the upper
0 - 1
per yearMidwest and
average >1 -days per year
New England—would
10 heat on0>1a- -1days
begin to experience suchaverage per
regular
10 year
basis. Heat conditions across the Southeast and Southern Great
0-1 0-1
Plains regions are projected
>1 - 10 to become increasingly oppressive, with>1
off-the-charts
- 10 days happening an average of once or more annually.
> -10
0 1 - 25 0
> -10
1 - 25
>1 - 10 >1 - 10
> 10 - 25 > 10 - 25
> 25
>1 - 50
- 10 >1
> 25- 10
- 50
> 10 - 25 > 10 - 25
> 25 - 50 > 25 - 50
50 - 25
> 10 100 > 10
50 - 25
100
> 25 - 50 > 25 - 50
> 50 - 100 > 50 - 100 Killer Heat in the United States 13
4 100- -50
> 25 214 > 25
100- -50
214
> 50 - 100 > 50 - 100
4 > 100 - 214 > 100 - 214
4 > 50 - 100 > 50 - 100
> 100 - 214 > 100 - 214FIGURE 6. Millions More People Will Face Extreme Heat by Midcentury
350
Current Population
Millions of People
300
250
Exposed
200
150
100
50
0
Historical No Action Slow Action
90°F+ 100°F+ 105°F+ Off the Charts
Taking no action or slow action to reduce global heat-trapping emissions would expose millions more US residents to an average of seven or
more days per year of extreme heat index conditions by midcentury, even when assuming no changes in population.
from 5 historically to 24. Whereas off-the-charts conditions Historically, 29 of 481 US urban areas have experienced
occurring once a year or more have historically affected less 30 or more days with a heat index above 100°F. With no
than 1 percent of the country by area, more than 36 percent action to reduce heat-trapping emissions, that number would
of the country by area would experience such conditions, on rise to 251 cities by midcentury and include places that have
average, once a year or more in this time frame. not historically experienced such frequent extreme heat,
As extreme heat grips more of the country, growing such as Cincinnati, Ohio; Omaha, Nebraska; Peoria, Illinois;
numbers of people would be exposed to dangerous conditions Sacramento, California; Washington, DC; and Winston-Salem,
(Figure 6). Based on 2010 population data, and assuming North Carolina (see Figure 7, p. 15). Nearly one-third of all
no changes in population size or distribution, the number urban areas—152 out of 481—would experience an average of 30
of people in the United States exposed to an average of 30 or more days per year with a heat index above 105°F, compared
or more days per year with a heat index above 105°F would with just three historically. Cities have unique land surface
increase roughly 100-fold, from just under 900,000 histori- properties that tend to make them hotter than the surrounding
cally to more than 90 million—or roughly 30 percent of the areas—a phenomenon known as the urban heat island effect.
population—in the no action scenario.11 Historically, all of Because that effect is not included in the models used in this
the people exposed to the equivalent of a week or more of analysis, these statistics for cities experiencing extreme heat
off-the-charts conditions in an average year (more than 1,900) index days likely underestimate the scale of the problem.
would fit into a large theater. By midcentury, more than 6 mil-
lion people—equivalent to roughly the entire population of THE NATION, WITH SLOW ACTION TO REDUCE EMISSIONS
Missouri—would experience such conditions.
With slow action to reduce heat-trapping emissions, most
of the contiguous United States would face frequencies of
extreme heat far higher than those of today (Figure 5, p. 13).
Rapid action to reduce However, the frequency of high heat index days would be
between 9 and 23 percent lower than with no action, as out-
global emissions could make lined above. Slow action would lead to an average of 18 days
a significant difference in per year with a heat index above 105°F, about five fewer
than projected with no action. With this scenario, more than
exposure to extreme heat 30 million people would avoid exposure to 30 or more days
with a heat index above 105°F (Figure 6, p. 14), and 84 urban
by midcentury. areas would be exposed to that frequency of heat—compared
14 union of concerned scientistsFIGURE 7. Urban Areas Face Frequent, Extreme Heat by Midcentury
Midcentury No Action Midcentury Slow Action
Cities Experiencing Heat Index >105°F
More than 30 Days per Year
More than 30 Days per Year, Historically
Fewer than 30 Days per Year
Historically, only three of 481 urban areas (cities with populations of 50,000 or more) in the contiguous United States have experienced
30 or more days per year with a heat index above 105°F. With slow action to reduce global emissions, more than 80 urban areas would
experience these conditions by midcentury. And with no action, more than 150 urban areas would.
with 152 with no action (Figure 7). These findings show that of the Northeast would experience such conditions. In
emissions choices make a difference even in this time frame; Maryland alone, more than 5 million people would be
that significant changes are still in store; and that faster, more exposed to such heat, 94 percent of the total population.
aggressive action to reduce emissions would be needed to
avoid those changes.
TABLE 2. Northeast Cities Face Steep Increases in Days
per Year Above 90°F by Midcentury
REGIONAL HIGHLIGHTS 10
Northeast. By midcentury, the Northeast is projected to No Slow
regularly experience extreme heat that has, historically, been Historical Action Action
rare. Connecticut, Massachusetts, and Rhode Island, for Bangor, ME 3 24 16
example, have historically averaged seven to 10 days per year
Boston, MA 11 41 32
with a heat index above 90°F. By midcentury, with no climate
Burlington, VT 5 30 22
action, these New England states can expect the equivalent of
four to six weeks of such conditions, on average, each year (see Dover, NH 11 40 32
Table 2 for findings about select cities). And while these states Hartford, CT 11 44 34
typically don’t experience days with a heat index higher than New York City, NY 16 51 41
100°F in the average year, by midcentury, with no action, they Pittsburgh, PA 11 53 42
are projected to experience an average of 10 to 13 such days Trenton, NJ 24 65 55
per year, and four to five days with a heat index above 105°F.
Populous cities in the Northeast, including the sampling shown here,
In an average year, historically, no Northeast residents
are projected to experience a doubling or more of the number of days
have experienced 30 days with a heat index above 100°F. per year with a heat index above 90°F between now and midcentury
With no climate action, and assuming no population growth with no action or slow action to reduce global heat-trapping emissions.
or change in where people live, more than 11 million residents
Killer Heat in the United States 15TABLE 3. Southeast and Southern Great Plains Cities
Will Face Many More Days per Year with a Heat Index
Above 105°F by Midcentury
No Slow
Historical Action Action
Austin, TX 5 59 42
Baton Rouge, LA 5 57 37
Anthony Behar/Sipa Press via AP Images
Columbia, SC 5 37 24
Jackson, MS 6 52 36
Montgomery, AL 4 44 29
Oklahoma City, OK 4 43 29
Raleigh, NC 3 26 16
Tallahassee, FL 5 50 32
In regions where extreme heat occurs infrequently today, such as the Northeast, Historically, cities in the Southeast and Southern Great Plains
air-conditioning of homes and workplaces is not universal. This and other regions have experienced fewer than a week’s worth of days with a
factors have led some cities, including New York City, shown here in 2011, to
heat index above 105°F in an average year. With no action or
issue heat advisories at a lower heat index than recommended by the National
Weather Service. slow action to reduce global heat-trapping emissions, the sampling
of cities shown here would experience at least quadruple the number
of such days by midcentury.
With slow action to reduce emissions, the states in this
region would experience one-third fewer days with heat
index conditions above 100°F or 105°F, compared with the
each state. While none of these states have experienced off-
no action case. Perhaps most strikingly, slow action would
the-charts conditions historically, each is projected to experi-
reduce the number of people exposed to 30 or more days
ence an average of between two and four such days annually
with a heat index above 100°F to fewer than 1 million, sparing
by midcentury.
10 million people per year from exposure to such conditions.
Assuming no growth in population and no change in
Southeast and Southern Great Plains. The Southeast and where people live, more than 17 million people in Florida
Southern Great Plains are some of the hottest parts of our and roughly 23 million people in Texas would be exposed
country today. But future warming will make extreme heat to an average of 30 or more days per year with a heat index
in these regions even more frequent and severe. With no cli- above 105°F with no action to reduce emissions. Historically,
mate action, states across the Southeast and Southern Great fewer than 50,000 people have been exposed to such frequent
Plains regions—including Arkansas, Louisiana, Oklahoma, extreme heat in both states combined.
and Texas—are projected to undergo more than a tripling in Compared with the no action scenario, slow action to
the average frequency of days with a heat index above 100°F, reduce emissions would reduce the number of days per year
from the current 20 to 30 days per year to the equivalent of with a heat index above 100°F or above 105°F by an aver-
two to three months per year (see Table 3 for findings about age of two to three weeks per year in Arkansas, Louisiana,
select cities). The average frequency of days with a heat index Oklahoma, and Texas—and by around three weeks per year in
above 105°F in these four states would increase seven-fold or Florida. Roughly 5 million fewer Floridians and half a million
more, from between five and nine days per year, historically, fewer Texans would be exposed to 30 or more days with a
to six to nine weeks per year. Florida is projected to experi- heat index above 105°F.
ence some of the highest frequencies of extreme heat in the
nation—in an average year and averaged across the state,
105 days with a heat index over 100°F (up from just 25 days
historically) and 63 days with a heat index over 105°F.
Florida could experience
The number of days with a heat index topping 120°F— as many as 105 days with
which historically have not occurred in these states—would
rise to an average of between two and five days per year for a heat index over 100°F.
16 union of concerned scientistsLate-Century Results (2070–2099)
number of days with a heat index above 105°F, compared with
the historical baseline (Figure 8). With this scenario, nearly
THE NATION, WITH NO CLIMATE ACTION
two-thirds of the country would experience off-the-charts
With no action to reduce heat-trapping emissions, the conditions at least once per year, on average.
country would experience a two-fold increase in the average Compared with the historical average, the number of
number of days with a heat index above 90°F; a four-fold people exposed to multiple days with a heat index above
increase in the average number of days per year with a heat 105°F by late century would be staggering, assuming no
index above 100°F; and a nearly eight-fold increase in average growth in population or change in where people live
Action Scenario Late Late
century
century
No Action
Slow Scenario
Action Scenario Late
Rapid
Late
century
Action
century
Slow
Scenario
No
Action
Action
Scenario
Scenario Late century
RapidNo
Action
Action
Scenario
Scenario Rapid Acti
FIGURE 8. Frequency
Action Scenario Late Late ofNo
century Extreme
century
Action HeatScenario
Slow Scenario
Action by Late Century
Late
Rapid
LateDepends
century
Action
century
Slow on the
Scenario
No
Action
Action Choices WeLate
Scenario
Scenario Make century
RapidNo
Action
Action
Scenario
Scenario Rapid Acti
Action Scenario Late Late
century
century
No Action
Slow Scenario
Action Scenario Late
Rapid
Late
century
Action
century
Slow
Scenario
No
Action
Action
Scenario
Scenario Late century
RapidNo
Action
Action
Scenario
Scenario Rapid Acti
Action Scenario Late Late
century
century
No Action
Slow Scenario
Action Scenario Late
Rapid
Late
century
Action
century
Slow
Scenario
No
Action
Action
Scenario
Scenario Late century
RapidNo
Action
Action
Scenario
Scenario Rapid Acti
Late Century No Action Late Century Slow Action Late Century Rapid Action
> 90 F > 90 F
> 90 F > 90 F
> 90 F > 90 F
90°F+ 90 F
> > 90 F
> 100 F > 100 F
> 100 F > 100 F
100°F+> 100 F > 100 F
> 100 F > 100 F
> 105 F > 105 F
105°F+> 105 F > 105 F
> 105 F > 105 F
> 105 F > 105 F
Late Century Slow Action Late Century No Action Late Century Rapid Action
>90°F
>100°F
Off the
Charts
Off
>105°F Off
the
Off the
Off
Charts
the Charts
the
Off Off
Off the
Charts Charts
the
Off the
Off
Charts
Charts
the Charts
the
Charts Charts
r year Average Days
average daysper
per Year
year 0–1average>1–10
days >10–25
per year >25–50 >50–100 >100–200
r year average days per year average days per year
The emissions choices we0make- 1 in the coming decades will profoundly
0 - 1 shape the frequency and severity of extreme heat later this century.
r year average days per year average days per year
With no action to reduce0global
- 1 emissions, the contiguous United
0 -States
1 would face an average of twice as many days with a heat index above
r year average
105°F in late century -days
as it>1would
10 perrapid
with yearaction. average >1 -days
10 per year
0-1 0-1
>1 - 10 >1 - 10
> -10
0 1 - 25 > -10
0 1 - 25
>1 - 10 >1 - 10
> 10 - 25 > 10 - 25
> 25
>1 - 50
- 10 > 25
>1 - 50
- 10
> 10 - 25 > 10 - 25
> 25 - 50 > 25 - 50
50 - 25
> 10 100 50 - 25
> 10 100
> 25 - 50 > 25 - 50 Killer Heat in the United States 17
> 50 - 100 > 50 - 100
> 25
> 100- -50
214 > 25
> 100- -50
214
> 50 - 100 > 50 - 100
> 100 - 214 > 100 - 214
> 50 - 100 > 50 - 100You can also read