Euro Health Consumer Index 2016
←
→
Page content transcription
If your browser does not render page correctly, please read the page content below
Euro Health
Consumer Index   2016
                        i
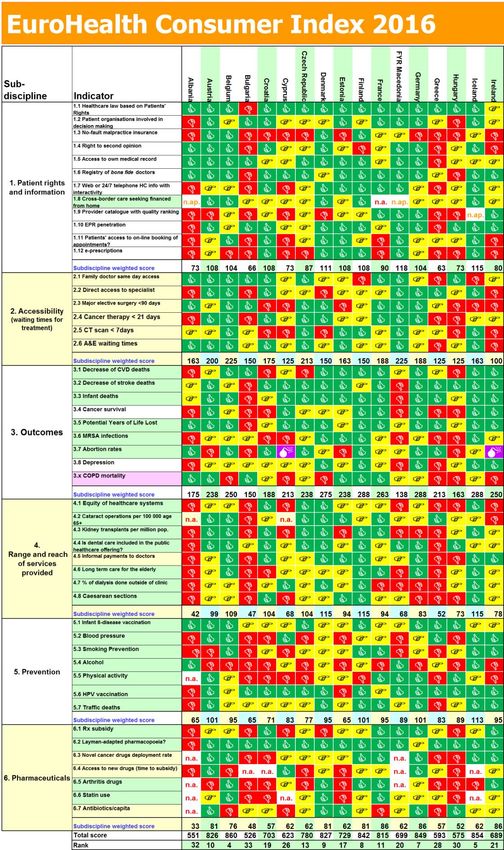
Euro Health Consumer Index 2016

The Green countries on the map
 on the front cover are scoring
 >800 on the 1000-point scale.
Red are countries scoring
Euro Health Consumer Index 2016

        Health Consumer Powerhouse

  Euro Health Consumer Index
                           2016
                          Report

          Professor Arne Björnberg, Ph.D
        arne.bjornberg@healthpowerhouse.com

          Health Consumer Powerhouse
                      2017-01-30
               Number of pages: 100

This report may be freely quoted, referring to the source.
       © Health Consumer Powerhouse Ltd., 2017.
                ISBN 978-91-980687-5-7

                                                                      3
Euro Health Consumer Index 2016

Contents
EUROPEAN HEALTHCARE SUCCESS CHALLENGES EVALUATION ................................................................ 5
1. SUMMARY............................................................................................................................................ 6
    1.1 GENERAL OBSERVATIONS – EUROPEAN HEALTHCARE IMPROVING........................................................................ 6
    1.2 COUNTRY PERFORMANCE............................................................................................................................ 6
    1.3 COUNTRY ANALYSIS OF THE 35 COUNTRIES ..................................................................................................... 8
    1.4 LESS WEALTHY COUNTRIES ON THE RECOVERY FROM FINANCIAL CRISIS? ............................................................. 21
    1.5 BBB; BISMARCK BEATS BEVERIDGE – NOW A PERMANENT FEATURE ................................................................. 22
2. INTRODUCTION .................................................................................................................................. 23
    2.1 BACKGROUND ........................................................................................................................................ 24
    2.2 INDEX SCOPE .......................................................................................................................................... 25
    2.3 ABOUT THE AUTHOR ................................................................................................................................ 25
3. RESULTS OF THE EURO HEALTH CONSUMER INDEX 2016 ................................................................... 26
    3.1 RESULTS SUMMARY ................................................................................................................................. 28
4. BANG-FOR-THE-BUCK ADJUSTED SCORES ........................................................................................... 32
    4.1 BFB ADJUSTMENT METHODOLOGY ............................................................................................................. 32
    4.2 RESULTS IN THE BFB SCORE SHEET ............................................................................................................. 33
5. TRENDS OVER THE 10 YEARS .............................................................................................................. 34
    5.1 SCORE CHANGES 2006 - 2016 .................................................................................................................. 34
    5.2 HEALTHCARE QUALITY MEASURED AS OUTCOMES ......................................................................................... 36
    5.3 TRANSPARENT MONITORING OF HEALTHCARE QUALITY ................................................................................... 38
    5.4 LAYMAN-ADAPTED COMPREHENSIVE INFORMATION ABOUT PHARMACEUTICALS ................................................... 39
    5.5 WAITING LISTS: A MENTAL CONDITION AFFECTING HEALTHCARE STAFF?............................................................ 39
    5.6 WHY DO PATIENTS NOT KNOW? ................................................................................................................. 43
    5.7 MRSA SPREAD ....................................................................................................................................... 43
6. HOW TO INTERPRET THE INDEX RESULTS? ......................................................................................... 44
7. EVOLVEMENT OF THE EURO HEALTH CONSUMER INDEX.................................................................... 45
    7.1 SCOPE AND CONTENT OF EHCI 2005.......................................................................................................... 45
    7.2 SCOPE AND CONTENT OF EHCI 2006 – 2014 .............................................................................................. 45
    7.3 EHCI 2016 ........................................................................................................................................... 46
    7.4 INDICATOR AREAS (SUB-DISCIPLINES)........................................................................................................... 47
    7.5 SCORING IN THE EHCI 2016 ..................................................................................................................... 47
    7.6 WEIGHT COEFFICIENTS ............................................................................................................................. 48
    7.7 INDICATOR DEFINITIONS AND DATA SOURCES FOR THE EHCI 2016 ................................................................... 50
    7.8 THRESHOLD VALUE SETTINGS ..................................................................................................................... 56
    7.9 “CUTS” DATA SOURCES ........................................................................................................................... 57
    7.10 CONTENT OF INDICATORS IN THE EHCI 2016 ............................................................................................. 58
    7.11 EXTERNAL EXPERT REFERENCE PANEL ......................................................................................................... 98
8. REFERENCES ....................................................................................................................................... 99
    8.1 MAIN SOURCES....................................................................................................................................... 99
APPENDIX 1. THE TRUE SAGA ABOUT WERNER’S HIP JOINT, OR WHAT WAITING TIMES SHOULD BE IN
ANY HEALTHCARE SYSTEM ................................................................................................................... 100
Euro Health Consumer Index 2016

European healthcare success challenges evaluation
In times of pessimism and disillusion there is a need for functions of society which work
and deliver. In Europe, healthcare is such an asset. It gets better with every year,
saving lives, curing disease and strengthening quality of life among the public. And, in
the era of Trumpism, largely, it is affordable to almost all Europeans.
This is not the same as claiming that everybody gets the care they need or that
healthcare is a well-oiled, faultless wonder. But as the Euro Health Consumer Index
(EHCI) has shown for more than ten years, the publicly funded healthcare systems of
Europe have steadily improved. The Index scale is a way to measure to what extent
each one of the 35 countries meet expectations of good, consumer-friendly healthcare.
In the 2008 EHCI the champion country scored 84 %; 2016 the winner scores no less
than 93 %, with 11 countries scoring above 80 %. In the low end there is a similar
development, from the 45 to 50 percent score level (meaning, sadly, that the
performance gap between old and newer EU members remain). The whole block of 35
countries advances.
In the Index report there are numerous examples of the successful improvement of
systems performance. There is great potential of further progress, at least if mutual
cross-border learning potential accelerates:
• What would it mean to shorter waiting, cost of queuing and personal inconvenience if
  many more countries offered the same prompt access to care as Belgium or the FYR
  Macedonia?
• With prevention still a largely unexploited resource for better health and care,
  imagine if Norway, the leader in this EHCI sub-discipline, could set the standard to
  copy and implement around our continent?
• As more and more countries get close to reaching the Index ceiling for treatment
  outcomes it seems that not only big spenders but as well medium wealth countries
  such as Finland, Iceland, the Czech Republic and Slovenia have found cost-efficient
  solutions for inspiration.
Value-for-money health systems are in the international searchlight. What will be
affordable and sustainable to countries with aging populations, funding deficits and
shortage of workforce? This is a tough nut to crack to national governments as well as
to the European Commission and the OECD. We dare say that there is today enough
knowledge to repair failing systems - but is there enough determination?
The ongoing progress of performance requires not only a more challenging scoreboard
but as well a new approach re. what indicators can grasp the full potential of modern
healthcare. The EHCI (and additional HCP measurements) will have to develop with the
changing face of healthcare. 2017 will be the year of re-designing the EHCI. Read more
about this process on www.healthpowerhouse.com – and welcome to tell us how you
think we ought to proceed!
Johan Hjertqvist
HCP Founder & President

The EHCI 2016 was produced with no outside financial support, i.e. 100% of the costs
were borne by the Health Consumer Powerhouse, Ltd.

                                                                                       5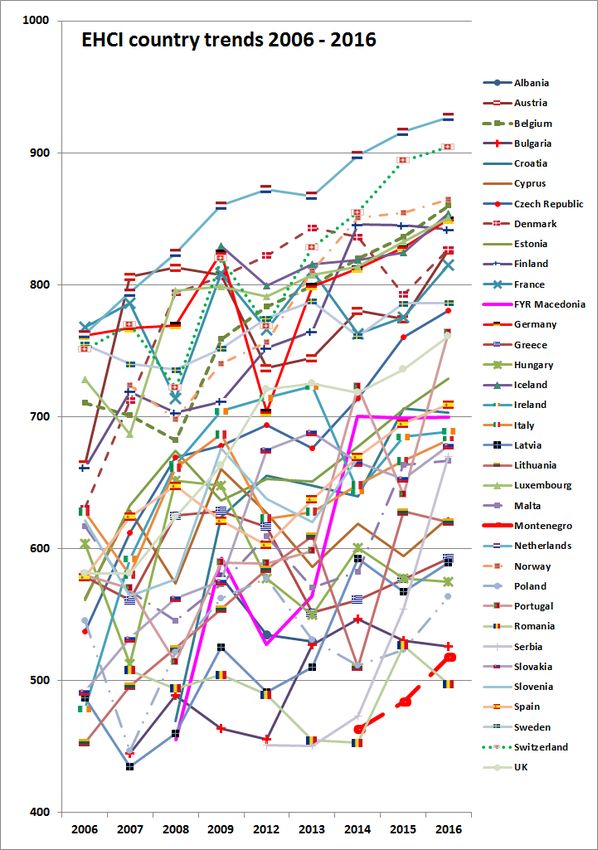
Euro Health Consumer Index 2016

1. Summary
The Euro Health Consumer Index 2016 is only a partial update of the 2015 edition. This
is for two main reasons:
   A) The EHCI 2016 has been produced with no external financial support, i.e. with
      the expense covered entirely by the Health Consumer Powerhouse.
   B) The continuous improvement of healthcare service performance (also right
      through the “financial crisis” triggered in 2008) has made some indicators and or
      score cut-off values obsolete and/or indistinctive.
       In spite of financial crisis-induced austerity measures, such as the much
       publicized restrictions on the increase of healthcare spend, European healthcare
       keeps producing better results. Survival rates of heart disease, stroke and cancer
       are all increasing, even though there is much talk about worsening lifestyle
       factors such as obesity, junk food consumption and sedentary life. Infant
       mortality, perhaps the most descriptive single indicator, also keeps going down,
       and this can be observed also in countries such as the Baltic states, which were
       severely affected by the financial crisis.
       This means that the next EHCI edition will have to sacrifice longitudinal analysis,
       by doing a combination of inventing a number of new, more challenging
       indicators, and by raising the cut-off limits between Red/Yellow/Green scores:
       “Internet pharmacopoeias” existed in only two countries (Sweden and Denmark)
       when the EHCI was started – today, almost every country has them. Infant
       mortality when first introduced had 9 countries scoring Green – today, 24
       countries do that, with the same limit of less than 4 deaths per 1000 births for a
       Green. Similar observations can be made for many indicators.

1.1 General observations – European healthcare improving
11 countries (up from 8 in 2015), all Western European, are scoring above 800 points of
the maximum 1000. The first CEE country, the Czech Republic, keeps closing in, now
only 6 points behind Sweden in 12th place.

1.1.1 Why is there no correlation between accessibility to healthcare and
money spent?
Answer: Because it is inherently cheaper to run a healthcare system without waiting lists
than having waiting lists! Contrary to popular belief, not least among healthcare
politicians, waiting lists do not save money – they cost money!
Healthcare is basically a process industry. As any professional manager from such an
industry would know, smooth procedures with a minimum of pause or interruption is key
to keeping costs low!

1.2 Country performance
The EHCI 2016 total ranking of healthcare systems shows The Netherlands holding out
against the onslaught of Switzerland; the Swiss 904 points would have meant a very
comfortable victory in the EHCI as late as 2014. However, the Netherlands, in 2015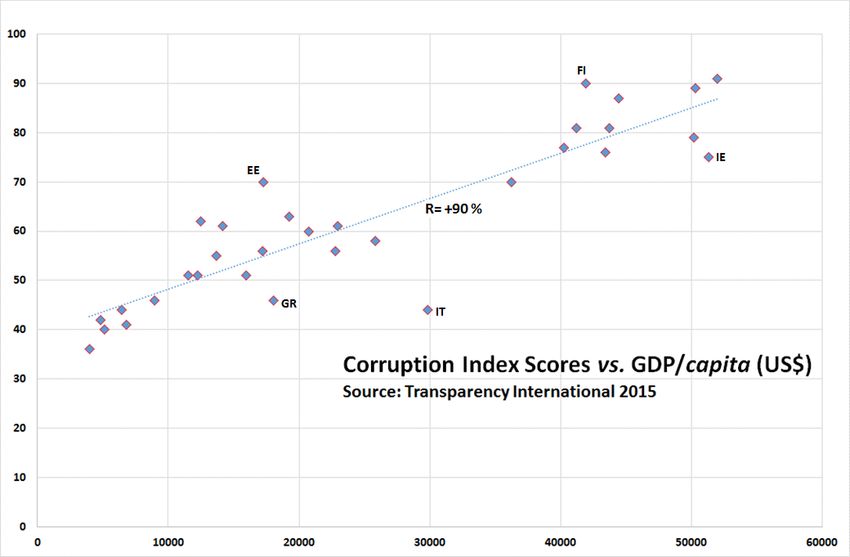
Euro Health Consumer Index 2016

breaking the 900-point barrier for the first time in the EHCI, is clinging on to the top
position by scoring 927 points!
The changes in rank should not at all be dismissed as an effect of changing indicators,
of which there are 48 in the EHCI 2016, the same indicators as in the previous year. The
Netherlands is the only country which has consistently been among the top three in the
total ranking of any European Index the Health Consumer Powerhouse (HCP) has
published since 2005. The Netherlands is sub-discipline winner, or joint winner, in three
of the six sub-disciplines of the EHCI 2016. The Dutch healthcare system does not seem
to have any really weak spots, by 2016 having made improvement regarding the waiting
times situation, where some central European states excel. Normally, the HCP takes care
to state that the EHCI is limited to measuring the “consumer friendliness” of healthcare
systems, i.e. does not claim to measure which European state has the best healthcare
system across the board.
However, the fact that it seems very difficult to build an Index of the HCP type without
ending up with The Netherlands on the medallists’ podium, creates a strong temptation
to actually claim that the winner of the EHCI 2016 could indeed be said to have “the
best healthcare system in Europe”. There should be a lot to learn from looking deeply
into the Dutch progress!
Switzerland has for a long time had a reputation for having an excellent, although
expensive, healthcare system, and it therefore comes as no surprise that the more
profound research which eliminated most n.a. scores results in a prominent position in
the EHCI.
Bronze medallists are Norway at 865 points; the very high per capita spend on
healthcare services finally paying off, but losing most points on their totally inexplicable
waiting list situation!
Belgium (4th, 860 points) seems to have got its act together on Outcomes quality and
monitoring/reporting of results, which in combination with what might be the best
accessibility to healthcare services anywhere in Europe
Denmark (9th, 827 points, which is 34 points more than was good for the same rank in
2015!) did gain a lot from the introduction of e-Health indicators. None the less, as can
been seen from the longitudinal analysis in Chapter 5.1, Denmark has been on a
continuous rise since it was first included in the EHCI 2006, until competition tightened
in 2014, and Denmark reduced access to Outcomes information and tightened the rules
for patient access to caregivers.
The Swedish score for technically excellent healthcare services is, as ever, dragged
down by the seemingly never-ending story of access/waiting time problems, in spite of
national efforts such as Vårdgaranti (National Guaranteed Access to Healthcare); in
2016, Sweden drops back to 12th place with 786 points, which were enough for 10th
place a year ago. Like most points lost (125 points less than Belgium or Switzerland) is
on Accessibility, where Sweden, Ireland and Poland have the lowest score among the 35
countries.
Portugal, 14th at 763 points, squeezes past the U.K. by a narrow margin – well done!
In southern Europe, Spain and Italy provide healthcare services where medical
excellence can be found in many places. Real excellence in southern European
healthcare seems to be a bit too much dependent on the consumers' ability to afford
private healthcare as a supplement to public healthcare. Also, both Spain and Italy show
large regional variation which tends to result in a lot of Yellow scores for these
countries.

                                                                                          7
Euro Health Consumer Index 2016

Some eastern European EU member systems are doing surprisingly well, particularly the
Czech Republic, Slovenia and Estonia, considering their much smaller healthcare spend
in Purchasing Power Parity (PPP) adjusted dollars per capita.
In 2014, the FYR Macedonia made the most remarkable advance in the EHCI scoring of
any country in the history of the Index, from 27th to 16th place, largely due to more or
less eliminating waiting lists by implementing their real time e-Booking system! This
situation seems to be sustainable in 2016, with a small drop to 20th place as other
countries improve.

1.3 Country analysis of the 35 countries
1.3.1 The Netherlands!!!
The Netherlands is the only country which has consistently been among the top three in
the total ranking of any European Index the Health Consumer Powerhouse has
published since 2005. The 2012 NL score of 872 points was by far the highest ever seen
in a HCP Index. The 927 points in 2016 are even more impressive, and underlines that
the EHCI 2017 will have to be more challenging in order to register differences.
The Netherlands have also scored 922 points in the Euro Diabetes Index 2014. That
score would normally have been a secure Gold medal – in the EDI, that was seized by
Sweden at 936 points on the power of having data on all indicators.
The NL wins four of the six sub-disciplines of the Index, and the large victory margin
seems essentially be due to that the Dutch healthcare system does not seem to have
any really weak spots, except possibly some scope for improvement regarding the
waiting times situation, where some central European countries excel.
Normally, the HCP takes care to state that the EHCI is limited to measuring the
“consumer friendliness” of healthcare systems, i.e. does not claim to measure which
European state has the best healthcare system across the board.
Counting from 2006, the HCP has produced not only the generalist Index EHCI, but also
specialist Indexes on Diabetes, Cardiac Care, HIV, Headache and Hepatitis. The
Netherlands are unique as the only country consistently appearing among the top 3 – 4,
regardless what aspects of healthcare which are studied. This creates a strong
temptation to actually claim that the landslide winner of the EHCI 2016 could indeed be
said to have “the best healthcare system in Europe”.

   1.3.1.1 So what are the Dutch doing right?
It has to be emphasized that the following discussion does contain a substantial amount
of speculation outside of what can actually be derived from the EHCI scores:
The NL is characterized by a multitude of health insurance providers acting in
competition, and being separate from caregivers/hospitals. Also, the NL probably has the
best and most structured arrangement for patient organisation participation in
healthcare decision and policymaking in Europe.
Also, the Dutch healthcare system has addressed one of its few traditional weak spots,
Accessibility, by setting up 160 primary care centres which have open surgeries 24 hours
a day, 7 days a week. Given the small size of the country, this should put an open clinic
within easy reach for anybody.
Here comes the speculation: one important net effect of the NL healthcare system
structure would be that healthcare operative decisions are taken, to an unusually high
degree, by medical professionals with patient co-participation. Financing agencies and
Euro Health Consumer Index 2016

healthcare amateurs such as politicians and bureaucrats seem farther removed from
operative healthcare decisions in the NL than in almost any other European country.
This could in itself be a major reason behind the NL victory in the EHCI 2008 – 2016.

      1.3.1.2 So what, if anything, are the Dutch doing wrong?
The NL scores well or very well in all sub-disciplines, except possibly Accessibility and
Prevention, where the score is more mediocre – on the other hand, so are those of most
other countries.
The “traditional” Dutch problem of mediocre scores for Waiting times has to a great
extent been rectified by 2016. As was observed by Siciliani & Hurst of the OECD in
2003/2004, and in the EHCI 2005 – 2016, waiting lists for specialist treatment,
paradoxically, exist mainly in countries having “GP gatekeeping” (the requirement of a
referral from a primary care doctor to see a specialist).
GP gatekeeping, a “cornerstone of the Dutch healthcare system” (said to the HCP by a
former Dutch Minister of Health and repeated in the Dutch parliament November 2014)
is widely believed to save costs, as well as providing a continuum of care, which is
certainly beneficial to the patient. As can be seen from the references given in Section
7.10.2 on indicator 2.2, there is no evidence to support the cost-reducing hypothesis.
Also, as can be seen in Section 4.1, the NL has risen in healthcare spend to actually
having the highest per capita spend in Europe, by 2014 close to what the HCP internally
calls “the three rich bastards”; Norway, Switzerland and Luxembourg, who have a GDP
per capita in a class of their own. This was observed already in the EHCI 2009.
By 2014, The Netherlands are at par with Sweden and Germany for healthcare spend!
This has been extensively treated in the EHCI 2013 report1.
The Dutch healthcare system is characterised by over-use of in-patient care (and
institutionalised psychiatric care and elderly care.
It seems that actual modes of operating the healthcare system in The Netherlands could
explain the high per capita healthcare spend, i.e. not the multi-payor model. If the
country can afford this, fine; but also for Outcomes and patient quality of life reasons, a
programme to reduce the share of in-patient care would be beneficial for the Dutch
healthcare budget! According to Dutch government sources, and presented at the Irish
Health Summit in May 2016, there is a strategy aimed at saving GEUR 12/year by
switching to less in-patient care.

1.3.2 Switzerland
Silver medallists, 904 points (up from 894).
Switzerland has enjoyed a solid reputation for excellence in healthcare for a long time.
Therefore it is not surprising that when the n.a.’s of previous EHCI editions have mainly
been eliminated, Switzerland scores high. Considering the very respectable money
ploughed into the Swiss healthcare system, it should! Along with Belgium, and now the
FYR Macedonia, the only country to score All Green on Accessibility.
In 2016, Switzerland is outdistancing a “hornets’ nest” of other Western European
Countries scoring above 800 points! Swiss healthcare has probably been this good also
before; the highly decentralised cantonal structure of the country has made data
collection difficult.

1   www.healthpowerhouse.com/files/ehci-2013/ehci-2013-report.pdf

                                                                                         9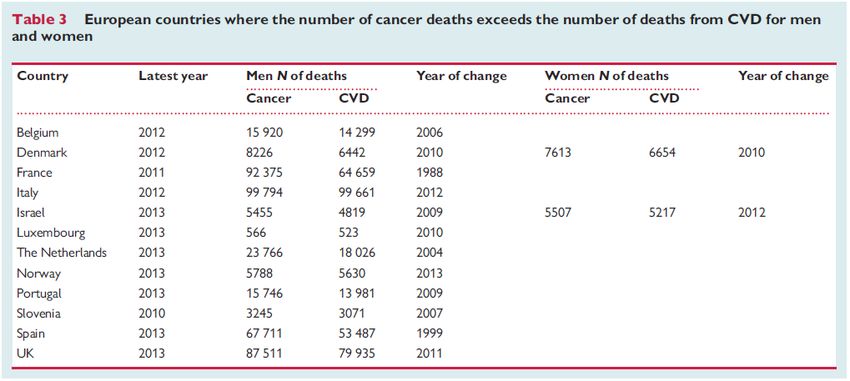
Euro Health Consumer Index 2016

1.3.3 Norway
3rd place, 865 points. Norwegian wealth and very high per capita spend on healthcare
seem to be paying off – Norway has been slowly but steadily rising in the EHCI ranking
over the years. Traditionally, Norwegian patients complained about waiting times. This
has subsided significantly, but is still where Norway loses most of the points missing: -87
points compared with class leaders Belgium and Switzerland!
The poor accessibility of Norwegian healthcare must be more or less entirely attributed
to mismanagement, as lack of resources cannot possibly be the problem. The fact that it
is cheaper to operate a healthcare system without waiting lists (i.e. waiting lists do not
save money, the cost money) could actually explain the Norwegian situation. Too much
money can be a curse, hindering rationalization or the learning of efficient logistics.

1.3.4 Belgium
Perhaps the most generous healthcare system in Europe2 seems to have got its quality
and data reporting acts together, and ranks 4th in the EHCI 2016 (860 points). Still not
quite top class on medical treatment results (“Outcomes”).

1.3.5 Iceland
Due to its location in the North Atlantic, Iceland (5th, 854 points) has been forced to
build a system of healthcare services, which has the capability (not dimensions!) of a
system serving a couple of million people, which is serving only 300 000 Icelanders.
Iceland belongs to the group of five countries scoring 288 on Outcomes, which is as
close to a perfect 300 as is possible to get without reaching it.
It also seems that all speculation about the financial crisis affecting Icelandic healthcare
has been exaggerated. Basically, Iceland is a very wealthy country, which is also proved
by the speedy recovery from the crisis.
Lacking its own specialist qualification training for doctors, Iceland does probably benefit
from a system, which resembles the medieval rules for carpenters and masons: for a
number of years after qualification, these craftsmen were forbidden to settle down, and
forced to spend a number of years wandering around working for different builders.
Naturally, they did learn a lot of different skills along the way. Young Icelandic doctors
generally spend 8 – 10 years after graduation working in another country, and then
frequently come back (and they do not need to marry a master builder’s widow to set up
shop!). Not only do they learn a lot – they also get good contacts useful for complicated
cases: the Icelandic doctor faced with a case not possible to handle in Iceland, typically
picks up the phone and calls his/her ex-boss, or a skilled colleague, at a well-respected
hospital abroad and asks: Could you take this patient?, and frequently gets the reply:
“Put her on a plane!

1.3.6 Luxembourg
Luxembourg (6th, 851 points), being the wealthiest country in the EU, could afford to
build its own comprehensive healthcare system. Unlike Iceland, Luxembourg has been
able to capitalize on its central location in Europe. With a level of common sense which
is unusual in the in-sourcing-prone public sector, Luxembourg has not done this, and
has for a long time allowed its citizens to seek care in neighbouring countries. It seems
that they do seek care in good hospitals. Probably for this reason, Luxembourg loses

2   Some would say over-generous: a personal friend of the HCP team, living in Brussels, was “kidnapped and
        held” in hospital for 6 days(!) after suffering a vague chest pain one morning at work.
Euro Health Consumer Index 2016
points on the Abortions indicator – for reasons of discretion, many LUX women probably
has that done outside of the small and intimate Duchy.
The HCP has received some protest from LUX about the bad score on cigarette
consumption, on the argument that most of those cigarettes are smoked by other
nationalities. From a European public health standpoint, peddling cheap fags to your
neighbours is no better than smoking them all yourself.
1.3.7 Germany
Germany (7th, 849 points) took a sharp dive in the EHCI 2012, sliding in the ranking
from 6th (2009) to 14th. As was hypothesised in the EHCI 2012 report, when patient
organisations were surprisingly negative, this could have been an artefact created by
“German propensity for grumbling”, i.e. that the actual deterioration of the traditionally
excellent accessibility to health care was less severe than what the public thought, and
the negative responses were an artefact of shock at “everything not being free
anymore”.
The 2015 survey results seem to confirm this theory, and it would appear that German
patients have discovered that “things are not so bad after all”, with Mrs. Merkel ruling as
Queen of Europe.
Germany has traditionally had what could be described as the most restriction-free and
consumer-oriented healthcare system in Europe, with patients allowed to seek almost
any type of care they wish whenever they want it (“stronger on quantity than on
quality”). The traditional weakness of the German healthcare system: a large number of
rather small general hospitals, not specializing, resulting in mediocre scores on
treatment quality, seems to be improving – a tendency even more prominent in 2016,
when Germany is one of the six countries sharing the highest score on Outcomes.
In a feedback round from national healthcare bodies, the response from the German
Bundesministerium für Gesundheit (BMG) contained an interesting reference to a study
of waiting times in German primary care. It is irrelevant what the actual numbers were
in that study; the unit of time used to measure and analyse primary care accessibility
was not months, weeks or days, but minutes!
1.3.8 Finland
8th, 842 points. As the EHCI ranking indicates, Finland has established itself among the
European champions, with top Outcomes at a fairly low cost. In fact, Finland is a leader
in value-for-money healthcare.
Some waiting times are still long, provision of “comfort care” such as cataract surgery
and dental care is limited and that out of pocket-payment, also for prescription drugs, is
significantly higher than for Nordic neighbours.
This probably means that the public payors and politicians traditionally were less
sensitive to “care consumerism” than in other affluent countries. This situation seems to
have been put right in recent years, with Finland being among the top scorers for Range
and Reach of Healthcare Services.
1.3.9 Denmark
9th place, 826 points. Denmark was catapulted into 2nd place by the introduction of the
e-Health sub-discipline in the EHCI 2008. Denmark was in a continuous rise since first
included in the EHCI 2006. Interestingly, when the EHCI 2012 was reverted to the EHCI
2007 structure, Denmark survived this with flying colours and retained the silver medal
with 822 points! Denmark has also made dramatic advancement in the reduction of
11Euro Health Consumer Index 2016 heart disease mortality in recent years. Denmark was one of only three countries scoring on “Free choice of caregiver in the EU” after the criteria were tightened to match the EU directive, and also on having a hospital registry on the Internet showing which hospitals have the best medical results. However, in 2013, the introduction of the Prevention sub-discipline did hot help Denmark, which lost 20 points on this sub-discipline relative to aggressive competitors. Although the causality is hard to prove, that Danish score drop did coincide in time not only with the removal of Outcomes data from its hospital quality information system. It also coincided with the tightening of access to healthcare, with only two telephone numbers being available to Danish patients; the number of their GP, or the emergency number 112! 1.3.10 Austria Austria (10th, 826 points) suffered a drop in rank in 2012. In 2016, Austria makes a comeback among the top countries, which score >800 points. The introduction of the Abortion indicator does not help: Austria does not have the ban on abortion found in Poland and three more countries, but abortion is not carried out in the public healthcare system. Whether Austria should deserve a Red or an n.a. score on this indicator could be a matter of discussion – there are no official abortion statistics. 1.3.11 France 815 points. Dropped out of the top 10 after reducing formerly liberal access to specialist services around 2009. Otherwise a technically competent and efficient system, with a tendency to medicalize a lot of conditions3, and to give patients a lot of drugs! France has long had the lowest heart disease mortality in Europe, and was the first country (1988), where CVD was no longer the biggest cause of death. Also, France was #1 in the recently published Euro Heart Index 20164. 1.3.12 Sweden Sweden tumbled in the EHCI 2013 from 6th place to 11th at 756 points, which was only 6 points down from the 2012 value of 762 points. In the EHCI 2016, Sweden drops further to #12, at the same 786 points as in 2015. In 2016, with 11 countries scoring above 800, the seemingly never-ending Swedish problems with healthcare waiting lists sends the country out of this top group. Sweden scores surprisingly well in the sub-discipline Prevention, considering that the country’s healthcare system has a long tradition of steering patients away from taking up time for their doctor unless really sick. Sweden enjoys the companionship only of a number of CEE countries having more than 30 abortions per 100 live births, which in CEE probably is a remnant from before 1990. In Russia, abortion is still used as a common contraceptive, with 55 abortions per 100 births (and that is down from >200 in the early 1990’s). At the same time, the notoriously poor Swedish accessibility situation seems very difficult to rectify, in spite of state government efforts to stimulate the decentralized county-operated healthcare system to shorten waiting lists by throwing money at the problem (“Queue-billions”). Sweden now has the highest healthcare spend per capita, 3 Wadham, Lucy; The Secret Life of France, Faber Faber, 2013. 4 www.healthpowerhouse.com/publications/euro-heart-index-2016/
Euro Health Consumer Index 2016

(after the three super-wealthy countries, see Section 4.1) together with The Netherlands
and Austria. “Throwing money at a problem” is obviously not an effective way of
problem-solving. The HCP survey to patient organizations confirms the picture obtained
from the official source www.vantetider.se, that the targets for maximum waiting times,
which on a European scale are very modest, are not really met. The target for maximum
wait in Sweden to see your primary care doctor (no more than 7 days) is underachieved
only by Portugal, where the corresponding figure is < 15 days. In the HCP survey,
Swedish and Irish patients paint the most negative pictures of accessibility of any nation
in Europe. Particularly cancer care waits, not least in the capital Stockholm, seem
inhumane!
Another way of expressing the vital question: Why can FYR Macedonia reduce its waiting
times to practically zero, and Sweden cannot?

1.3.13 The Czech Republic
The Czech Republic has always been the star performer among CEE countries, and in
2016 remains at #13 (780 points), only 6 points behind Sweden and leading the group
of CEE countries, squeezing ahead of the United Kingdom. Good for accessibility to
healthcare services!

1.3.14 Portugal
14th; 763 points (and ahead of the UK). A very impressive climb: In 2013, 16th place on
671 points (up from 25th place in 2012). In 2014, Portugal advanced to 13th place with
722 points. There was a small setback in 2015, mainly due to patients being less positive
about waiting times, resulting in a score of 691 points and 20th place (in the middle of
the ranking, a small score change can result in dramatic ranking change). Does well in
the Bang-for-the-Buck analysis!

1.3.15 United Kingdom
15th place, 761 points. A 2014 survey to the public of the UK, asking about “What is the
essence of being British?” got the most common response “Having access to the NHS”.
Nevertheless, the UK healthcare system has never made it into the top 10 of the EHCI,
mainly due to poor accessibility (together with Poland and Sweden the worst among
European healthcare systems) and an autocratic top-down management culture.
Mediocre Outcomes of the British healthcare system are improving, with the UK scoring
Green on Infant Mortality for the first time in the EHCI.
The country, which once created the Bletchley Park code-breaking institution would do
well to study the style of management of professional specialists created there5!

1.3.16 Slovenia
16th place, 740 points.
When the HCP team first visited the Slovenian Ministry of Health in 2006, the MoH
representatives proudly stated “We are not a Balkan state – we are an Austrian
province, which had bad luck in 1918!”
Slovenia has a GDP/capita which is 3 – 4 times that of the other ex-Yugoslav countries
(except Croatia at ~75% of the Slovenian GDP). This difference was not created in just

5   McKay, Sinclair; The Secret Life of Bletchley Park, chapter 17, *Aurum Press, London (2010).

                                                                                                   13
Euro Health Consumer Index 2016
over two decades – in 1985, Croatia and Slovenia together produced 75% of the GDP of
Yugoslavia!
With a population of only 2 million people, it sometimes takes only a limited number of
skilled and dedicated professionals to make a difference in certain medical specialities.
This has been observed in hepatitis, where Slovenia ranked #2 in Europe in the 2012
Euro Hepatitis Index6, and also in diabetes and CVD, Slovenia ranking #6 in the 2014
Euro Diabetes Index7 and 5th in the Euro Heart Index 20164.
1.3.17 Estonia
729 points. Not exceptional on any of the sub-disciplines, Estonia has done well in the
EHCI for a number of years, not least in the context of the quite limited economic
resources of this small country. Leader in the Bang-for-the-Buck adjusted Index (see
Chapter 4). One of very few countries managing to keep resistant infection rates low –
restrictive antibiotics prescribing?
1.3.18 Spain
709 points. Very regionally decentralised. Spanish healthcare seems to rely a bit too
much on seeking private care for real excellence; however, Spain is doing better on the
Outcomes indicators in 2016 than historically.
1.3.19 Croatia
19th place, 703 points, which is essentially at level with 2015, but results in a minor drop
in rank. Croatia (and even more Slovenia) were the remarkable success stories among
the ex-Yugoslavian countries, until the Macedonian wonder in 2014. In spite of a
GDP/capita, which is still modest by Western European standards, Croatian healthcare
does excel also at advanced and costly procedures such a kidney transplants: the
Croatian number of 50 transplants per million population is among the top countries of
Europe.
1.3.20 Former Yugoslav Republic Of Macedonia (FYROM)
FYROM was the absolute “Rocket of the Year” in 2014, ranking 16th with a score of 700
points, up from 555 points and 27th place in 2013. This also makes the country the
“EHCI Rocket of all Time”; no country ever gained 11 positions in the ranking in only
one year!
It keeps its score in 2016 with 699 points, giving 20th place.
The country has made a remarkable breakthrough in electronic booking of appointments
– since July 2013, any GP can call up the booking situation of any specialist or heavy
diagnostic equipment in the country in Real Time with the patient sitting in the room,
and book anywhere in the country with a few mouse clicks. This has essentially
eliminated waiting times, provided that the patient is willing to travel a short distance
(the entire country measures approximately 200 km by 130, with the capital Skopje
located fairly centrally). It seems that patients have caught on, with FYROM receiving
top scores for accessibility.
6 http://www.healthpowerhouse.com/files/euro-hepatitis-index-2012/Report-Hepl-HCP-121104-2-w-
Cover.pdf
7 http://www.healthpowerhouse.com/files/EDI-2016/EDI-2016-report.pdfEuro Health Consumer Index 2016
Much of this can probably be attributed to firm leadership, with the Minister of Health
declaring “I want that system up and running on July 1, 2013; basta! The system
(“IZIS”) also includes e-Prescriptions.
The FYROM IZIS system is well worth a study trip from other countries! The message to
all other European ministers and other persons in charge of healthcare systems: “Go and
do likewise.”8 This advice does not exclude that e-health implementation most often may
need some time to settle and that down-sides can occur over time, before patients get
used to their newborn power and choice.
The area, where FYROM still has a way to go is on actual medical treatment results.
There is no quick fix for this; even with very determined leadership, it will probably be a
matter of ~5 years to produce significant improvement.
1.3.21 Ireland
21st place, 689 points.
Ireland has detailed official statistics on waiting times all over healthcare, and that data
was been allowed to prevail up until EHCI 2013. However, for several EHCI years, Irish
patient organisations have been radically more pessimistic in their responses to the
survey conducted as part of EHCI research. It is well known that customers/patients
have long memories for less good things. As the same pessimistic results reoccurred in
2016 – Ireland, the UK and Sweden had the worst patient organisation feedback on
Accessibility among the 35 countries – doubts must be raised on the validity of official
statistics.
As a matter of principle, in the EHCI 2014 – 2016 it has been decided to use the patient
organisation feedback to score Ireland on Accessibility. This accounts for the drop from
rank 14 to 22 in 2014, with a slight recovery in 2016.
Unfortunately, this was confirmed by the Irish HSE and MoH after the release of the
EHCI 2015 report, when they said in a memo that the programme initiated to reduce
healthcare waiting times in Ireland aims at a target of no more than 18 months’ (!) wait
for a specialist appointment. Even if and when that target is reached, it will still be the
worst waiting time situation in Europe.
The fact that Ireland has the highest % of population (> 40 %; down from 52 % three
years ago9) purchasing duplicate healthcare insurance also presents a problem: should
that be regarded as an extreme case of dissatisfaction with the public system, or simply
as a technical solution for progressive taxation?
Ireland no longer has a total ban on abortion. The requirement that a woman wishing
an abortion becomes subject to judgement on if the pregnancy should be regarded as a
serious health hazard, including suicide risk, is a very minor step indeed towards
abortion as a women’s right, hence the purple score on this indicator.
1.3.22 Italy
682 points. Italy has the largest internal difference of GDP/capita between regions of
any European country; the GDP of the poorest region is only 1/3 of that of Lombardy
(the richest). Although in theory the entire healthcare system operates under one
central ministry of health, the national Index score of Italy is a mix of Northern Italian
and Rome Green scores, and Southern Italian Red scores, resulting in a lot of Yellows.
8 Luke 10:37
9 OECD Health at a Glance, 2012.
15Euro Health Consumer Index 2016 1.3.23 Slovakia 678 points, up 25 since 2015, which is required just to hang on in the ranking. The fairly recent Slovakian system of private (additional) healthcare insurance has not yet produced a significant change in the EHCI scores. 1.3.24 Serbia 24th place, 670 points, up 116 points since 2015, which makes Serbia the “climber of the year”! After Serbia’s first inclusion in the EHCI in 2012 (finishing last), there were some very strong reactions from the Ministry of Health in Belgrade, claiming that the scores were unfair. Interestingly, there also were reactions from organisations of medical professionals in Serbia claiming that the Serbian scores were inflated, and that the EHCI did not take corruption in healthcare systems seriously enough. The only directly corruption-related indicator is Under-the-table payments to doctors, where Serbia does score Red. The major part of the impressive climb is the effect on Waiting Times by licensing and implementing the Macedonian IZIS system for direct specialist care booking, plus e- Prescriptions. Serbia being a larger country than FYROM, the full effect has not materialized fully by the time of EHCI 2016 publication. There is also anecdotal evidence that corruption, which has long been a plight of the Serbian healthcare system, is being significantly reduced. Unfortunately, not yet to warrant an improved score on this indicator. 1.3.25 Malta 666 points. Up from 663 points in 2015. Decent accessibility, but not too strong on treatment results. Also, there seem to be gaps in the public subsidy system of Maltese healthcare. This is particularly prominent for drug subsidies; many Maltese do not bother with receiving a subsidy. The result is that Malta has little data on drug use! 1.3.26 Cyprus 623 points, up 28 points since 2015. Very difficult to score in the EHCI, as Cyprus does not really have a public healthcare system in the general European meaning. As the EHCI normally does not reward a country for such services obtained by paying privately, it is possible that the score in reality should be lower. 1.3.27 Lithuania 620 points. In 2015, Lithuania recovered from the nosedive to 510 points and #32, which the country took in 2014. This shows that the EHCI can sometimes be sensitive to small changes in responses from the often limited number of patient organisations responding to the HCP survey. In 2016, Lithuania is almost back on its long time trend (see Figure 5.1). 1.3.28 Greece Greece was reporting a dramatic decline in healthcare spend per capita: down 28 % between 2009 and 2011, but a 1% increase in 2012! This is a totally unique number for Europe; also in countries which are recognized as having been hit by the financial crisis, such as Portugal, Ireland, Spain, Italy, Estonia, Latvia, Lithuania etc, no other country has reported a more severe decrease in healthcare spend than a temporary setback in
Euro Health Consumer Index 2016
the order of < 10 % (see Appendix 2). There is probably a certain risk that the 28%
decrease is as accurate as the budget numbers, which got Greece into the Euro.
Greece has markedly changed its traditional habit as eager and early adopter of novel
pharmaceuticals to become much more restrictive. However, the graph below shows
that as late as 2012, Greece still had the 3rd highest per capita consumption of
pharmaceuticals in Europe, counted in monetary value! Part of the explanation for this is
unwillingness to accept generic drugs. It would seem that pharmacists (and doctors?)
are not keen on communicating to patients that generics are equal to the branded
drugs.
What has partially changed in Greece is the readiness to adopt new drugs. As Indicator
6.5 (new arthritis medication) shows, Greece has in some cases radically changed its
previous generous attitude to the introduction of novel, expensive pharmaceuticals. Also,
the position of Greece in the drug expenses league has dropped from #3 in 2012, to
#11 in 2014.
Figure 1.3.28a.
Greek pharma expenditure is possibly affected by the fact, that Greece (and Italy) are
the two countries in Europe, where the levels of corruption10 exceed what could be
expected against the poverty level.
10 www.euractiv.com/section/health-consumers/news/novartis-under-scrutiny-for-alleged-pharma-scandal-
in-greece/?nl_ref=28487074
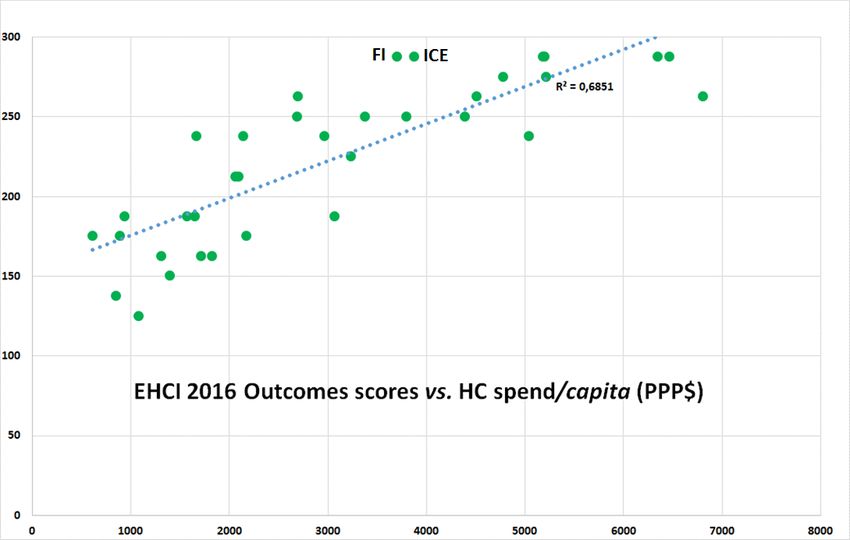
17Euro Health Consumer Index 2016 Figure 1.3.28b Corruption scores vs. GDP/capita. On the corruption scale, a score of 100 denotes a corruption-free country; the lower the score, the more severe the corruption. There is a quite close correlation (R = 90%) between poverty and corruption. Deviating negatively (i.e. more corrupt than should be expected) are Italy, Greece and Ireland. Very honest, in relation to their economic means, are Estonia and Finland. The three rich countries LUX, CH and NO have been left out – their GDP/capita is 50 – 100% higher than that of any other country. Greece leads Europe by a wide margin in the number of doctors per capita (below), and also has the highest number of pharmacists per capita. Still the picture of Greek healthcare, painted by the patient organisation responses, does not at all indicate any sort of healthy competition to provide superior healthcare services.
Euro Health Consumer Index 2016

Figure 1.3.28b. Physicians per 100 000 population (broad bars) and Number of doctor
appointments per capita (yellow narrow bars).
It would seem almost supernatural that Greece can keep having the large number of
doctors and pharmacists, unless these have taken very substantial reduction of income.
It deserves to be mentioned that the indicators on Outcomes (treatment results) do not
show a worsening of results for Greece.

1.3.29 Latvia
589 points. Being every bit as victimized by the finance crisis as Greece, Latvia together
with Lithuania has made a remarkable comeback. Both countries show improvement on
the really vital indicator Infant mortality; Latvia has achieved an improvement from
6.2/1000 births (Red score) in 2012 to 3.9/1000 (Green score) in 2014, 3.8 in 2016. This
seems sustainable – in a small country, these numbers would be sensitive to random
variation.

1.3.30 Hungary and Poland
Hungary (30th at 575 points) and Poland (31st at 564) are two countries, which have not
done well in the EHCI in recent years, despite having good and plentiful medical
education and a long tradition of solidarity-financed public healthcare.
The reason(s) for this is not obvious. However, there could be a common factor
between the two countries: It is well known from management practice, that if top
management starts focussing on things other than producing the best products or
services, the quality of products/services declines. In a corporation, “other things” can
be Business For Fun such as “sexy” company acquisitions, using the corporate jet for
hunting trips with posh people, or whatever.
In recent years, the governments of Hungary and Poland seem to have focussed on
things other than the optimal running of the country. In Hungary, things like keeping out
1200 refugees per year – a pathetic number, anyway. In Poland, killing off the free
press and banning abortion in all but the most extreme circumstances.
Since the start of the EHCI, ongoing political discussions on fundamental reform in
Poland (as well as in Romania and other CEE countries) has yet delivered very little. In
Hungary, one of the oldest publicly funded CEE healthcare systems has failed to
transform from the old Semashko-style mentality into the modern world of patient-
centered healthcare.
The public and the medical profession of both countries deserve better.

1.3.32 Albania
32nd place, 551 points, up 27 since 2015.
Albania was included in the EHCI at the request of the Albanian Ministry of Health.
Albania, as can be seen in Section 4.1, does have very limited healthcare resources. The
country avoids ending up last chiefly due to a strong performance on Access, where
patient organizations also in 2016 confirmed the official ministry version that waiting
times are a minor problem.
The ministry explanation for this was that “Albanians are a hardy lot, who only go to the
doctor when carried there”, i.e. underutilization of the healthcare system. This is an
oversimplification; Albanians visit their primary care doctor more than twice as often as
Swedes (3.9 visits per year vs. 1.7)!

                                                                                       19
Euro Health Consumer Index 2016 Albania shares one problem with all the Balkan states, with some exception for Slovenia: it is difficult to evaluate which healthcare services are accessible without under-the-table payment. 1.3.33 Bulgaria 33rd place, 526 points. Bulgaria made a remarkable advance between 2012 and 2013 by the power of patient organisations in 2013 giving much more positive responses on survey questions on the EHCI sub-discipline Accessibility. Such an improvement is very difficult to achieve if it is not the result of a system reform such as the FYROM booking/referral system. The HCP team has checked the accuracy of those reports, and they seem to be founded on reality. Unfortunately, Bulgaria loses points on Outcomes and Range & Reach of HC Services. 1.3.34 Montenegro 34th place, 518 points – 34 points up since 2015, enough to avoid last place. One circumstance historically favouring Montenegro was a massive influx of Russian capital, which at the time of writing this report seems to be endangered by the low prices of oil and sanctions against Russian capitalists after the seizure of Crimea. The country has only 650 000 inhabitants, making it possible for reforms to take effect rapidly. 1.3.35 Romania 35th place, 497 points. Romania does have severe problems with the management of its entire public sector. In healthcare, discrimination of minority groups such as romani (3½ - 4% of the population) shows as poor Outcomes ratios. Also, Albania, Romania and Bulgaria are suffering from an antiquated healthcare structure, with a high and costly ratio of in-patient care over out-patient care (see Figure below).
Euro Health Consumer Index 2016

Figure 1.3.35 The higher the share of in-patient care, the more antiquated the healthcare
provision structure. If Dutch, Swiss and (possibly) Italians prefer long hospital admissions, they
can afford it; Bulgaria, Romania and Albania cannot! They should receive professional support to
restructure their healthcare services!

1.4 Less wealthy countries on the recovery from financial
crisis?
The overall total scores seem to indicate what could be a macro effect of the financial
crisis. The top end of the ranking in 2014 did show a concentration of the wealthier
countries, which was more obvious than in any previous edition. It would seem that
these countries were able to avoid the (rather modest) effects of the financial crisis,
which have affected less affluent countries. This can be interpreted that the financial
crisis did result in a slight but noticeable increase of inequity of healthcare services
across Europe.
In the total 2016 scores shown in Figure 4.1 below, this equity gap has diminished
slightly; the 8 least wealthy countries have gained on average 53 points between 2014
and 2016! This could indicate that also poorer European states are on the recovery from
the crisis.
When results are analysed at indicator level, some tendencies seem to be detectable:

1.4.1 Outcomes quality keeps improving
Indicators such as Cancer Survival or Infant Mortality keep showing improvement over
time. This is true also for countries such as the Baltic states, which have undergone a
financial “steel bath”, in every way comparable with that hit southern Europe or Ireland.

                                                                                                 21
Euro Health Consumer Index 2016
As an example, both Latvia and Lithuania have shown remarkable improvement in Infant
Mortality right during the period of the worst austerity measures.
This is probably a positive effect of doctors being notoriously difficult to manage –
signals from managers and/or politicians are frequently not listened to very attentively.
This would be particularly true about providing shoddy medical quality as this would
expose doctors to peer criticism, which in most cases is a stronger influencing factor
than management or budget signals.
1.4.2 Delays and/or restrictiveness on the introduction of novel
pharmaceuticals
As is shown by Indicators 6.3 – 6.5 (section 7.10.6), saving on the
introduction/deployment of drugs, particularly novel, patented (expensive) drugs, seems
to be a very popular tactic for containing healthcare costs in many countries. This has
been observed also in previous HCP Indices11.
This is particularly obvious for Greece – a country, which traditionally has been a quick
and ready adopter of novel drugs. The Greek public bill for prescription drugs was 8
billion euro as late as 2010, for 11 million people. As a comparison, the Swedish
corresponding number was 4 billion euros for 9½ million people – and drug prices have
traditionally been lower in Greece. That Greek readiness to introduce new drugs has
dropped dramatically, along with the introduction of generic substitution.
Still, the Greek drug consumption by monetary value was the third highest in Europe as
late as 2012! By 2014, that had shrunk to be the 11th highest.
1.5 BBB; Bismarck Beats Beveridge – now a permanent
feature
The Netherlands example seems to be driving home the big, final nail in the coffin of
Beveridge healthcare systems, and the lesson is clear: Remove politicians and other
amateurs from operative decision-making in what might well be the most complex
industry on the face of the Earth: Healthcare! Beveridge systems seem to be operational
with good results only in small population countries such as Iceland, Denmark and
Norway.
1.5.1 So what are the characteristics of the two system types?
All public healthcare systems share one problem: Which technical solution should be
used to funnel typically 8 – 11 % of national income into healthcare services?
Bismarck healthcare systems: Systems based on social insurance, where there is a
multitude of insurance organisations, Krankenkassen etc, who are organisationally
independent of healthcare providers.
Beveridge systems: Systems where financing and provision are handled within one
organisational system, i.e. financing bodies and providers are wholly or partially within
one organisation, such as the NHS of the UK, counties of Nordic states etc.
For more than half a century, particularly since the formation of the British NHS, the
largest Beveridge-type system in Europe, there has been intense debating over the
relative merits of the two types of system.
11 The Euro Hepatitis Index 2012, http://www.healthpowerhouse.com/files/euro-hepatitis-index-
2012/Report-Hepl-HCP-121104-2-w-Cover.pdfYou can also read


