THE DIGITAL DIVIDE IN THE TROPICS - James Cook University
←
→
Page content transcription
If your browser does not render page correctly, please read the page content below
T HE D I GI TA L D IV IDE IN TH E TROPICS

            A STATE OF THE TROPICS REPORT 2021.
AUTHORS AND ACKNOWLEDGMENTS

James Cook University and the State of the Tropics leadership group acknowledge the contributions made by
many individuals and institutions to the preparation and publication of this Report.

State of the Tropics leadership group institutions:

Project management and editorial team
Sandra Harding and Ann Penny (lead author)

Advice, assistance and reviews
Ian Atkinson, Daniel Christie, Carol Archer, Rakan Zahawi, Janet Hemingway, Benjamin Horton, Carol Archer,
Jetsumon Prachumsri, Mark Ziembicki, Rodney McComiskie and Dennis Trewin.

Capstone Editing provided copyediting and proofreading services, according to the guidelines laid out in the
university-endorsed national ‘Guidelines for Editing Research Theses’.

Published by James Cook University on behalf of the State of the Tropics Leadership Group

© Copyright 2021, James Cook University		             ISBN: 978-0-6489220-7-0

This work is copyright. Apart from any use permitted under the Copyright Act 1968, no part may be
reproduced by any process nor may any other exclusive right be exercised without the permission of
James Cook University.

This report should be cited as: State of the Tropics (2021) The Digital Divide in the Tropics. James Cook
University, Townsville, Australia.

Disclaimer: The views and opinions expressed in this publication are those of the authors and do not
necessarily reflect those of James Cook University or the leadership group for the State of the Tropics Project.

The designations employed and presentation of material in State of the Tropics does not imply the
expression of any opinion of James Cook University or the State of the Tropics leadership group concerning
the legal status of any country, territory, city of area of its authorities, or concerning the determination of
their frontiers or boundaries.

Cover Photo: Kenyan school children. Hadynyah/Getty Images
Layout and design: zephyrmedia.com.au
CONTENTS

Foreword – Professor Sandra Harding                                               2

Summary                                                                          4

List of Figures and Tables                                                        7

CH APTERS
   1. Introduction                                                               8

   2. Digital Access in the Tropics                                              12

   3. Education and Digital Literacy                                             34

   4. Production, Trade, Use and Disposal of Digital Technology in the Tropics   50

CASE STUDIE S
   1. Information and Communication Technology in the Pacific                    24

   2. Digital Health in the Tropics                                              28

   3. Mobile Money and the Story of M-Pesa                                       46

   4. Cobalt Mining in the Democratic Republic of Congo                          60

Appendix A                                                                       64

Appendix B                                                                       70

                                                                                      CONTENTS   1
FOREWARD

                              There can be no doubt that the future is digital and to be on the wrong side of the
                              digital divide is to be on the wrong side of history.

                              More than three billion people, almost half the world’s population, are not online
                              and most of those who are on the wrong side of the digital divide live in the tropical
                              regions of the world.

                              The digital revolution has transformed lives. These new technologies have allowed
                              people to connect with one another in a whole new way, overcoming distance and
                              geography. A mobile phone means you can contact your family far away, receive
                              money, avoid unnecessary and potentially dangerous travel and enjoy and share
                              music and culture. As this technology develops, it will affect how we grow our
                              food and receive health care and education, and makes possible a fairer and more
                              equitable society.

                              However, just like all instruments of development, the success of information and
                              communication technology to alleviate poverty and drive sustainable development,
                              depends on the social, cultural and environmental context in which it operates.
                              Where inequality persists, the impact of introducing new technology remains
                              unequal. While fourth and fifth generation (4 and 5G) mobile broadband or new
                              satellite constellations can make the internet potentially available for everyone on
                              Earth, true universal access still requires reliable electricity, the knowledge of how to
                              use technology, and affordable devices and data.

2   STATE OF THE TROPICS REPORT 2021
The importance of digital technologies was growing inexorably when, in 2020, the
COVID-19 pandemic put the role that this technology plays in our lives front and centre.
Trade, employment, learning, communications and everyday life rapidly shifted into the
digital realm.

In 2019, prior to the pandemic, representatives of the State of the Tropics leadership
group met in Singapore to discuss the way forward for this project. At that time, the
impact of digital technologies and the persistent digital divide was considered an
important future focus for this project. The events of 2020 and 2021 have only served to
highlight the critical nature of this particular axis of inequality as digital technology was
put to work across the globe.

This report shines a spotlight on the extent and impact of the digital divide in the Tropics,
in education, business and at home.

Spanning this digital divide, including understanding the innovative ways that people are
using technology, holds in prospect a brighter future for the peoples of the Tropics.

Professor Sandra Harding
Vice Chancellor & President, James Cook University
Convenor, State of the Tropics Project

                                                                                                FOREWARD   3
SUMMARY

4   STATE OF THE TROPICS REPORT 2021
People across the globe are more connected than ever. Digital           for education, entrepreneurship and new modes of finance
technologies, mobile phones, the internet and other forms of            and banking, and play a role in reducing corruption.
digital information exchange have changed the way business
and education are conducted and how knowledge is shared.                In 2020, the global COVID-19 pandemic brought focused attention
Information and communication technology (ICT) refers to any            to the reality that digital inequality persists around the world, even
technology that enables the communication and electronic                in countries with high-speed connectivity infrastructure. Most
capture, processing and transmission of information. This               countries issued home quarantine measures in the first half of 2020
includes older technologies such as radio, television and fixed-        and workers, families and individuals relied on mobile phones and
line telephony, as well as more recent innovations such as              internet connectivity to continue to work, learn and communicate.
personal computers, mobile phones, broadband networks                   For those without access to digital technologies, gaps in access and
and the internet. The potential of these new technologies lies          digital skills can increase societal fractures and undermine recovery.
in their capacity to instantaneously connect vast networks
of individuals, organisations and governments across all                This report takes stock of the current and historical status of ICT
corners of the world. ICT can provide many opportunities                and digital access across different regions of the Tropics.

DIGITAL ACCESS IN THE TROPICS

        ŵ Globally, mobile phone ownership appears universal, with subscriptions out numbering people. In 2019, there were 108 mobile
            phone subscriptions for every 100 people globally. This equates to some 8.7 billion active mobile cellular subscriptions.
        ŵ In the Tropics, access to mobile phones has increased dramatically since the turn of the century but still trails behind the rest of
            the world. In 2000, there were fewer than five mobile phones per 100 people in the Tropics. By 2019, this number had grown
            to more than 97 per 100.
        ŵ According to the latest available estimates from the International Telecommunications Union (ITU), in 2019, 53.5% of people
            worldwide used the internet in 2019—an increase from just 17% in 2005.
        ŵ In 2019, estimates suggest just 37.1% of people used the internet in the Tropics—indicating that the gap between the Tropics
            and the rest of the world has actually widened since previous State of the Tropics reports.
        ŵ Recent advances in mobile technology have allowed more people to access the internet through the use of internet-enabled
            mobile devices, particularly smartphones. This has allowed far more people access to the internet without ever having to be
            connected by a fixed line. However, access to the internet through mobile broadband remains low in many parts of the Tropics.
        ŵ Low Earth Orbit (LEO) satellite constellations could be transformative for expanding high-speed internet to underserved
            regions. However, the costs, both monetary and environmental, are potentially high.
        ŵ The groups of people who have access to and use the internet vary between regions, gender and age. People living in urban
            areas are more likely to use the internet, men are more likely than women, and young people are more likely than the elderly.
            There is no doubt that access to mobile phones and the internet has changed and continues to change how we communicate,
            work, do business, learn and interact with culture and art. During the various stages of lockdown imposed across the world in
            2020, these forms of communication became more important than ever.

EDUCATION AND DIGITAL LITERACY

        ŵ Lack of access to ICT at school and home limits the ability of students to learn digital skills that would allow them to
            participate in the global digital economy, which many see as essential for ongoing sustainable development.
        ŵ There is huge variation in schools with internet access, from less than 3% in Madagascar and Burkina Faso to 100% in Brunei,
            Maldives and a number of Caribbean states. Access tends to remain very low across Central and Southern Africa and in some
            parts of South Asia, South-East Asia and Central America. Data are not available for any countries in Oceania.
        ŵ It is clear that some regions of the Tropics lag behind global estimates considerably. Africa and South Asia have particularly low
            levels of internet access at home. The youngest group, school-aged children, had the lowest access levels in these regions, with
            slightly higher access in East Asia and the Pacific.
        ŵ In the context of the global pandemic with many schools operating remotely, this low level of access in many tropical
            countries meant that when schools were closed, the only means of students continuing schooling was through take-home

                                                                                                                           SUMMARY            5
packages. This has resulted simply in many students not accessing schooling at all, with potentially huge social and economic
            costs to the countries that can bear it the least.
        ŵ Generally, ICT is far less likely to be included in primary school curriculums, particularly in Africa and the Middle East.
            However, by upper secondary, most countries reporting included ICT in the curriculum. Programs in Brazil, Malaysia and
            Thailand have increased the number of schools with the capacity to teach ICT skills in those countries.
        ŵ Far fewer youth and adults have basic digital skills in the Tropics than in the rest of the world. However, there are some
            exceptions. Saudi Arabia, Malaysia and Singapore have relatively high digital literacy rates, with rates comparable to most
            countries reporting from the non-Tropics and higher than some countries.

PRODUCTION, TRADE, USE AND DISPOSAL OF ICT

        ŵ Around 40% of all ICT goods are exported from tropical regions. These exports are dominated by South-East Asia and Central
            America. In other regions of the Tropics, the share of the global trade in ICT goods remains small.
        ŵ South-East Asia is the only region in the Tropics that is a net exporter of ICT goods. All other regions in the Tropics import more
            technology than they produce and export.
        ŵ Globally, almost one-quarter of all people used the internet to make a purchase in 2019; however, this was concentrated in
            wealthy countries in North America, Europe and East Asia. Far fewer people used the internet for purchasing throughout the
            Tropics, with some exceptions such as Saudi Arabia, Malaysia and Singapore. The largest growth markets in the Tropics have
            been Hong Kong and India.
        ŵ The rapid expansion of electrical and electronic equipment manufacturing across the world due to industrialisation, economic
            expansion, technological development and growing wealth has led to complementary growth in electronic waste or e-waste.
        ŵ On a per-capita basis, tropical countries, with the exception of tropical Australia and the US (Hawaii), produce far less e-waste
            than nations in North America and Europe. E-waste from North America and Europe is often exported to China, Brazil, Nigeria,
            Ghana and India.

CASE STUDIES

Information and Communication Technology in the Pacific takes a closer look at the tropical region with the least connectivity.
Mobile phone penetration is around half the global rate, and in 2019, internet users represented less than 20% of the population outside
of Australia and Hawaii. Nations in the Pacific are generally small, culturally diverse and separated by challenging terrain or vast ocean.
Although submarine cables now connect most capital cities in this region, outer islands and remote areas remain unconnected.

Digital Health in the Tropics explores the potential benefits of building better digital health systems in the Tropics. Digital health
programs can improve vaccination rates, monitor diseases and symptoms, detect disease outbreaks and connect specialist medicine to
those who are unable to travel to urban centres. Although privacy and reliability issues remain, digital health has the capacity to enhance
existing health systems.

Mobile Money and the Story of M-Pesa charts the rise of mobile money throughout the Tropics with a focus on M-Pesa, the most
successful service. Mobile money is a money transfer system that uses mobile phones and a network of human agents who cash in and
cash out for customers, exchanging e-money as text messages for hard currency. It does not require a smartphone, bank account, credit
card or internet connection. Mobile money accounts can provide a gateway to life-enhancing services such as remittances, health care,
education, employment and social protections.

Cobalt Mining in the Democratic Republic of Congo (DRC) discusses the origin of a vital component in digital systems and lithium-
ion batteries—cobalt. The enormous and growing demand for digital devices and products globally has driven huge growth in mining for
critical minerals used in components.

The vast majority of cobalt is mined in the DRC, where it has been shown to create jobs, alleviate poverty and encourage investment in
social infrastructure. However, working conditions are often dangerous, miners are poorly paid, and, in some cases, child labour is involved.

6       STATE OF THE TROPICS REPORT 2021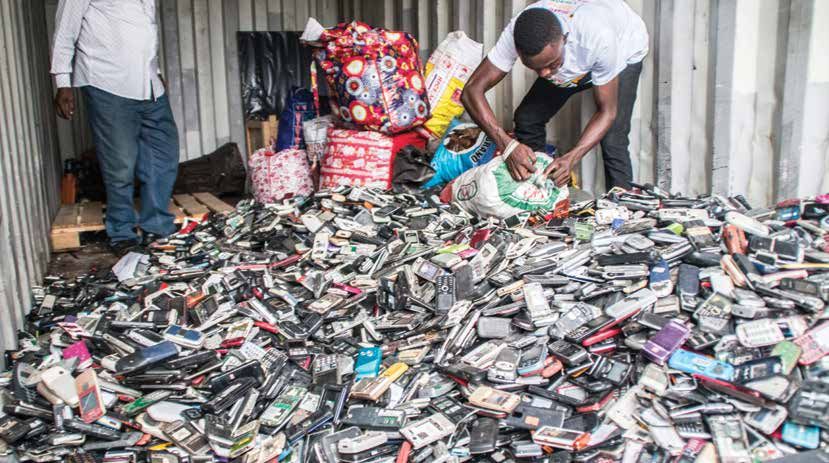
LIST OF FIGURES AND TABLES

Figure 1.3 Tropical regions of the world used in State of the Tropics analyses.                                                       10
Figure 2.1 Mobile Phone Subscriptions per 100 people in the Tropics, globally and the rest of the world.                              15
Figure 2.2 Mobile cellular subscriptions per 100 people across the tropical regions.                                                  15
Figure 2.3 Internet users (% of population) in the Tropics, the rest of the world and globally.                                       16
Figure 2.4 Internet users (% of population) across the tropical regions.                                                              17
Figure 2.5 Mobile Broadband Subscriptions per 100 people (latest available) 2015–2018.                                                18
Figure 2.6 Proportion of the population covered by at least third-generation (3G) mobile broadband coverage.                          18
Figure 2.7 Average cost of 1 GB of mobile data in USD.                                                                                19
Figure 3.1 Percentage of educational institutions connected to the internet from select tropical nations.                             37
Figure 3.2 Percentage of children and young people with internet access at home, by region.                                           38
Figure 3.3 Percentage of countries that include ICT as part of the school curriculum across available tropical regions based          40
           on latest available estimates. Includes developing countries only.
Table 3.1   Spread of basic skills of youth and adults across select countries from the Tropics and the Rest of the World             41
            based on latest available data.
Figure 4.1 ICT goods exported as a percentage of total exports globally, in the Tropics and in the Rest of the world.                 53
Figure 4.2 ICT exports as a percentage of total exports across the tropical regions.                                                  54
Figure 4.3 ICT imports as a percentage of total exports globally, in the Tropics and in the Rest of the World.                        54
Figure 4.4 ICT imports as a percentage of total imports across the Tropical regions.                                                  55
Figure 4.5 Percentage of people who used the internet to make a purchase in 2019.                                                     56
Figure 4.6 Kilograms (kg) of e-waste generated per capita across the tropical regions and globally in 2019.                           57
Figure 4.7 E-waste (kg per capita) produced globally. Arrows show major flows of e-waste from producing countries.                    57

                                                                                                                            SUMMARY    7
1
    IN T RO D U C TION

8    STATE OF THE TROPICS REPORT 2021
The growth of digital technologies, mobile communication and the half of 2020, and workers, families and individuals relied on mobile
internet is one of the major developments of the late twentieth and phone and internet connectivity to continue to work, learn and
early twenty-first century. In September 2020, UN Secretary-General communicate (ITU and UNESCO, 2020). During the height of the
António Guterres said that access and use of ICT could be the greatest crisis, 90% of governments around the world closed schools and
equaliser and enabler of our times (United Nations, 2020). implemented remote learning practices (UNICEF, 2020). At their
peak, school closures affected 1.5 billion school students from pre-
One of the key targets of the 2030 Agenda for Sustainable primary to upper secondary.
Development is to significantly increase access to ICT and strive to
provide universal and affordable access to the internet in the least In many ways, COVID-19 has accelerated digital development,
developed countries. This target actually expires in 2020 and has not forcing human interactions to occur online, growing e-commerce,
been achieved. Although nearly the whole global population was online education and remote work (World Economic Forum,
covered by a mobile network in 2020—the actual access and use of 2021). These shifts promise huge benefits to society well beyond
digital technologies is a far more complex story. The latest estimates the pandemic, but they also risk exacerbating and creating
suggest that more than 3 billion people worldwide still do not use inequalities. For those without access to digital technologies during
the internet in a meaningful way (ITU and UNESCO, 2020). unprecedented stay at home directions, the gaps in access and
skills and capabilities can worsen societal fractures and undermine
Many tropical communities are in danger of being left behind as recovery prospects (World Economic Forum, 2021).
digital technology expands into ever more complex systems. The
divide between those with digital connectivity and those without The rate of technological change in the first part of the twenty-first
has been shrinking. Still, progress is slower than it should be, century is so rapid that any publication of this kind will be out of
often beset by barriers arising from broader social and cultural date even before it is published. Combined with a global pandemic
considerations, including lack of infrastructure, poor governance, that has already seen multiple waves across the globe and changing
insufficient education and gender inequality. Paradoxically, greater political situations, a comprehensive overview will have significant
digital inclusion can also improve governance, education and gender gaps. Nevertheless, it remains important to understand how things
equality. Digital technologies can help address some of the toughest were prior to the pandemic and what the digital divide means in
development challenges, offering economic opportunities and terms of the Tropics. Although some data presented here are, without
overcoming remoteness and exclusion (World Bank, 2019). a doubt, dated, they still allow us to draw comparisons between
regions and understand where the focus will need to reside if we are
In 2020, the global COVID-19 pandemic brought focused attention to close the digital divide in the Tropics.
to the reality that digital inequality persists around the world due
to gaps in universal access, even in countries with high-speed This report will also focus on new, digital technologies rather than
connectivity infrastructure (ITU and UNESCO, 2020). Most countries older communication technology such as fixed-line telephony, radio
around the world issued home quarantine measures in the first and television.
ABOUT THIS REPORT
This report takes stock of the current and historical status of ICT by shared characteristics and challenges. To facilitate meaningful
and digital access across different regions of the Tropics. It presents analyses and reporting, it makes sense to develop groupings that
a broad-ranging, statistical analysis of a set of indicators relating ideally have some degree of commonality or internal homogeneity.
to ICT based on data collated from existing datasets from several There are several ways that this could be undertaken, including by
authoritative and multi-lateral sources, including various United climate (wet/dry/temperate tropics) and by national borders. As
Nations agencies, the World Bank, the ITU and other repositories. the majority of data available are reported on a national basis, it
The report considers access to communications technology, makes sense that ‘nations’ are the basis of regional aggregations.
the role of ICT in education (particularly in the context of the The regional groupings are listed below, and the nations that
pandemic), and the importance of ICT in global trade, e-commerce comprise each region are listed in Appendix A.
and global waste flows. It also includes case studies on the Pacific, • Central and Southern Africa
mobile money, cobalt mining and digital health. • Northern Africa and Middle East
• Caribbean
• Central America
Regions of the Tropics • South America
With most of the world’s biological and cultural diversity and a • Oceania
range of socio-political and economic systems, the world’s tropical • South-East Asia
zone is defined by its diversity. Nonetheless, the region is united • South Asia
INTRODUCTION 9Central America Caribbean South America Northern Africa & Middle East Central & South Africa South Asia South East Asia Oceania
Figure 1.3 Tropical regions of the world used in State of the Tropics analyses.
Nations of the Tropics • Nations that are wholly within the Tropics are included.
In assessing which nations and territories should be included in the • Nations partially within the Tropics are included if—
report, two processes were applied. The first used a population- • the majority of the population (i.e., more than 50%) lives
based decision tool to assess whether nations partially in the in the Tropics (e.g., Brazil and India), or
Tropics should be included in the report, and the second reviewed • the proportion of the population living in the Tropics is 5%
data availability to assess whether sufficient data are available to or more of the region’s population living in the Tropics (e.g.,
warrant a nation’s inclusion in the report. Australia and China).
The geographic area that is the Tropics is clearly defined as the Using this decision tool, 134 nations and territories were assessed
region between the Tropics of Cancer and Capricorn. However, as being in the Tropics.
national borders do not neatly align with these latitudinal lines, and
there are many nations and territories that straddle the zone. Countries and territories assessed as being in the Tropics can be
found in Appendix A.
The following practical approach has been applied to select nations
and territories to be included in the report:
THE STATE OF THE TROPICS PROJECT
In early 2011, a group of leading research institutions with a common To answer the question of whether life is improving in the Tropics,
interest in the future of the tropical world came together to examine an evaluation of progress was made on national, regional and global
the condition of life in the Tropics. Their goal was to examine the scales. In this case, progress refers to an increase in the sustainable
condition of life in the Tropics and answer the underlying question: is and equitable wellbeing of a society. It is multidimensional and
includes economic, social and environmental factors along with
life in the Tropics getting better?
other areas considered important to quality of life (e.g., culture or the
The State of the Tropics 2014 Report was the first product of that quality of governance). That report identified that life in the Tropics
is indeed getting better, but progress is uneven and often at the
collaboration. By assessing a broad range of environmental, social
expense of the natural environment.
and economic indicators, it illuminated the people and issues of the
tropical world and contributed to efforts to improve the lives of the A number of other key activities have taken place since the
people of the Tropics and their environments. publication of the 2014 report. The State of the Tropics Project
10 STATE OF THE TROPICS REPORT 2021continued to bring together leading research institutions from across Bellagio Center Workshop to help shape a strategic road map to
the tropical world to assess the state of the region and to examine strengthen the State of the Tropics consortium of universities and
the implications of the immense changes the region is experiencing. other institutions. The consortium agreed to work together to drive
In doing so, it aims to build effective partnerships between tropical productivity through better educational outcomes, improved health,
research institutions, build local research capacity and argue for the greater equity and more informed policy leading to sustainable
critical importance of the tropical zone in achieving a sustainable, development in the Tropics. It will do this by having an orientation
prosperous and equitable global future. to the future, a clear timeframe for success, creating connectivity
between regions of the Tropics, and focusing on the youth of the
In 2016, the State of the Tropics Project welcomed the United
Tropics grounded in targeted and reliable data.
Nation’s decision to declare 29 June as the International Day
of the Tropics. The initiative was spearheaded by the Australian In 2019, a report on Health in the Tropics was published. This
Government in close collaboration with the institutions involved in
report took stock of the current and historical status of health
the State of the Tropics Project. The International Day of the Tropics
and wellbeing across different regions of the Tropics. This report
was designated to raise awareness of the specific challenges faced by
considered infectious disease, non-communicable disease, maternal
tropical areas, the far-reaching implications of the issues affecting the
and child health, mental Illness, substance abuse and accident and
world’s tropical zone and the need, at all levels, to raise awareness
injury. It also explored the health workforce in the Tropics.
and emphasise the vital role that countries in the Tropics will play in
achieving the Sustainable Development Goals. The date was chosen, In 2020, another major report on the State of the Tropics was
as it is the anniversary of the launch of the first State of the Tropics published. This report provided a timely update on the 2014 report
report by Nobel Laureate Daw Aung Sun Suu Kyi.
and came at a critical time for the Tropics and its people. As the
In 2017, a second major report was published focusing on sustainable world faced the COVID-19 pandemic of 2020, it was an important
infrastructure development in the Tropics. This report explored time to stop and take stock once again. How far have we come?
the tropical infrastructure gap and the challenges of meeting How far do we need to go? How will we get there? How will the
infrastructure needs while balancing environmental change and Tropics overcome one of the greatest challenges facing the world
impacts on health and wellbeing. in 100 years? The 2020 report will provide a baseline from which to
measure the true impact of this world-changing event on the Tropics.
Also in 2017, the State of the Tropics Project brought together
a diverse group of distinguished researchers, private sector All State of the Tropics reports are available to download from
representatives, practitioners and policymakers through a Rockefeller jcu.edu.au/state-of-the-tropics.
REFERENCES
ITU & UNESCO 2020. The state of broadband: Tackling digital inequalities, a WORLD BANK 2019. Digital development partnership—Annual review
decade for action. Geneva: UNESCO. 2019. Making sure that no one is left behind in the digital age. The World
Bank. Washington DC.
UNICEF 2020. How many children and young people have internet
access at home?: estimating digital connectivity during the COVID-19 WORLD ECONOMIC FORUM 2021. The global risks report 2021—16th
pandemic. Geneva: UNICEF. Edition. Insight Report. San Francisco, USA: World Economic Forum.
UNITED NATIONS 2020. Narrowing digital divide could become ‘greatest
equalizer’ in promoting equality, Secretary-General tells online
conference, calling on nations to support youth. New York, USA: United
Nations.
INTRODUCTION 112 DIG ITAL AC C E S S IN T HE T ROPI CS 12 STATE OF THE TROPICS REPORT 2021
SUMMARY

               ŵ The impact of the mobile phone across the world has been profound.
               ŵ Globally, mobile phone ownership appears universal, with subscriptions out numbering people. In 2019, there
                   were 108 mobile phone subscriptions for every 100 people globally. This equates to some 8.7 billion active mobile
                   cellular subscriptions.
               ŵ   In the Tropics, access to mobile phones has increased dramatically since the turn of the century but still trails
                   behind the rest of the world. In 2000, there were fewer than five mobile phones per 100 people in the Tropics. By
                   2019, this number had grown to more than 97 per 100.
               ŵ   According to the latest available estimates from the ITU, in 2019, 53.5% of people worldwide used the internet in
                   2019—an increase from just 17% in 2005.
               ŵ   In 2019, estimates suggest just 37.1% of people used the internet in the Tropics—indicating that the gap between
                   the Tropics and the rest of the world has actually widened since previous State of the Tropics reports.
               ŵ   Recent advances in mobile technology have allowed more people to access the internet through the use of
                   internet-enabled mobile devices, particularly smartphones. This has allowed far more people access to the internet
                   without ever having to be connected by a fixed line. However, access to the internet through mobile broadband
                   remains low in many parts of the Tropics.
               ŵ   Low Earth Orbit (LEO) satellite constellations could be transformative for expanding high-speed internet to
                   underserved regions. However, the costs, both monetary and environmental, are potentially high.
               ŵ   The groups of people who have access to and use the internet vary between regions, gender and age. People living
                   in urban areas are more likely to use the internet, men are more likely than women, and young people are more
                   likely than the elderly.
               ŵ    There is no doubt that access to mobile phones and the internet has changed and continues to change how we
                   communicate, work, do business, learn and interact with culture and art. During the various stages of lockdown
                   imposed across the world in 2020, these forms of communication became more important than ever.

PHOTO: ARNE HOEL, WORLD BANK                                                                   2 :: DIGITAL ACCESS IN THE TROPICS       13
INTRODUCTION
People across the globe are more connected than ever. Digital on the planet, a distortion in the data caused by multiple
technologies, mobile phones, the internet and other forms of digital subscriptions and the inclusion of inactive accounts tends to
information exchange have changed the way business and education overestimate the true number of people using mobile phones.
are conducted and how knowledge is shared. ICT refers to any Thus, some caution should be applied in interpreting total
technology that enables the communication and electronic capture, numbers in this indicator. However, subscription data provides
processing and transmission of information. This includes older an important insight into the increase in mobile connections
technologies such as radio, television and fixed-line telephony, as and access and allows comparison between regions.
well as more recent innovations such as personal computers, mobile
phones, broadband networks and the internet. The potential of these Mobile cellular telephone subscriptions are subscriptions to a
new technologies lies in their capacity to instantaneously connect public mobile telephone service using cellular technology. The
vast networks of individuals, organisations and governments, across indicator includes the number of post-paid subscriptions and
all corners of the world. ICT can provide many opportunities for the number of active prepaid accounts (i.e., that have been used
education, entrepreneurship and new modes of finance and banking during the last three months). The indicator applies to all mobile
and play a role in reducing corruption. cellular subscriptions that offer voice communications. It excludes
subscriptions via data cards or USB modems, subscriptions to public
Tropical nations have experienced rapid but uneven growth in ICT mobile data services, private trunked mobile radio, telepoint, radio
access and use in recent decades. Although mobile phones have paging and telemetry services (World Bank, 2020).
become commonplace throughout the Tropics, the adoption of
the internet and high-speed broadband in particular has been Globally, it appears mobile phone ownership is now universal,
slower, limiting the diffusion of ICT to services, business and with subscriptions out numbering people according to the ITU (see
governments. Further, nominal access to technology is often Figure 2.1). In 2019, there were 108 mobile phone subscriptions for
not enough; a lack of digital literacy can prevent the realisation every 100 people globally. This equates to some 8.7 billion active
of the full potential of ICT. In many cases, poor access to other mobile cellular subscriptions.
basic infrastructure and services is more important and overrides
the benefits of ICT facilities. In many rural areas of the Tropics, In the Tropics, access to mobile phones has increased dramatically
for example, accessing electricity to charge a mobile phone or since the turn of the century, but it still trails behind the rest of the
computer is often more difficult than purchasing the phone to world. In 2000, there were fewer than five mobile phones per 100
begin with (World Bank, 2012). This may go some way to explaining people in the Tropics. By 2019, this number had grown to more
why, according to the 2016 World Development Report, ‘the effect than 97 per 100—approaching universal access. The growth rate in
of technology on global productivity, expansion of opportunity mobile phone subscriptions has slowed in recent years, indicating
for the poor and the middle class and the spread of accountable saturation in many regions as well as, potentially, the correction of
governance has been less than expected’ (World Bank, 2016b). out-of-date subscription data (World Bank, 2016).
The very first aspect of the digital divide is simply having access to Although there has been considerable variation in the growth rate
the technology. This chapter will cover access to mobile phones of mobile phone access across the tropical regions, uptake has
and the internet by individuals through both fixed and mobile been significant and rapid, particularly since 2005. Coverage in
connections. Central and Southern Africa, Oceania, the Caribbean and Northern
Africa and the Middle East remained below 80 subscriptions per
100 people in 2019 despite rapid uptake over the past decade. But
growth in subscriptions has slowed in these regions since 2015. In
Trends
other regions, there has actually been a decline in the past couple
Mobile phone use of years. In South Asia, Central America and South America, it
Since becoming publicly available some 30 years ago, the is largely due to corrections in the data associated with inactive
mobile phone has become the world’s most widely used subscriptions. However, there have also been economic impacts
communication technology. While on the surface, the number (particularly in South America) that have slowed the uptake of
of mobile phones appears to exceed the total number of people phones in more impoverished regions of these countries.
14 STATE OF THE TROPICS REPORT 2021140
120
Subscriptions per 100 people
100
80
60
40
20
0
2007
2004
2000
2008
2006
2009
2003
2013
1991
2001
2011
1992
2002
2012
1995
2005
2015
1997
2017
1994
2014
1990
2010
1998
2018
1996
2016
1999
2019
1993
The Tropics Rest of the World World
Figure 2.1 Mobile Phone Subscriptions per 100 people in the Tropics, globally and the rest of the world.
International Telecommunications Union, 2020
160
140
Subscriptions per 100 people
120
100
80
60
40
20
0
2007
2004
2000
2008
2006
2009
2003
2001
2011
1992
2002
2012
1995
2005
2015
1997
2017
1994
2014
1990
2010
1998
2018
1996
2016
1999
2019
1993
2013
1991
Central & Southern Africa Northern Africa & Middle East South Asia
South East Asia Caribbean Central America
South America Oceania
Figure 2.2 Mobile cellular subscriptions per 100 people across the tropical regions.
International Telecommunications Union, 2020
2 :: DIGITAL ACCESS IN THE TROPICS 15Internet users yet unclear and may be a correction on earlier estimates. But, if
The World Wide Web has existed for just over 30 years; however, correct, it has important ramifications for India and the broader
recent data estimates 21.7 billion devices are now connected—a Tropics. Due to its large population, India has one of the largest and
number that continues to grow (ITU and UNESCO, 2019). Internet growing online populations in the world. It may simply represent
users are individuals who have used the internet from any location a transition taking place from fixed-line to mobile broadband, and
in the past three months of being surveyed. These data do not the data has not yet caught up. More recent estimates from other
represent subscriptions; they are based on household surveys. sources suggest internet use in India was as high as 45% in early
2021 (Datareportal, 2021).
According to the latest available estimates from the ITU, in 2019,
53.5% of people worldwide used the internet in 2019—an increase In some parts of the Tropics, namely Latin America and the
from just 17% in 2005. In the non-tropical world, internet use far Caribbean, internet user rates are comparable to, or greater than,
exceeds that of the Tropics. This considerable gap between the the global estimates (see Figure 2.6). Internet access growth
Tropics and the rest of the world has persisted since the turn of has been rapid in these regions and has accelerated since 2010.
the century. In 2019, estimates suggest just 37.1% of people used Dedicated government-supported programs have helped drive
the internet in the Tropics—indicating that the gap has actually growth in internet access. For example, in Colombia, a dedicated
widened since previous reporting in State of the Tropics reports. government ministry for Science, Technology and Innovation has
supported funding for significant digital infrastructure and public–
The slower growth rate in the Tropics is driven by South Asia, private partnerships aimed at closing the digital divide (OECD,
particularly India (see Figure 2.4), where the most recent estimates 2019). These regions are also highly urbanised (most people live in
actually show a decline in the proportion of people using the cities), giving people more access to ICT infrastructure.
internet between 2017 and 2018. The reason for this decline is as
70
60
50
% of population
40
30
20
10
0
2007
2004
2000
2008
2006
2009
2003
2001
2002
2012
2005
2015
2017
2014
2010
2018
2016
2019
2013
2011
The Tropics Rest of the World World
Figure 2.3 Internet users (% of population) in the Tropics, the rest of the world and globally.
International Telecommunications Union, 2020
16 STATE OF THE TROPICS REPORT 202170
60
% of population 50
40
30
20
10
0
2006
2009
2003
2001
2002
2005
2007
2004
2014
2000
2008
2010
2018
2016
2019
2013
2011
2012
2015
2017
Central & Southern Africa Northern Africa & Middle East South Asia
South East Asia Caribbean Central America
South America Oceania
Figure 2.4 Internet users (% of population) across the tropical regions.
International Telecommunications Union, 2020
In the tropical African regions, however, access remains below mobile broadband has increased to be almost global (see Figure
25% despite rapid improvement since the early 2000s. In Oceania, 2.6). However, a gap exists between the population covered by
internet use has now exceeded 30%, but growth in use has been mobile broadband networks and those actually using them. There
slower than in other tropical regions. There are persistently low are many barriers, including governmental, cost and infrastructure,
levels of internet access in Papua New Guinea, Solomon Islands particularly electricity. In some countries, the cost of data is
and Kiribati. Low rates of internet use in Africa and Oceania point prohibitively expensive.
not only to a lack of ICT infrastructure but also unreliable energy
sources and low rates of digital literacy. Both of these barriers to The data included here are both active mobile broadband
internet access will be discussed in subsequent chapters. subscriptions per population and the percentage of the population
covered by at least a 3G network. Time series data are not available
The groups of people who have access to and use the internet vary for mobile broadband subscriptions, so the latest available data,
between regions, gender and age. People living in urban areas are 2015–2018, are used instead.
more likely to use the internet, men are more likely than women, and
young people are more likely than the elderly (World Bank, 2016).
Mobile broadband
Recent advances in mobile technology have allowed more people
to access the internet through internet-enabled mobile devices,
particularly smartphones. This has allowed far more people access
to the internet without ever being connected by a fixed line.
Smartphones and mobile internet access are some of the most
important and transformative technologies to arise in the twenty-
first century. Smartphone technology and the rapid increase
in third-party software applications means that low prices for
smartphones in developing countries are driving a digital revolution
with users and developers leveraging the potential and power of
mobile networks to transform services across sectors, including
agriculture, education, health, energy, water and sanitation
management. However, access to the internet through mobile
broadband remains low in many parts of the Tropics (see Figure
2.5). Recently, network coverage of at least third-generation (3G) CHILD IN NIGERIA. PHOTO: ARNE HOEL, WORLD BANK
2 :: DIGITAL ACCESS IN THE TROPICS 17Per 100 people
>120
19-120
60-90
30-60Affordability of ICT GB). Islands are less likely to have extensive fibre infrastructure;
Affordability of a mobile phone and internet data are an essential thus, more expensive solutions such as satellite uplink are often
part of the conversation around the digital divide. There is evidence used (Cable.co.uk, 2020). Conversely, the cheapest data in the
world can be purchased in India, Israel, Kyrgyzstan, Italy and
to suggest that affordability, or the ability of individuals or
Ukraine. All these countries also have excellent fibre infrastructure.
households to pay for telecom services relative to their disposable
Generally, sub-Saharan Africa is the most expensive region in
income, is one of the main barriers to the use of mobile phones
the world due to underdeveloped infrastructure and low access
and the internet. Affordability depends not only on both price and
rates, although there are some exceptions. Sudan has some of the
income but also on other competing spending choices.
cheapest data in the world due to almost sole reliance on mobile
data (Cable.co.uk, 2020).
The cost of data varies substantially across the world (see Figure
2.7). Although price does not translate directly as an indicator of South Asia and South-East Asia have some of the cheapest data
affordability, there are some assumptions we can make based on in the world due to a large, connected population and the rise of
our knowledge of income, poverty rate and development of various smartphone ownership. Generally, countries with cheap data are
countries. By far, the most expensive places to access the internet either wealthy countries with excellent infrastructure or those with
in the world are small remote islands: Sao Tome and Principe less advanced networks but are heavily reliant on mobile data; thus,
(US$28.26/GB); Bermuda (US$28.75/GB); and Nauru (US$30.47/ the market forces the prices lower.
US$ per 1GB
>20
10-20
2.5-10Human Rights Council of the General Assembly of the United to growth in GDP (de Silva et al., 2008), but the evidence
Nations passed Resolution A/HRC/32/L.20, which covers the demonstrating poverty alleviation is less clear and, in some cases,
promotion, protection and enjoyment of human rights on may be overly optimistic.
the internet (United Nations, 2016). This resolution explicitly
‘condemns unequivocally measures to intentionally prevent or A mobile phone is generally the first and only information
disrupt access to or dissemination of information online in violation communication technology used by people in the most remote
of international human rights law and calls on all States to refrain and rural areas of the Tropics. There has long been an assumption
and cease such measures’ (United Nations, 2016, p. 4). that access to mobile phones will benefit people living in rural
and remote regions, particularly in poor countries in the Tropics.
Despite this, in 2020 alone, Bangladesh, the DRC, Egypt, India, However, the evidence for this is mixed, particularly among the
Indonesia, Iran, Iraq, Sudan, Myanmar and Zimbabwe shut down poorest and most marginalised people in the Tropics.
the internet in all or some parts of their countries (Roth, 2020).
In early 2021, following a coup d’état, the military-controlled There are a number of ways that mobile phones can empower
government of Myanmar imposed several internet blackouts across the most impoverished people—they can mean safety, deliver
the country. Governments use internet shutdowns during elections, education, provide access to health care, provide access to markets
anti-government protests or armed conflict. While some prolonged and banking and even strengthen democracy.
internet shutdowns are measures taken to tackle insurgency
In Kerala, in southern India, small-scale fishers have benefitted
and political opposition, they have also been used for causes as
immensely from widespread mobile phone adoption. Mobile
small as preventing examination cheating (Kathuria et al., 2018).
phones have helped coordinate supply and demand, minimise
An internet shutdown has been defined by online digital rights
wastage, integrate markets and reduce price fluctuations
organisations Access Now as: ‘an intentional disruption of internet
(Abraham, 2007). Importantly, fishers also felt less isolated and
or electronic communications, rendering them inaccessible or
at-risk during emergencies (Abraham, 2007).
effectively unusable, for a specific population or within a location,
often to exert control over the information’ (Taye, 2019, p. 2). In the poorest parts of the world, people will often invest in
mobile phone technology before meeting the needs of improved
Internet shutdowns can have far-reaching consequences, even
sanitation, water, health, housing and education. It seems in many
for countries with already low internet use rates. According to
cases, people are willing to make these sacrifices because they see
an analysis by the Brookings Institute, internet shutdowns have
the mobile phone offering economic improvement (Diga, 2007).
created significant negative economic impacts across the world
(West, 2015). Looking at just the impact of shutdowns on GDP, the Mobiles phones are also known to provide a sense of safety and
analysis estimates that in 2015, India lost $US 968 million; Saudi connection and help to avoid unforeseen shocks. Research in
Arabia $US 465 million; Brazil $US 116 million; and the Republic Uganda demonstrated that the communication device provided
of Congo, $72 million from their economies (West, 2015). It is a means of timely responses, reduced surprises with available
important to note that this analysis did not include estimates information, allowed the ability to multi-task and plan during
for lost tax revenues, impacts on worker productivity, impacts on shocks, engaged less time to physically search for individuals and
business expansion or potential loss of investments and are thus, less emotional distress during difficult ordeals (Diga, 2007).
underestimates (West, 2015).
However, more recent research in Tanzania demonstrated that
Internet shutdowns also have negative social and health impacts. most mobile phone users do not benefit materially from mobile
They tend to undermine trust in the reliability of the internet, phones. Most users only use their phone for socialising and
separate family and friends, block access to online banking and entertainment and often sacrifice funds that might otherwise
government services and education and stop the media reporting go towards essentials such as food (Malm and Toyama, 2021).
(Internet Society, 2019). Importantly, the upfront cost associated with purchasing and
subscribing is often a large proportion of an individual’s income or
During a health crisis such as the COVID-19 pandemic, they can be
savings (Malm and Toyama, 2021) and can thus impoverish people
potentially deadly. The coronavirus pandemic highlights the role
further.
that the internet and mobile phones play as a service, not just a
tool of business or education. According to Human Rights Watch, In Indonesia, researchers found that, particularly in remote
internet shutdowns harm stay at home orders, block essential communities, people did not make new contacts or offset transport
information and thus undermine efforts to bring the pandemic costs by owning a mobile phone. Generally, phones were simply
under control (Human Rights Watch, 2020). used as an extension of their normal everyday life—they were
used to talk to friends and family, take photos and listen to music
Mobile phones and poverty alleviation
(Matous, 2017).
Access to mobile phones is often cited as an important factor
for economic growth and poverty alleviation. There is certainly Thus, the evidence for mobile phones alleviating poverty is mixed.
clear evidence that mobile phone and internet access contribute On the one hand, mobile phones can help alleviate some of the
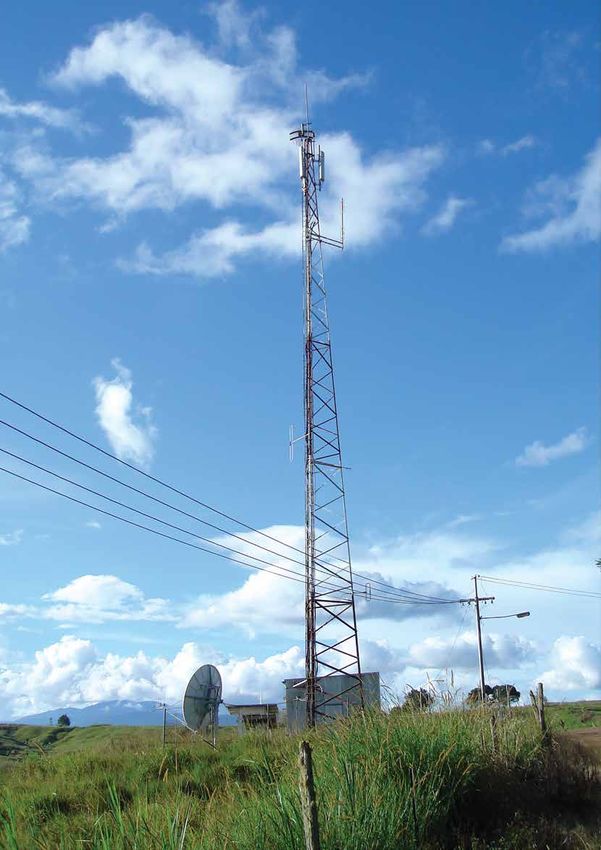
20 STATE OF THE TROPICS REPORT 2021PHOTO: EVAN SCHNEIDER UN PHOTO MOBILE PHONE TOWER, PNG. PHOTO: MICHAEL JOHNSON. 2 :: DIGITAL ACCESS IN THE TROPICS 21
dimensions of extreme poverty, such as having to walk to visit            However, new commercial LEO constellations, such as those
family or contact people during emergencies, but often people             being deployed by Starlink by SpaceX, Project Kuiper by Amazon,
will sacrifice food, sanitation and other needs to pay for the            OneWeb and Lightspeed by Telesat, among others, have the
mobile phone. For people who already have the means to access             potential to dramatically expand the availability of high-speed
markets and wish to improve their situation, a mobile phone is an         broadband internet access with levels of service that rival fibre optic
important tool. However, it is far from the panacea for extreme           cables in terms of speed and latency, and at significantly reduced
poverty it was often touted to be in the early years of the twenty-       price levels compared to traditional GEO satellites (Garrity and
first century. Unfortunately, ICT is not yet a substitute for a lack of   Husar, 2021). Thus, LEO constellations are considered potentially
transportation or sanitation in already marginalised communities.         transformational for internet connectivity around the world.

Bridging the divide: Satellite connections                                SpaceX’s Starlink is the most advanced LEO constellation in
                                                                          operation and is currently undergoing beta trials. Since 2019, they
A recent critical development in bridging the digital divide,
                                                                          have launched over 1,400 satellites with approval for 10,000 and
particularly for remote, unconnected regions, is the growing
                                                                          with plans to launch up to 42,000 (Rawls et al., 2020). According
potential of satellite connections. Satellite technologies generally
                                                                          to SpaceX, one of the aims of Starlink is to deliver high-speed
have a higher cost relative to terrestrial technology and are
                                                                          broadband internet to locations where access has been unreliable
far slower, and thus are used only where cable-based systems
                                                                          or completely unavailable (Starlink, 2021). There are some
are not financially viable due to low population densities or
                                                                          concerns, however, about the costs of LEO technology and its
large distances between populations (Finau, 2019). For many
                                                                          impact on ground-based astronomy (Rawls et al., 2020).
people in the Tropics, a satellite connection is the only option
available (Garrity and Husar, 2021). Even in situations where             Although LEO constellations are likely to provide broadband for
some terrestrial network infrastructure is available, satellite           lower prices than traditional GEO satellites, the cost could still
deployments might actually be preferred since they require only           be a significant barrier, particularly in low- and middle-income
electrical power and a clear line of sight to the sky (Garrity and        countries. There are significant manufacturing and maintenance
Husar, 2021). Until recently, most satellite-based internet was           costs—a Starlink satellite would need to be replaced after around
provided by geostationary orbit (GEO) satellites, positioned at           five years, and there are significant costs associated with launching
an altitude of 35,700 km, providing coverage over a very wide             new satellites (Daehnick et al., 2020). Some estimates suggest that
area. But due to distance from the surface, use is expensive, LEO         in its current form, a LEO broadband subscription would be around
and with high latency (Garrity and Husar, 2021). Despite this,            US$80 per month with up to $300 in start-up costs, far more than
GEO satellites have proved incredibly useful. For example, the            the vast majority of people in the Tropics can afford, particularly if
University of the South Pacific (USP) currently leases GEO satellite      there are cheaper terrestrial options available (Rawls et al., 2020).
communications systems to provide regional connectivity for               The future might see prices come down, though, particularly as
its satellite-based remote campuses (Finau, 2019). Known as               manufacturing and launch technology continues to improve.
USPNet, the university owns and operates this private network
purely for USP use. For USP’s distant students and staff, USPNet          One of the final criticisms of LEO technology come from
provides for the opportunity to participate in interactive audio          astronomers who suggest that the efficacy of land-based
tutorials (conducted from any campus), communicate by email               observatories will be impacted by the light trails of thousands of
with a lecturer, tutor or another student, access the World Wide          satellites (Rawls et al., 2020). Satellites continue to reflect sunlight
Web, watch a live video multicast, access multimedia material             after sunset and will cause bright streaks in astronomical images
via server downloads and, more recently, live video conferences           for most of the night (Tregloan-Reed et al., 2020). Due to these
(and tutoring) (University of the South Pacific, 2021).                   concerns, Starlink and Amazon have committed to work with global
                                                                          astronomical observatories to develop darkening technologies to
More recently, the increased use and potential of LEO                     limit the impact of LEO constellations (Tregloan-Reed et al., 2020,
constellations provide very different value propositions for internet
                                                                          Rawls et al., 2020).
connectivity in underserved regions (Garrity and Husar, 2021). LEO
satellites operate between 160 and 2,000 km altitude and have
previously been used, largely by governments, for Earth observation
and remote sensing.

LOOKING FORWARD

Access to mobile phones and the internet is the first important step      poverty alleviation. Equality of education, access to transport,
to bridge the digital divide in the Tropics. However, access and use      electricity, sanitation and health infrastructure all influence if and
of digital technologies are influenced by the political, cultural and     how people will use technology.
geographical context in which it is used.
                                                                          There are considerable barriers to overcome for the Tropics to
With the development of lower-cost, higher-quality satellite-based        achieve universal access to digital technologies. Some of these
technology, access will become cheaper and perhaps even universal;        barriers will be discussed in subsequent chapters.
however, this will be only one step towards financial inclusion and

  22      STATE OF THE TROPICS REPORT 2021
You can also read