2015 The State of Food Insecurity in the World - Meeting the 2015 international hunger targets: taking stock of uneven progress - FAO
←
→
Page content transcription
If your browser does not render page correctly, please read the page content below
2015
        The State of
Food Insecurity in the World

        Meeting the 2015
  international hunger targets:
taking stock of uneven progress
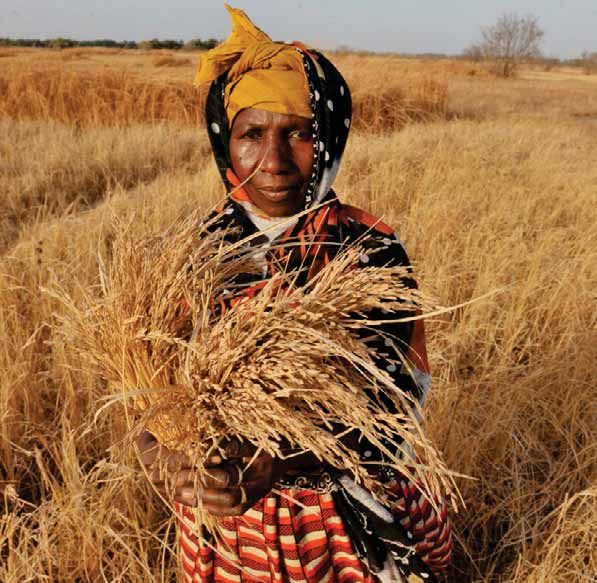
Cover photo: ©FAO/Seyllou Diallo

       FAO information products are available on the FAO website (www.fao.org/publications)
       and can be purchased through publications-sales@fao.org
Key messages

J About 795 million people are undernourished          western Africa, south-eastern Asia and
   globally, down 167 million over the last            South America, undernourishment declined
   decade, and 216 million less than in                faster than the rate for child underweight,
   1990–92. The decline is more pronounced             suggesting room for improving the quality of
   in developing regions, despite significant           diets, hygiene conditions and access to clean
   population growth. In recent years, progress        water, particularly for poorer population
   has been hindered by slower and less                groups.
   inclusive economic growth as well as political
   instability in some developing regions,          J Economic growth is a key success factor
   such as Central Africa and western Asia.           for reducing undernourishment, but it has
                                                      to be inclusive and provide opportunities
J The year 2015 marks the end of the                  for improving the livelihoods of the poor.
  monitoring period for the Millennium                Enhancing the productivity and incomes of
  Development Goal targets. For the                   smallholder family farmers is key to progress.
  developing regions as a whole, the share
  of undernourished people in the total             J Social protection systems have been critical
  population has decreased from 23.3 percent          in fostering progress towards the MDG 1
  in 1990–92 to 12.9 per cent. Some regions,          hunger and poverty targets in a number
  such as Latin America, the east and south-          of developing countries. Social protection
  eastern regions of Asia, the Caucasus and           directly contributes to the reduction of
  Central Asia, and the northern and western          poverty, hunger and malnutrition by
  regions of Africa have made fast progress.          promoting income security and access to
  Progress was also recorded in southern Asia,        better nutrition, health care and education.
  Oceania, the Caribbean and southern and             By improving human capacities and mitigating
  eastern Africa, but at too slow a pace to reach      the impacts of shocks, social protection fosters
  the MDG 1c target of halving the proportion          the ability of the poor to participate in growth
  of the chronically undernourished.                   through better access to employment.

J A total of 72 developing countries out of 129,    J In many countries that have failed to reach
   or more than half the countries monitored,         the international hunger targets, natural and
   have reached the MDG 1c hunger target.              human-induced disasters or political instability
   Most enjoyed stable political conditions            have resulted in protracted crises with
   and economic growth, often accompanied              increased vulnerability and food insecurity of
   by social protection policies targeted at           large parts of the population. In such contexts,
   vulnerable population groups.                       measures to protect vulnerable population
                                                       groups and improve livelihoods have been
J For the developing regions as a whole, the           difficult to implement or ineffective.
  two indicators of MDG 1c – the prevalence
  of undernourishment and the proportion of
  underweight children under 5 years of age –
  have both declined. In some regions, including
2015

        The State of
Food Insecurity in the World
           Meeting the 2015
     international hunger targets:
   taking stock of uneven progress

FOOD AND AGRICULTURE ORGANIZATION OF THE UNITED NATIONS
                      Rome, 2015
Required citation: FAO, IFAD and WFP. 2015. The State of Food Insecurity in the World 2015. Meeting the 2015 international hunger targets: taking stock of uneven progress. Rome, FAO. The designations employed and the presentation of material in this information product do not imply the expression of any opinion whatsoever on the part of the Food and Agriculture Organization of the United Nations (FAO), the International Fund for Agricultural Development (IFAD) or of the World Food Programme (WFP) concerning the legal or development status of any country, territory, city or area or of its authorities, or concerning the delimitation of its frontiers or boundaries. The mention of specific companies or products of manufacturers, whether or not these have been patented, does not imply that these have been endorsed or recommended by FAO, IFAD or WFP in preference to others of a similar nature that are not mentioned. The designations employed and the presentation of material in the maps do not imply the expression of any opinion whatsoever on the part of FAO, IFAD or WFP concerning the legal or constitutional status of any country, territory or sea area, or concerning the delimitation of frontiers. ISBN 978-92-5-108785-5 FAO encourages the use, reproduction and dissemination of material in this information product. Except where otherwise indicated, material may be copied, downloaded and printed for private study, research and teaching purposes, or for use in non-commercial products or services, provided that appropriate acknowledgement of FAO as the source and copyright holder is given and that FAO’s endorsement of users’ views, products or services is not implied in any way. All requests for translation and adaptation rights, and for resale and other commercial use rights should be made via www.fao.org/contact-us/licence-request or addressed to copyright@fao.org. FAO information products are available on the FAO website (www.fao.org/publications) and can be purchased through publications-sales@fao.org. © FAO 2015
C O N T E N T S
  4    Foreword
  6    Acknowledgements

8		    Undernourishment around the world in 2015

8		    The global trends
10		   Wide differences persist among regions
17		   Key findings

19 Inside the hunger target:
		 comparing trends in undernourishment
		 and underweight in children

19		   Regional patterns
25		   Key findings

26
   Food security and nutrition:
		 the drivers of change

27		   Economic growth and progress towards food security and nutrition
       targets
31		   The contribution of family farming and smallholder agriculture
       to food security
33		   International trade and food security linkages
35		   The relevance of social protection for hunger trends between
       1990 and 2015
37		   Protracted crises and hunger
42		   Key findings

44     Technical annex

44     Annex 1: Prevalence of undernourishment and progress towards the World
       Food Summit (WFS) and the Millennium Development Goal (MDG) targets
       in developing regions
48     Annex 2: Methodology for assessing food security
       and progress towards the international hunger targets
53     Annex 3: Glossary of selected terms used in the report

54		   Notes
T
F O R E W O R D
his year´s annual State of Food Insecurity in the World report takes stock of progress made
towards achieving the internationally established hunger targets, and reflects on what needs
to be done, as we transition to the new post-2015 Sustainable Development Agenda.
United Nations member states have made two major commitments to tackle world hunger.
The first was at the World Food Summit (WFS), in Rome in 1996, when 182 governments
committed “... to eradicate hunger in all countries, with an immediate view to reducing the
number of undernourished people to half their present level no later than 2015”. The second
was the formulation of the First Millennium Development Goal (MDG 1), established in 2000 by
the United Nations members, which includes among its targets “cutting by half the proportion of
people who suffer from hunger by 2015”.
In this report, we review progress made since 1990 for every country and region as well as for
the world as a whole. First, the good news: overall, the commitment to halve the percentage of
hungry people, that is, to reach the MDG 1c target, has been almost met at the global level.
More importantly, 72 of the 129 countries monitored for progress have reached the MDG target,
29 of which have also reached the more ambitious WFS goal by at least halving the number of
undernourished people in their populations.
Marked differences in progress occur not only among individual countries, but also across
regions and subregions. The prevalence of hunger has been reduced rapidly in Central, Eastern
and South-Eastern Asia as well as in Latin America; in Northern Africa, a low level has been
maintained throughout the MDG and WFS monitoring periods. Other regions, including the
Caribbean, Oceania and Western Asia, saw some overall progress, but at a slower pace. In two
regions, Southern Asia and sub-Saharan Africa, progress has been slow overall, despite many
success stories at country and subregional levels. In many countries that have achieved modest
progress, factors such as war, civil unrest and the displacement of refugees have often frustrated
efforts to reduce hunger, sometimes even raising the ranks of the hungry.
Progress towards the MDG 1c target, however, is assessed not only by measuring
undernourishment, or hunger, but also by a second indicator – the prevalence of underweight
children under five years of age. Progress for the two indicators was similar, but slightly faster in
the case of undernourishment. While both indicators have moved in parallel for the world as a
whole, they diverge significantly at the regional level owing to the different determinants of child
underweight.
Overall progress notwithstanding, hunger remains an everyday challenge for almost
795 million people worldwide, including 780 million in the developing regions. Hence, hunger
eradication should remain a key commitment of decision-makers at all levels.
In this year’s State of Food Insecurity of the World, we not only estimate the progress already
achieved, but also identify remaining problems, and offer recommendations for how these can be
addressed. In a nutshell, there is no “one-size-fits-all” solution. Interventions must be tailored to
conditions, including food availability and access, as well as longer-term development prospects.
Approaches need to be appropriate and comprehensive, with the requisite political commitment
to secure success.
Much work, therefore, remains to be done to eradicate hunger and achieve food security
across all its dimensions. This report identifies key factors that have determined success to date in
reaching the MDG 1c hunger target, and provides guidance on which policies should be
emphasized in the future.
Inclusive growth provides opportunities for those with meagre assets and skills, and improves
the livelihoods and incomes of the poor, especially in agriculture. It is therefore among the most
effective tools for fighting hunger and food insecurity, and for attaining sustainable progress.
Enhancing the productivity of resources held by smallholder family farmers, fisherfolk and forest
communities, and promoting their rural economic integration through well-functioning markets,
are essential elements of inclusive growth.
Social protection contributes directly to the reduction of hunger and malnutrition.
By increasing human capacities and promoting income security, it fosters local economic
development and the ability of the poor to secure decent employment and thus partake of
economic growth. There are many “win-win” situations to be found linking family farming and
social protection. They include institutional purchases from local farmers to supply school meals
4 THE STATE OF FOOD INSECURITY IN THE WORLD 2015F O R E W O R D
and government programmes, and cash transfers or cash-for-work programmes that allow
communities to buy locally produced food.
During protracted crises, due to conflicts and natural disasters, food insecurity and
malnutrition loom even larger. These challenges call for strong political commitment and effective
actions.
More generally, progress in the fight against food insecurity requires coordinated and
complementary responses from all stakeholders. As heads of the three Rome-based food and
agriculture agencies, we have been and will continue to be at the forefront of these efforts,
working together to support member states, their organizations and other stakeholders to
overcome hunger and malnutrition.
Major new commitments to hunger reduction have recently been taken at the regional level –
the Hunger-Free Latin America and the Caribbean Initiative, Africa’s Renewed Partnership to End
Hunger by 2025, the Zero Hunger Initiative for West Africa, the Asia-Pacific Zero Hunger
Challenge, and pilot initiatives of Bangladesh, the Lao People’s Democratic Republic, Myanmar,
Nepal and Timor-Leste, among other countries. Further initiatives are in the making to eradicate
hunger by the year 2025 or 2030.
These efforts deserve and have our unequivocal support to strengthen national capacities and
capabilities to successfully develop and deliver the needed programmes. Advances since 1990
show that making hunger, food insecurity and malnutrition history is possible. They also show
that there is a lot of work ahead if we are to transform that vision into reality. Political
commitment, partnership, adequate funding and comprehensive actions are key elements of this
effort, of which we are active partners.
As dynamic members of the United Nations system, we shall support national and other
efforts to make hunger and malnutrition history through the Zero Hunger Challenge, the 2014
Rome Declaration on Nutrition and the post-2015 Sustainable Development Agenda.
José Graziano da Silva Kanayo F. Nwanze Ertharin Cousin
FAO Director-General IFAD President WFP Executive Director
THE STATE OF FOOD INSECURITY IN THE WORLD 2015 5A C K N O W L E D G E M E N T S
The State of Food Insecurity in the World has been jointly prepared by the Food and Agriculture
Organization of the United Nations (FAO), the International Fund for Agricultural Development
(IFAD) and the World Food Programme (WFP).
Technical coordination of the publication was carried out, under the overall leadership of Jomo
Kwame Sundaram, by Pietro Gennari, with the support of Kostas Stamoulis of the FAO Economic
and Social Development Department (ES). Piero Conforti, George Rapsomanikis and Josef
Schmidhuber, of FAO, Rui Benfica, of IFAD, and Arif Husain of WFP served as technical editors.
Valuable comments and final approval of the report were provided by the executive heads of the
three Rome-based agencies and their offices, with Coumba Dieng Sow and Lucas Tavares (FAO).
The section on Undernourishment around the world in 2015 was drafted with technical inputs
from Filippo Gheri, Erdgin Mane, Nathalie Troubat and Nathan Wanner, and the Food Security
and Social Statistics team of the FAO Statistics Division (ESS). Supporting data were provided by
Mariana Campeanu, Tomasz Filipczuk, Nicolas Sakoff, Salar Tayyib and the Food Balance Sheets
team of the same Division.
The section on Inside the hunger target: comparing trends in undernourishment and
underweight in children was prepared with substantive inputs from Chiara Brunelli and the Food
Security and Social Statistics team of the FAO Statistics Division (ESS).
The section on Food security and nutrition: the drivers of change was prepared with inputs
from Federica Alfani, Lavinia Antonacci, Romina Cavatassi, Ben Davis, Julius Jackson, Panagiotis
Karfakis, Leslie Lipper, Luca Russo and Elisa Scambelloni of the FAO Agricultural Development
Economics Division (ESA); Ekaterina Krivonos and Jamie Morrison of the FAO Trade and Markets
Division (EST); Meshack Malo, of the FAO Office of the Deputy Director-General Natural
Resources; Francesco Pierri of the FAO Office for Partnerships, Advocacy and Capacity
Development; Constanza Di Nucci (IFAD); and Niels Balzer, Kimberly Deni, Paul Howe, Michelle
Lacey and John McHarris (WFP).
Filippo Gheri was responsible for preparing Annex 1 and the related data processing. Nathan
Wanner, with key technical contributions from Carlo Cafiero, prepared Annex 2.
Valuable comments and suggestions were provided by Raul Benitez, Eduardo Rojas Briales,
Gustavo Merino Juárez, Arni Mathiesen, Eugenia Serova and Rob Vos (FAO); Karim Hussein and
Edward Heinemann (IFAD); and Richard Choularton and Sarah Kohnstamm (WFP).
Michelle Kendrick (ES) coordinated the editorial, graphics, layout and publishing process.
Graphic design and layout services were provided by Flora Dicarlo. Production of the translated
editions was coordinated by the FAO Library and Publications Branch of the Office for Corporate
Communication. Translation and printing services were coordinated by the Meeting Programming
and Documentation Service of the FAO Conference, Council and Protocol Affairs Division.
6 THE STATE OF FOOD INSECURITY IN THE WORLD 2015Undernourishment around the world in 2015
The global trends
P
rogress continues in the fight against hunger, yet an population, or the prevalence of undernourishment (PoU),1
unacceptably large number of people still lack the food has decreased from 18.6 percent in 1990–92 to 10.9 percent
they need for an active and healthy life. The latest in 2014–16, reflecting fewer undernourished people in a
available estimates indicate that about 795 million people in growing global population. Since 1990–92, the number of
the world – just over one in nine – were undernourished in undernourished people has declined by 216 million globally,
2014–16 (Table 1). The share of undernourished people in the a reduction of 21.4 percent, notwithstanding a 1.9 billion
TABLE 1
Undernourishment around the world, 1990–92 to 2014–16
Number of undernourished (millions) and prevalence (%) of undernourishment
1990–92 2000–02 2005–07 2010–12 2014–16*
No. % No. % No. % No. % No. %
WORLD 1 010.6 18.6 929.6 14.9 942.3 14.3 820.7 11.8 794.6 10.9
DEVELOPED REGIONS 20.0Undernourishment around the world in 2015
increase in total population over the same period. The vast the needed acceleration does not seem to have materialized
majority of the hungry live in the developing regions,2 where in the developing regions as a whole.
an estimated 780 million people were undernourished in The other target, set by the WFS in 1996, has been missed
2014–16 (Table 1). The PoU, standing at 12.9 percent in by a large margin. Current estimates peg the number of
2014–16, has fallen by 44.5 percent since 1990–92. undernourished people in 1990–92 at a little less than a billion
Changes in large populous countries, notably China and in the developing regions. Meeting the WFS goal would have
India, play a large part in explaining the overall hunger required bringing this number down to about 515 million,
reduction trends in the developing regions.3 Rapid progress that is, some 265 million fewer than the current estimate for
was achieved during the 1990s, when the developing 2014–16 (Table 1). However, considering that the population
regions as a whole experienced a steady decline in both the has grown by 1.9 billion since 1990–92, about two billion
number of undernourished and the PoU (Figure 1). This was people have been freed from a likely state of hunger over the
followed by a slowdown in the PoU in the early 2000s before past 25 years.
a renewed acceleration in the latter part of the decade, with Significant progress in fighting hunger over the past
the PoU falling from 17.3 percent in 2005–07 to decade should be viewed against the backdrop of a
14.1 percent in 2010–12. Estimates for the most recent challenging global environment: volatile commodity prices,
period, partly based on projections, have again seen a phase overall higher food and energy prices, rising unemployment
of slower progress, with the PoU declining to 12.9 percent and underemployment rates and, above all, the global
by 2014–16. economic recessions that occurred in the late 1990s and
again after 2008. Increasingly frequent extreme weather
■■ Measuring global progress against targets events and natural disasters have taken a huge toll in terms
of human lives and economic damage, hampering efforts to
The year 2015 marks the end of the monitoring period for the enhance food security. Political instability and civil strife have
two internationally agreed targets for hunger reduction. The added to this picture, bringing the number of displaced
first is the World Food Summit (WFS) goal. At the WFS, held persons globally to the highest level since the Second World
in Rome in 1996, representatives of 182 governments War. These developments have taken their toll on food
pledged “... to eradicate hunger in all countries, with an security in some of the most vulnerable countries, particularly
immediate view to reducing the number of undernourished
people to half their present level no later than 2015”.4 The
FIGURE 1
second is the Millennium Development Goal 1 (MDG 1)
hunger target. In 2000, 189 nations pledged to free people The trajectory of undernourishment in developing regions:
from multiple deprivations, recognizing that every individual actual and projected progress towards the MDG and WFS
has the right to dignity, freedom, equality and a basic targets
standard of living that includes freedom from hunger and
violence. This pledge led to the formulation of eight Millions Percentage
1 100 45
Millennium Development Goals (MDGs) in 2001. The MDGs
were then made operational by the establishment of targets 1 000
991
40
and indicators to track progress, at national and global levels, 908
927
over a reference period of 25 years, from 1990 to 2015. The 900 35
first MDG, or MDG 1, includes three distinct targets: halving 800 30
805
global poverty, achieving full and productive employment and 780
decent work for all, and cutting by half the proportion of 700 25
people who suffer from hunger5 by 2015. FAO has monitored 600
23.3%
20
17.3%
progress towards the WFS and the MDG 1c hunger targets, 18.2%
WFS target
using the three-year period 1990–92 as the starting point. 500 12.9%
15
14.1%
The latest PoU estimates suggest that the developing MDG target
400 10
regions as a whole have almost reached the MDG 1c hunger
target. The estimated reduction in 2014–16 is less than one 300 5
percentage point away from that required to reach the
target by 2015 (Figure 1).6 Given this small difference, and 0 0
allowing for a margin of reliability of the background data 1990–92 2000–02 2005–07 2010–12 2014–16
used to estimate undernourishment, the target can be
Number of people undernourished (left axis)
considered as having been achieved. However, as indicated
Prevalence of undernourishment (right axis)
in the 2013 and 2014 editions of this report, meeting the
target exactly would have required accelerated progress in
Note: Data for 2014–16 refer to provisional estimates.
recent years. Despite significant progress in many countries, Source: FAO.
THE STATE OF FOOD INSECURITY IN THE WORLD 2015 9Undernourishment around the world in 2015
in sub-Saharan Africa, while other regions such as Eastern improving the quality of their diet. Even where policies have
and South-Eastern Asia, have remained unaffected or have been successful in addressing large food-energy deficits,
been able to minimize the adverse impacts. dietary quality remains a concern. Southern Asia and sub-
The changing global economic environment has Saharan Africa remain particularly exposed to what has
challenged traditional approaches to addressing hunger. become known as “hidden hunger” – the lack of, or
Social safety nets and other measures that provide targeted inadequate, intake of micronutrients, resulting in different
assistance to the most vulnerable population groups have types of malnutrition, such as iron-deficiency anaemia and
received growing attention. The importance of such targeted vitamin A deficiency.
measures, when combined with long-term and structural How the challenges posed by the global economic
interventions, lies in their ability to lead to a virtuous circle of environment affect individual regions, and the policies
better nutrition and higher labour productivity. Direct adopted to counteract them, are discussed in greater detail in
interventions are most effective when they target the most the third section of this report, “Food security and nutrition:
vulnerable populations and address their specific needs, the drivers of change (see pp. 26–42)”.
Wide differences persist among regions
Progress towards improved food security continues to be countries. In two regions, Southern Asia and sub-Saharan
uneven across regions. Some regions have made remarkably Africa, progress has been slow overall. While some countries
rapid progress in reducing hunger, notably the Caucasus and report successes in reducing hunger, undernourishment and
Central Asia, Eastern Asia, Latin America and Northern other forms of malnutrition remain at overall high levels in
Africa. Others, including the Caribbean, Oceania and these regions.
Western Asia, have also reduced their PoU, but at a slower The different rates of progress across regions have
pace. Progress has also been uneven within these regions, brought about changes in the regional distribution of
leaving significant pockets of food insecurity in a number of hunger since the early 1990s (Figure 2). Southern Asia and
FIGURE 2
The changing distribution of hunger in the world: numbers and shares of undernourished people by region,
1990–92 and 2014–16
1990–92 2014-16 Number Regional share
(millions) (%)
H J
1990–92 2014–16 1990–92 2014–16
G I A H J
F A Developed regions 20 15 2.0 1.8
IA
F G B Southern Asia 291 281 28.8 35.4
E E
B C Sub-Saharan Africa 176 220 17.4 27.7
B D Eastern Asia 295 145 29.2 18.3
E South-Eastern Asia 138 61 13.6 7.6
D
F Latin America
and the Caribbean 66 34 6.5 4.3
G Western Asia 8 19 0.8 2.4
H Northern Africa 6 4 0.6 0.5
D
C C I Caucasus and
Central Asia 10 6 0.9 0.7
J Oceania 1 1 0.1 0.2
Total = 1 010 million Total = 795 million Total 1 011 795 100 100
Note: The areas of the pie charts are proportional to the total number of undernourished in each period. Data for 2014–16 refer to provisional estimates. All figures are rounded.
Source: FAO.
10 THE STATE OF FOOD INSECURITY IN THE WORLD 2015Undernourishment around the world in 2015
sub-Saharan Africa now account for substantially larger the MDG 1c hunger target, but would need a further
shares of global undernourishment.7 The shares for reduction of about 140 million undernourished people to
Oceania and Western Asia also rose, albeit by much reach the WFS goal – an achievement that is unlikely to
smaller margins and from relatively low levels. In tandem, materialize in the near future. Latin America and the
faster-than-average progress in Eastern Asia and Latin Caribbean, considered together, have achieved both the
America and the Caribbean means that these regions now MDG 1c hunger target and the WFS goal in 2014–16. Finally,
account for much smaller shares of global Oceania has reached neither the MDG 1c hunger target nor
undernourishment. the WFS goal.
Some countries have met both international targets.
■■ Progress towards the international hunger Based on the latest estimates, a total of 72 developing
targets countries have achieved the MDG 1c hunger target by 2014–
16 (Tables 2 and 3).9 Of these, 29 countries have also
Figure 3 shows how the various developing regions fare with reached the WFS goal. Another 31 developing countries
respect to these targets. The estimates suggest that Africa as have reached only the MDG 1c hunger target, either by
a whole, and sub-Saharan Africa in particular, will not reducing the PoU by 50 percent or more, or by bringing it
achieve the MDG 1c target. Northern Africa, by contrast, has below 5 percent. Finally, a third group of 12 countries is also
reached the target.8 The more ambitious WFS goal, however, categorized alongside those that have reached the MDG 1c
appears to be out of reach for Africa as a whole, as well as hunger target, as they have maintained their PoU close to or
for all its subregions. Asia as a region has already achieved below 5 percent since 1990–92.
FIGURE 3
Regions differ markedly in progress towards achieving the MDG and WFS hunger targets
Africa Asia
Millions Percentage Millions Percentage
250 233 50 900 40
213 219
210 742
200 40 750 35
637 666
182 600 512
30
150 25.4%
30
547
27.6% 22.7%
20.7% 20.0%
450 25
100 20 23.6% WFS target
WFS target 300 17.3%
20
MDG target
50 10 150
17.6%
15
MDG target
13.5%
12.1%
0 0 0 10
1990–92 2000–02 2005–07 2010–12 2014–16 1990–92 2000–02 2005–07 2010–12 2014–16
Latin America and the Caribbean Oceania
Millions Percentage Millions Percentage
75 20 1.5 40
66 1.3 1.3 1.3
60 1.4
60 16 1.2 32
1.0
14.7% 47
45 38
12 0.9 24
11.4% WFS target
15.7% 16.5%
34 14.2%
30 8 0.6 16
8.4% MDG target 15.4%
13.5% WFS target
6.4%
15 5.5% 4 0.3 8
MDG target
0 0 0.0 0
1990–92 2000–02 2005–07 2010–12 2014–16 1990–92 2000–02 2005–07 2010–12 2014–16
Number of people undernourished (left axis) Prevalence of undernourishment (right axis)
Note: Data for 2014–16 refer to provisional estimates.
Source: FAO.
THE STATE OF FOOD INSECURITY IN THE WORLD 2015 11Undernourishment around the world in 2015
TABLE 2
Countries that have achieved, or are close to reaching, the international hunger targets
WFS goal and Close to reaching MDG 1c target Close to reaching Prevalence of
MDG 1c target achieved WFS goal* achieved MDG 1c target * undernourishment below
(or close to) 5 percent since 1990
1 Angola 1 Algeria 1 Algeria 1 Cabo Verde 1 Argentina
2 Armenia 2 Indonesia 2 Bangladesh 2 Chad 2 Barbados
3 Azerbaijan 3 Maldives 3 Benin 3 Colombia 3 Brunei Darussalam
4 Brazil 4 Panama 4 Bolivia (Plurinational State of) 4 Ecuador 4 Egypt
5 Cameroon 5 South Africa 5 Cambodia 5 Jamaica 5 Kazakhstan
6 Chile 6 Togo 6 Costa Rica 6 Honduras 6 Lebanon
7 China 7 Trinidad and Tobago 7 Ethiopia 7 Paraguay 7 Republic of Korea
8 Cuba 8 Tunisia 8 Fiji 8 Rwanda 8 Saudi Arabia
9 Djibouti 9 Gambia 9 Sierra Leone 9 South Africa
10 Dominican Republic 10 Indonesia 10 Tunisia
11 Gabon 11 Iran 11 Turkey
12 Georgia 12 Jordan 12 United Arab Emirates
13 Ghana 13 Kiribati
14 Guyana 14 Lao People’s Democratic Republic
15 Kuwait 15 Malawi
16 Kyrgyzstan 16 Malaysia
17 Mali 17 Maldives
18 Myanmar 18 Mauritania
19 Nicaragua 19 Mauritius
20 Oman 20 Mexico
21 Peru 21 Morocco
22 Saint Vincent and the Grenadines 22 Mozambique
23 Samoa 23 Nepal
24 Sao Tome and Principe 24 Niger
25 Thailand 25 Nigeria
26 Turkmenistan 26 Panama
27 Uruguay 27 Philippines
28 Venezuela (Bolivarian Republic of) 28 Solomon Islands
29 Viet Nam 29 Suriname
30 Togo
31 Uzbekistan
*These countries are expected to reach the target before the year 2020.
Source: FAO calculations.
■■ Sub-Saharan Africa: some success stories, but number of undernourished people even increased by
the international hunger targets are far from 44 million between 1990–92 and 2014–16. Taking into
being met account the region’s declining PoU (Table 1, p. 8), this
reflects the region’s remarkably high population growth rate
In sub-Saharan Africa, just under one in every four people, of 2.7 percent per year. The slow pace of progress in
or 23.2 percent of the population, is estimated to be fighting hunger over the years is particularly worrisome.
undernourished in 2014–16 (Figure 4, p. 14). This is the While the PoU fell relatively rapidly between 2000–02 and
highest prevalence of undernourishment for any region and, 2005–07, this pace slowed in subsequent years, reflecting
with about 220 million hungry people in 2014–16, the factors such as rising food prices, droughts and political
second highest burden in absolute terms. In fact, the instability in several countries.
12 THE STATE OF FOOD INSECURITY IN THE WORLD 2015Undernourishment around the world in 2015
TABLE 3
Countries that have achieved the international hunger targets, by region
Sub-Saharan Eastern, Southern and Latin America and Caucasus and Northern Africa and
Africa South-Eastern Asia, and Oceania the Caribbean Central Asia Western Asia
Countries that met the MDG 1c target by halving the proportion of hungry people or bringing it under 5 percent by 2015
1 Benin 11 Bangladesh 22 Bolivia 27 Uzbekistan 28 Algeria
2 Ethiopia 12 Cambodia 23 Costa Rica 29 Iran
3 Gambia 13 Fiji 24 Mexico 30 Jordan
4 Malawi 14 Indonesia 25 Panama 31 Morocco
5 Mauritania 15 Kiribati 26 Suriname
6 Mauritius 16 Lao People’s Democratic Republic
7 Mozambique 17 Malaysia
8 Niger 18 Maldives
9 Nigeria 19 Nepal
10 Togo 20 Philippines
21 Solomon Islands
Countries that reached both the MDG 1c target and the WFS goal of halving the number of hungry people by 2015
1 Angola 8 China 13 Brazil 23 Armenia 28 Kuwait
2 Cameroon 9 Myanmar 14 Chile 24 Azerbaijan 29 Oman
3 Djibouti 10 Samoa 15 Cuba 25 Georgia
4 Gabon 11 Thailand 16 Dominican Republic 26 Kyrgyzstan
5 Ghana 12 Viet Nam 17 Guyana 27 Turkmenistan
6 Mali 18 Nicaragua
7 Sao Tome and Principe 19 Peru
20 Saint Vincent and the Grenadines
21 Uruguay
22 Venezuela (Bolivarian Republic of)
Countries that maintained undernourishment below or close to 5 percent since 1990–92
1 South Africa 2 Brunei Darussalam 4 Argentina 6 Kazakhstan 7 Egypt
3 Republic of Korea 5 Barbados 8 Turkey
9 Lebanon
10 Saudi Arabia
11 Tunisia
12 United Arab Emirates
Source: FAO.
In the Central African subregion,10 the number of 1990–92, while the PoU is projected to be less than
undernourished people more than doubled between 1990–92 10 percent in 2014–16. This success has been achieved
and 2014–16, while the PoU declined by 23.4 percent. The despite a combination of limiting factors, such as rapid
divergence between the increase in absolute numbers and the population growth – Nigeria is the most populated country in
decline in the PoU is explained by the Central Africa’s rapid the region – drought in the Sahel and the high food prices
population growth. The lack of progress in absolute terms experienced in recent years.
reflects prevailing problems in the subregion, notably political A total of 18 countries in sub-Saharan Africa have achieved
instability, civil strife and outright war, as is the case in the the MDG 1c hunger target, and four more are close to
Central African Republic. reaching it (i.e. they are expected to do so before 2020 if
Eastern Africa remains the subregion with the biggest current trends persist). Of these, seven countries have also
hunger problem in absolute terms, being home to 124 million achieved the more ambitious WFS goal (Angola, Cameroon,
undernourished people. As in Central Africa, the region Djibouti, Gabon, Ghana, Mali and Sao Tome and Principe),
continues to experience rapid population growth. While the and two more (South Africa and Togo) are close to doing so.
share of undernourished has fallen by 33.2 percent, the While these are welcome developments, progress mostly
number of hungry people has risen by nearly 20 percent over started from high levels of undernourishment, and many of
the MDG monitoring period. A more favourable picture these countries are still burdened with high hunger levels. The
emerges in Southern Africa, where the PoU has fallen by more populous countries that have reached the MDG 1c
28 percent since 1990–92 and a little more than 3 million hunger target include Angola, Cameroon, Ethiopia, Ghana,
people remain undernourished. The most successful subregion Malawi, Mozambique, Nigeria and Togo. In addition, many
in reducing hunger is Western Africa, where the number of smaller countries, including Benin, the Gambia, Mauritius and
undernourished people has decreased by 24.5 percent since the Niger have reached MDG 1c. Others, including Chad,
THE STATE OF FOOD INSECURITY IN THE WORLD 2015 13Undernourishment around the world in 2015
FIGURE 4
Undernourishment trends: progress made in almost all regions, but at very different rates
Sub-Saharan Africa 33.2
23.2
Caribbean 27.0
19.8
Southern Asia 23.9
15.7
Oceania 15.7
14.2
Eastern Asia 23.2
9.6
South-Eastern Asia 30.6
9.6
Western Asia 6.4
8.4
Caucasus and Central Asia 14.1
7.0
Latin America 13.9Undernourishment around the world in 2015
food imports, and their limited resource base, coupled with the PoU dropped from 23.2 percent at the beginning of the
rapid population growth, suggests that import dependence monitoring period, to 9.6 percent in 2014–16, a reduction of
will remain a feature of the region in the future, more than 60 percent (Figure 4).
notwithstanding efforts to increase agricultural productivity. In South-Eastern Asia, the number of undernourished
people has continued its steady decline, from 137.5 million in
■■ Southern Asia: some progress, but too slow to 1990–92 to 60.5 million by 2014–16, a 56 percent reduction
meet the international hunger targets overall. The PoU has shrunk by a remarkable 68.5 percent,
falling from 30.6 percent in 1990–92 to less than 10 percent
The highest burden of hunger in absolute terms is to be found in 2014–16. Most countries in South-Eastern Asia are making
in Southern Asia. Estimates for 2014–16 suggest that about rapid progress towards international targets. Cambodia,
281 million people are undernourished in the region, marking Indonesia, the Lao People’s Democratic Republic, Malaysia,
only a slight reduction from the number in 1990–92 (Table 1, Myanmar, the Philippines, Thailand and Viet Nam all account
p. 8). But there has been noticeable progress in relative terms: for this positive performance. No country in the region shows
the PoU has declined from 23.9 percent in 1990–92 to lack of progress with respect to the international targets.
15.7 percent in 2014–16 (Figure 4). The region is on a Brunei Darussalam and Malaysia have reduced their PoU to
trajectory towards a more manageable hunger burden. Most below the 5 percent threshold, which means they are close to
importantly, progress has accelerated over the last decade, having eradicated hunger.
notwithstanding higher prices on international commodity As discussed in more detail in the section “Food security
markets. The evolution of hunger trends in India, in particular, and nutrition: the drivers of change” (pp. 26–42), much of
has a significant influence on results for the region. Higher the success of Eastern and South-Eastern Asia was possible
world food prices, observed since the late 2000s, have not due to high overall economic growth. Unlike Southern Asia,
been entirely transmitted into domestic prices, especially in these subregions experienced more inclusive growth, with
large countries such as India. In this country, the extended more of the poor and vulnerable sharing the benefits. Rapid
food distribution programme also contributed to this positive productivity growth in agriculture, since the Green Revolution,
outcome. Higher economic growth has not been fully has boosted food availability and significantly improved access
translated into higher food consumption, let alone better diets to food for the rural poor.
overall, suggesting that the poor and hungry may have failed China’s achievements in reducing hunger dominate the
to benefit much from overall growth. overall performance of Eastern Asia. The country accounts for
Most countries in Southern Asia have made progress almost two-thirds of the reduction in the number of
towards the international hunger targets, even if the pace undernourished people in the developing regions between
has been too slow for them to reach either the WFS or the 1990–92 and 2014–16. China and the Republic of Korea have
MDG targets, including, for example, Afghanistan, India, achieved both the MDG 1c hunger target and the WFS goal.
Pakistan and Sri Lanka. As these countries constitute a large Nevertheless, given the sheer size of its population, China is
share of the region’s population, they account for the low still home to an estimated 134 million people facing hunger,
overall performance – India still has the second-highest and the country with the highest number of undernourished
estimated number of undernourished people in the world. people. The prospects of continued growth, the increasing
A notable exception in terms of performance is Bangladesh, orientation of the economy towards the domestic market, the
which has made faster progress and has already reached the expansion of economic opportunities in internal areas of the
MDG 1c hunger target, thanks also to the comprehensive country and the growing ability of the poor to benefit from
National Food Policy framework adopted in the mid-2000s. these developments, have been and will continue to be key
Nepal, also, has not only reached the MDG 1c hunger target, factors in hunger reduction. Again, given its size, this also
but has almost reached the 5 percent threshold. One more holds at the regional level and has a marked influence on
country in the region, the Islamic Republic of Iran, has global results. The only major exception to overall favourable
already brought the PoU below 5 percent, and has thus progress in the region is the Democratic People’s Republic of
reached the MDG 1c target. Korea, which is burdened by continuously high levels of
undernourishment and shows little prospect of addressing its
■■ Eastern and South-Eastern Asia: rapid and problems any time soon.
generalized progress towards the international
hunger targets ■■ Caucasus and Central Asia: rapid recovery from
the transition to the market economy enabled
The most successful subregions in fighting hunger have been the international hunger targets to be met
Eastern and South-Eastern Asia. The number of
undernourished people in Eastern Asia has fallen from A combination of factors accounts for progress in the
295 million in 1990–92 to 145 million in 2014–16, a Caucasus and Central Asia, including rapid economic
50.9 percent reduction (Table 1, p. 8). Over the same period, growth, a resource-rich environment and remittances. After
THE STATE OF FOOD INSECURITY IN THE WORLD 2015 15Undernourishment around the world in 2015
a difficult transition in the early 1990s, often characterized ■■ Latin America and the Caribbean: international
by political instability and economic austerity, economic hunger targets have been met, due to rapid
conditions have improved significantly and the political progress in South America
situation has stabilized. This progress has translated into
lower hunger burdens throughout the region. Latest In Latin America, the PoU has declined from 13.9 percent in
estimates point to a steady decline in the PoU, which has 1990–92 to less than 5 percent in 2014–16 (Figure 4, p. 14).
contracted from 14.1 percent in 1990–92 to 7.0 percent In parallel, the number of undernourished people fell from
for 2014–16 (Figure 4, p. 14). The number of 58 million to fewer than 27 million (Table 1, p. 8). As in most
undernourished people is much lower than in other Asian regions, stark differences can be found across countries and
subregions – 5.8 million in 2014–16, down from 9.6 million subregions. The Central American subregion, for instance,
in 1990–92 (Table 1, p. 8). saw much less progress compared with that of South America
Progress has been sufficiently rapid to enable both the and even Latin America overall. While South America has
region as a whole and most countries to achieve the been able to bring undernourishment down by more than
MDG 1c hunger target. Indeed, most countries have 75 percent and eventually to below the 5 percent mark, the
attained PoU levels close to, or below, the 5 percent PoU for Central America has declined by only 38.2 percent
threshold. Armenia, Azerbaijan, Georgia, Kyrgyzstan and over the MDG monitoring period.
Turkmenistan have achieved the WFS goal, while Despite divergent developments within the region, Latin
Kazakhstan and Uzbekistan have achieved the MDG 1c America has achieved both the MDG 1c and WFS targets by
hunger target. The only country still lagging behind is large margins. The overall achievements are to a large extent
Tajikistan,13 which is making insufficient progress to reach also a reflection of robust progress in its most populous
the international targets, and is burdened by a relatively countries. Good overall economic performance, steady output
high PoU (33.2 percent in 2014–16). growth in agriculture and successful social protection policies
are among the main correlates of progress in the region. The
■■ Western Asia: no progress towards the combination of safety nets with special programmes for family
international hunger targets, despite low farmers and smallholders and targeted support to vulnerable
undernourishment levels in several countries groups, together with broad-based food security interventions
such as school-feeding programmes, have contributed
A less encouraging picture emerges from Western Asia, significantly to improving food security in the region. At the
where very different patterns can be observed. Some continental level, important commitments started in 2005
countries, including Iraq and Yemen, show high levels of with the Hunger-Free Latin America and the Caribbean
food insecurity and have made slow progress towards Initiative and, through various other initiatives, eventually led
improving this situation. Most other countries, on the to the Plan for Food Security, Nutrition and Hunger
contrary, have long since attained solid levels of food Eradication 2025 of the Community of Latin American and
security, after having brought undernourishment levels Caribbean States (CELAC),15 adopted by all countries of the
below 5 percent. These include politically stable, resource- region in January 2015 during its third Presidential Summit.
rich economies, such as Kuwait, Saudi Arabia and the United Hunger rates are currently below the 5 percent threshold
Arab Emirates, together with Jordan, Lebanon and Oman – in Argentina, Brazil, Chile, Costa Rica, Mexico, Uruguay and
all of which have achieved the MDG 1c hunger target; the Bolivarian Republic of Venezuela, and the WFS hunger
Kuwait and Oman have also achieved the WFS goal. The goal has been achieved in Argentina, Brazil, Chile, Guyana,
group also includes rapidly growing and politically stable Nicaragua, Peru, Uruguay and the Bolivarian Republic of
countries, such as Turkey. In Iraq and Yemen, as well as other Venezuela. In all, 13 countries in Latin America have
countries in the region for which no reliable information is achieved the MDG 1c hunger target. Beyond those listed
available, political instability, war and civil strife, as well as above, these include the Plurinational State of Bolivia,
fragile institutions, are the main factors underlying the lack Guyana, Panama, Peru and Suriname. Another four
of progress.14 countries, including Colombia, Ecuador, Honduras and
Despite a relatively low number of undernourished Paraguay, are on track to reach the MDG 1c target over the
people, Western Asia saw an increase in undernourishment next few years, if current trends persist. Even if some
throughout the monitoring period: the PoU rose by countries, such as Guatemala or El Salvador, appear to be
32.2 percent between 1990–92 and 2014–16, from 6.4 to off-track for reaching the international targets, no country in
8.4 percent (Figure 4, p. 14). In parallel, rapid population the region has a PoU higher than 20 percent.
growth has brought about a dramatic increase in the number The Caribbean as a whole, like Central America, has failed
of undernourished people, from 8 million to nearly to meet the MDG 1c target. Unlike Central America, however,
19 million. The region in its entirety, therefore, has not made the remaining hunger burden in almost all Caribbean
progress towards reaching either of the international hunger countries is lower and thus more manageable. The PoU has
targets, as a result of the polarized situation across countries. dropped from 27.0 percent in 1990–92 to 19.8 percent in
16 THE STATE OF FOOD INSECURITY IN THE WORLD 2015Undernourishment around the world in 2015
2014–16, a 26.6 percent decrease in relative terms. Many countries can be severely affected by external shocks, including
individual Caribbean countries, however, have achieved the international price volatility, adverse weather events and sudden
international targets or are at least close to reaching them. changes in the availability of a few important staples, such as
Barbados, Cuba, the Dominican Republic and Saint Vincent rice. The Pacific Islands face multiple burdens of malnutrition;
and the Grenadines have all attained the MDG 1c hunger while hunger has fallen slowly, overweight, obesity and, as a
target. The latter three have also reached the more consequence, non-communicable diseases, such as type 2
demanding WFS goal. Jamaica and Trinidad and Tobago are diabetes and coronary heart disease, are taking a growing toll
also very close to reaching the MDG 1c target. The on the region’s health and economic status.
explanation for the region as a whole lagging behind lies in Several countries in the Oceania region covered by this
the severe and still largely unabated problems experienced by report have achieved the MDG 1c hunger target, including
Haiti – a country hit by recurrent natural disasters, still facing Fiji, Kiribati, Samoa and the Solomon Islands, while Vanuatu
slow growth in food availability vis-à-vis population growth has not. Samoa has also reached the more ambitious WFS
and burdened by an increasingly degraded resource base as goal. The situation in Vanuatu has deteriorated dramatically
well as a fragile national economy.16 since Cyclone Pam hit the islands in March 2015.17 Before
this catastrophic event, the country had been showing
■■ Oceania consistent progress in reducing hunger. In the case of Papua
New Guinea, by far the most populous country in the region,
The developing countries of Oceania have experienced slow a detailed assessment has not been possible due to the lack
progress towards improved food security. The overall PoU in the of reliable background data. Overall progress
region fell by less than 10 percent between 1990–92 and notwithstanding, there is considerable uncertainty about the
2014–16. This corresponds to an increase in the number of situation in the country, where the information needed to
undernourished people of about 0.5 million, or 50 percent. reliably estimate undernourishment is largely absent.
Being largely small island developing states characterized by Anecdotal evidence indicates that the country’s food security
high dependency on food imports, food security in most situation is far from resolved.
Key findings
• Based on the latest estimates, about 795 million the essence of the MDG 1c commitment has
people remain undernourished globally, down been fulfilled, at least globally. The WFS target,
167 million over the last decade, and 216 million by contrast, has been missed by a large margin.
lower than in 1990–92. This means that just over The estimated number of undernourished
one in every nine people in the world are people is some 285 million above the envisaged
currently unable to consume enough food to target for 2015.
conduct an active and healthy life.
• Wide differences persist across regions. Some
• About 780 million people, or the vast majority of have made rapid progress in reducing hunger:
the hungry, live in the developing regions. In Latin America as well as the Eastern and
these regions, the prevalence of South-Eastern regions of Asia have all
undernourishment has dropped by 44.4 percent achieved both the MDG 1c hunger target and
since 1990–92, and the overall share now stands the more ambitious WFS goal. The MDG 1c
at 12.9 percent of the total population. target has been reached in the Caucasus and
Central Asia and in the Northern and Western
• The year 2015 marks the end of the monitoring regions of Africa. Progress has also been
period for the World Food Summit (WFS) and recorded in the Caribbean, Oceania, Southern
Millennium Development Goal (MDG) hunger Asia, and Southern and Eastern Africa, but at
targets. The latest projections suggest that, as a too slow a pace to reach the MDG 1c target.
whole, the developing regions have almost Finally, Central Africa and Western Asia are
reached the MDG 1c hunger target. From a moving away from the hunger targets, with a
statistical perspective, the target was missed by a higher proportion of undernourished in the
small margin, but from a development perspective, population now than in 1990–92.
THE STATE OF FOOD INSECURITY IN THE WORLD 2015 17Undernourishment around the world in 2015
• A total of 72 developing countries of the 129 • In several countries that have failed to reach the
monitored have reached the MDG 1c hunger international hunger targets, natural and
target. Of these, 29 countries have also human-induced disasters or political instability
achieved the more ambitious WFS goal. have generated a status of protracted crisis,
Another 12 countries, among the 72 countries which has prevented the protection of
considered to have achieved the MDG 1c target, vulnerable population groups and the
have maintained the prevalence of promotion of income opportunities for all.
undernourishment below, or very close to, In other countries, the benefits of economic
5 percent since 1990–92. growth have failed to reach the poor
population, due to lack of effective social
• Most countries that have achieved the protection and income redistribution policies.
international hunger targets enjoyed stable In the short run, the only means to address food
political conditions and economic growth, insecurity is humanitarian intervention. In the
accompanied by sound social protection policies medium and the long term, hunger eradication
targeted towards vulnerable population groups. can only be pursued if all stakeholders
In these countries, the commitment to fight food contribute to designing and enacting policies for
insecurity proved successful in spite of the improving economic opportunities, the
difficulties posed by rapid population growth, protection of vulnerable groups and disaster
volatile commodity prices, high food and energy preparedness. Action undertaken at the global
prices, rising unemployment and the economic and regional levels should take into account
recessions that occurred in the late 1990s and country specificities and exposure to natural and
again after 2008. human-induced disasters, especially those of
small island developing states.
18 THE STATE OF FOOD INSECURITY IN THE WORLD 2015Inside the hunger target:
comparing trends in undernourishment
and underweight in children
P
rogress towards the MDG “hunger target”, or MDG insights into the complexity of food security, and possibly
target 1c, which requires halving, between 1990 and lead to more targeted policy interventions. Underweight
2015, the proportion of people who suffer from can be caused by a range of different factors – not only
hunger, is measured by two different indicators: the calorie or protein deficiency, but also poor hygiene, disease
prevalence of undernourishment (PoU), monitored by FAO, or limited access to clean water. All these factors impede
and the prevalence of underweight children under five years the body’s ability to absorb nutrients from food and
of age (CU5), monitored by the United Nations Children’s eventually result in manifestations of nutrient deficits such
Fund (UNICEF) and the World Health Organization (WHO). as stunting, wasting or underweight. For this reason, the
The end of the MDG monitoring period offers a good two indicators do not always reflect the same underlying
opportunity to look back at the evolution of these indicators problem. Where lack of sufficient food is the main cause of
and to identify common trends, but also to understand the underweight, the PoU and the CU5 should move
reasons for possible deviations. synchronously. Where poor food utilization prevails instead,
Common trends should be discernible as both indicators the two indicators are likely to diverge.
were approved by the international community to measure Considering the developing regions as a whole for the
the hunger target. Deviations, however, could arise from entire MDG monitoring period, the two indicators show
the different methods used to compile them18 and the consistent trends. From 1990 to 2013, the CU5 moved
different dimensions of food insecurity that they are from 27.4 percent to 16.6 percent, a 39.3 percent
expected to capture. reduction, while the PoU declined by 44.5 percent between
Understanding the different trends of the two indicators 1990–92 and 2014–16 (Table 4, Figure 5, pp. 20–21).19 The
across regions and over time is important, as it may offer annual rate of decline is similar.
Regional patterns
The parallel progress of the two indicators for the developing ■■ Northern Africa
regions as a whole is not always evident when the analysis
focuses on individual regions. In some, the PoU and CU5 The region’s problems are well captured by MDG hunger
indicators show different rates of reduction (Table 4). Within indicators. Both the PoU and CU5 show low absolute levels
sub-Saharan Africa, for instance, the PoU and the CU5 only of food insecurity, even more so than for other developing
move together for Eastern Africa, while they diverge over regions. In particular, the CU5 declined rapidly over the
time for almost all other subregions. By contrast, trends in monitoring period, with a reduction from 9.5 to
the subregions in Asia and in Latin America and the 4.8 percent. Food utilization conditions appear favourable
Caribbean largely move in parallel. The rest of this section in the region, with more than 90 percent of the population
will analyse these divergences and similarities in trends. having access to clean water and improved sanitation
THE STATE OF FOOD INSECURITY IN THE WORLD 2015 19You can also read