Development Resources Beyond the Current Reach of the Paris Declaration - Evaluation of the Paris Declaration
←
→
Page content transcription
If your browser does not render page correctly, please read the page content below
Development Resources
Beyond the Current Reach
  of the Paris Declaration

    Evaluation of the Paris Declaration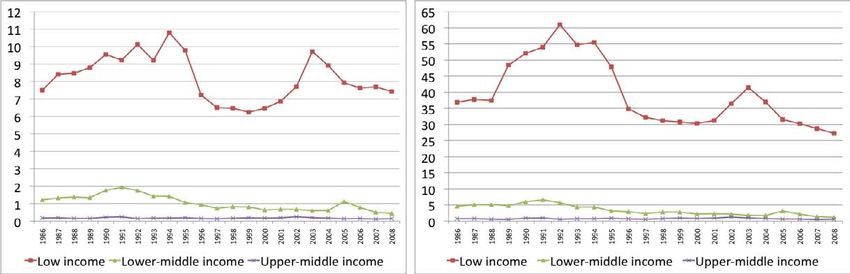
Supplementary study on

         “Development resources beyond the current reach
                   of the Paris Declaration”

                                  Submitted by:
                            FORO Nacional Internacional*

                                   September 2010

• This report has been prepared by Fernando Prada, Ursula Casabonne and Keith Bezanson,
  with the collaboration of Nestor Aquiño, Fernando Romero, Mario Bazán and Carlos
  Eduardo Aramburú. Francisco Sagasti provided general advice and suggestions.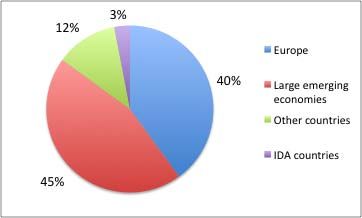
PREFACE

This independent study was commissioned by the Secretariat for the Evaluation of the Paris
Declaration as a background contribution to the work of the second phase and the Synthesis
of the Evaluation. Comments on draft versions were offered by the Evaluation Core Team
and the Secretariat, but the final contents remain the responsibility of the authors and do not
necessarily represent the views of the Secretariat, the Core Team or the Evaluation’s
sponsors. As the report shows, the subject is highly complex and often poorly documented.
Clarifications and comments are thus invited to fprada@foro-nacional-internacional.pe and to
Marika@iod.uk.com
Acronyms

AAA         Accra Agenda for Action
ADFD        Abu Dhabi Fund for Development
ARF         African Renaissance Fund
AsDB        Asian Development Bank
BCIE        Central American Bank for Economic Integration
CAF         Andean development Corporation
CGIAR       Consultative Group on International Agricultural Research
CRS         Creditor Reporting System
CSR         Corporate Social Responsibility
DAC         Development Assistance Committee
EADB        East African Development Bank
EC          European Commission
EIB         European Investment Bank
EU          European Union
FDI         Foreign Direct Investment
FLAR        Latin American Reserve Fund
FOCAC       Forum on China-Africa Cooperation
EFA - FTI   Education for All Fast Track Initiative
GAVI        Global Alliance for Vaccines and Immunization
GCF         Gross Capital Formation
GDF         Global Development Finance
GEF         Global Environment Facility
GFATM       Global Fund to Fight AIDS, Tuberculosis and Malaria
GNI         Gross National Income
HIPC        High indebted poor countries
IADB        Inter-American Development Bank
IDA         International Development Assistance
IFAD        International Fund for Agricultural Development
IFF         International Financial Facility
IMF         International Monetary Fund
IsDB        Islamic Development Bank
KFAED       Kuwait Fund for Arab Economic Development
LAC         Latin America and the Caribbean
LDC         Least Developed Countries
MDB         Multilateral Development Banks
MFIMP       Multilateral Fund for the Implementation of the Montreal Protocol
MOFCOM      Chinese Ministry of Commerce
NEPAD       New Partnership for Africa’s Development
NDBs        Non-DAC bilateral donors
NGO         Non-Government Organizations
OAS         Organization of American States
ODA         Official Development Assistance
OECD        Organization for Economic Co-operation and Development
OFID        OPEC Fund for International Development
OOF         Other official flows
OPEC        Organization of Petroleum Exporting Countries
PD          Paris Declaration
PDVSA       Petróleos de Venezuela
PPI         Private Participation in Infrastructure
PPP         Public Private Partnership
RDB         Regional Development Banks
SDR         Special Drawing Rights
SFD         Saudi Fund for Development
SRDB        Sub-regional Development Banks
SRI         Social Responsible Investment
SSC         South-South Cooperation
UAE         United Arab Emirates
US PEPFAR   U.S. President's Emergency Plan for AIDS Relief
WB          World Bank
WFP         World Food Program
TABLE OF CONTENTS


EXECUTIVE SUMMARY....................................................................................................................... 1

INTRODUCTION .................................................................................................................................. 5

I.
   SITUATING NON-PD RESOURCES IN THE CONTEXT OF THE INTERNATIONAL
DEVELOPMENT FINANCING SYSTEM................................................................................................... 7


      1.
   An institutional overview: the international developing financing system............................. 7

      2.
   Defining the scope of the study and non-PD resources ......................................................... 9

      3.
   Estimating non-PD resources from a recipient perspective ................................................ 11

II.
   CATEGORIES OF NON-PD RESOURCES: ASSESSING THEIR SCOPE, AMOUNTS AND
MODALITIES ..................................................................................................................................... 14


   1.
   Bilateral non-DAC donors................................................................................................... 14

   2.
   Multilateral assistance providers: growing complexity at the sub-regional level ............... 24

   3.
   Private sector: Diversity, innovation and growing development role ................................. 30

III.
   FINDINGS AND CONCLUSIONS .................................................................................................. 39

BIBLIOGRAPHY ................................................................................................................................ 43

ANNEX 1. COUNTRIES, TERRITORIES AND ORGANIZATIONS ADHERING TO THE PD AND
AAA PER CATEGORY AND SUBCATEGORIES .................................................................................... 52

ANNEX 2. SELECTED INDICATORS ON NON-DAC DONORS REPORTING TO THE DAC.................... 56

ANNEX 3. EXAMPLES OF TRIANGULAR COOPERATION ................................................................. 57

ANNEX 4. DESCRIPTION OF THE MAIN GLOBAL FUNDS AND MULTI-DONOR
ORGANIZATIONS .............................................................................................................................. 58


ANNEX 5. LIST OF FINANCIAL INSTRUMENTS BY FUNCTIONAL CATEGORIES AND ACTORS ........... 60

ANNEX 6. GRANT ELEMENT OF DIFFERENT INSTITUTIONS ............................................................ 63
Supplementary study on “Development resources beyond the
                  current reach of the Paris Declaration”

Executive summary

        While recent suggestions of annual international aid flows that are not classified as
Official Development Assistance (ODA) include figures as high as US$60 billion (i.e. over
50 percent of the ODA figure), few studies have examined this issue systematically. This
study is an attempt to do so, but with limitations. It is a synthesis study —a desk study—
based entirely on existing data sources. It involves no new or original research. Within those
constrains, it examines “ODA-like assistance” to developing countries from sources beyond
the current reach of the Paris Declaration (“non-PD resources”) with the aim of better
delineating sources, magnitude and implications of current and emerging trends.
        OECD/DAC defines ODA as flows of official financing administered with the
promotion of the economic development and welfare of developing countries as the main
objective, and which are concessional in character with a grant element of at least 25 percent
(using a fixed 10 percent rate of discount).For the purposes of this paper, ODA-like
assistance must meet the criteria set out in this definition.
        The methodology of the study involves first a macro analysis of all financial flows to
developing countries, in order to situate the scope of the resources covered by the PDrelative
to all development assistance andnon-aid financial flows. This is followed by a wide-ranging
examination of information from multiple sources (international data bases, national
reporting statistics, empirical literature and a wide range of reports, including press reports),
with a view to providing an assessment as detailed as possible of non-PD development
assistance flows to developing countries.
       The providers of non-PD resources fall into three categories: (i) bilateral non-DAC
donors; (ii) multilateral channels that do not adhere formally to the Paris Declaration; and
(iii) “private” development assistance providers, including foundations, corporate
foundations, hybrid actors —such as the corporate special responsibility activities of business
organizations, NGOs, advocacy and rights based organizations, networks of civil society
organizations, trade unions, faith based organizations and small community based
associations.
        Data from all available sources on the aid activities of bilateral non-DAC donorsare
rather inconsistentand incomplete. This explains the wide variations in estimates of the
magnitude of such activities. One data set puts flows from non-DAC donors that might be
considered ODA-like in the range of US$12,300-US$14,140 million for 2008. While this is
at least in the general range of US$9.5 billion and US$12.1 billion suggested in a United
Nations commissioned study in 2006, it is about 300 percent larger than the OECD estimate
of just under US$5 billion for 2005. For bilateral non-DAC donors this study shows that:
   •   Available data suffer from large gaps with regard to modalities, allocation patterns
       and use of specific instruments and conditions. There are major problems of
       transparency in reporting and shortcomings in standards and norms for classification
       purposes.

                                               1
• A substantial proportion of transfers from non-DAC donors to developing countries
would clearly not qualify as ODA-like. For example, in some cases, the concessional
level of bilateral loans is well in substantial variance with the terms specified for
ODA flows. In other cases, support consists of credit exports and insurance to
promote oil exports.
• The literature review shows serious concerns in several cases of a lack of standards in
areas such as environment and human rights.
Multilateral organizations in this study are examined under five categories: The
United Nations system; Multilateral Development Banks (MDBs) and MDB-like
organizations; regional integration and trade organizations; regional monetary organizations;
and multi-donor organizations and global funds. Only a subset of these organizations (the
MDBs, United Nations and a couple of the global funds) is currently accorded treatment
under the PD. The majority fall outside its confines. While it is clear that these organizations
are increasingly important channels for development financing from non-PD sources,
available data do not allow for a confident estimate of an aggregate amount that could be
considered ODA-like. This is the case for almost all of the regional trade and monetary
organizations and the regional monetary funds, several of which are very large as measured
in financial terms. Data for Sub-Regional Development Banks (SRDBs) are generally much
better and suggests that an important percentage of flows from them is ODA-like, but it does
not allow to provide a precise and reliable estimate. This is especially important in trying to
determine ODA-like flows in Latin America and the Caribbean where SRDBs provided an
average of US$11.8 billion during 2004-2008. Even for the United Nations system only a
partial and incomplete picture is possible. While the larger UN agencies identify
contributions by country, this is not the case for some of the agencies and for many of the
funds.
While it is not possible to determine with any degree of precision the extent to which
SRDB and MDB-like financing is similar to ODA, the literature reviewed in this study
provides evidence that these organizations are sources of development innovation,
particularly through tailoring financial products to meet their member countries’ needs. They
have allocated important resources to promote private investment and sub-regional trade,
contributed to debt relief and have expanded their financial instruments for private sector
operations and non-sovereign actors.Nevertheless, these innovations, specifically those in the
form of loans, would not be classified as ODA-like because they are not financed on
sufficiently concessional terms.
Private sectorproviders of development assistance involve a broad range of different
entities, includingfoundations, corporate giving, hybrid actors (such as the corporate social
responsibility programs of corporations), and a vast number and wide variety of NGOs. None
of these organizations hasadhered to the PD. This study undertook a separate examination of
each of these actors and found that:
• Of some 100,000 foundations worldwide, less than 1 percent has activities that focus
on developing countries. Even for U.S. foundations,which are the most active and
experienced in international development, about 70 percent of grants for international
purposes is channeled through US-based organizations. Direct flows to the poorest
countries (defined as IDA eligible only) amount to only about 3 percent of US
foundations’ financing. There is little data available on the activities and terms of the
programs of European, Asian (including Japan) and South American foundations. The
2picture that emerges from all sources, however, indicates the financing from
foundations that is ODA-like and would meet the criteria of the PD, is much smaller
than might be expected.
• While data on direct grant making to developing countries by corporate foundations
are fragmented and unreliable, it is clear that the amounts involved are quite modest,
amounting to not much more than $40 million by seven of the largest US corporate
foundations with international programs in 2008. There is virtually no systematized
data on international corporate social responsibility expenditures, although there are
some indications that it is substantial and growing. The Centre for Global Prosperity,
for example, has estimated corporate giving from the US at around US$6.5 billion,
including international CSR programs. Assuming the accuracy of this figure,
however, the data furnish no indication of the percentage going to developing
countries.
• A dramatic growth has occurred in the number, size and diversity of social venture
capital and socially responsible investment funds. Globally in 2006 these types of
funds held over US$2.3 trillion in assets US and nearly €1 trillion in Europe. While
there is no doubt that an important percentage of financing from these funds is going
to developing countries, as with other areas reviewed in this study, available data do
not permit confident estimates or even suggestions of a broad range. What is clear is
that microfinance is being accorded increasing attention by these funds and also that
much of this is ODA-like.
• Numerous studies have confirmed the growing importance of non-government
organizations (NGOs), including faith-based organizations, as providers of
development financing. One study estimated that NGOs channeled US$26.9 billion to
developing countries in 2005. Much of this, however, is provided to NGOs by DAC
donors (roughly 10 percent of ODA), which is reported as ODA and treated as such
under the PD. But there is no systematic reporting by the NGOs themselves on the
financing for development that they raise from private sources, which could be in a
range of up to 50 percent of total funding through this channel. A major percentage of
this is probably consistent with the definition of ODA (i.e. finances administered with
the promotion of the economic development and welfare of developing countries as
the main objective and concessional in character). On the other hand, an unknown but
apparently substantial percentage goes to purposes such as religious proselytism,
which would not normally be considered as ODA-like. Failure to take this into
account is common in much of the literature on the financial contribution of NGOs to
international development. Here again, therefore, there are major barriers to
determining the full extent of financing from non-PD adherents that have the qualities
of ODA. Of several thousand NGOs working in international development, only
fourteen are formal signatories to the PD and the main database on official assistance
does not include data on NGO funding.
Among the main conclusions of this study are the following:
First, exceptional caution is required with regard to any claims on the magnitude,
scope and character of financial flows to developing countries from non-PD sources.
Available data on these flows are either unavailable, or weak and unreliable.
Second, in many cases determining the degree of concessionality of financial flows is
becoming more difficult, given than non-DAC bilateral donors and SRDBs provide loans that
3vary within a wide range of grant element and high level of institutional variation in grace
periods, annual interest rate and maximum maturity.
Third, while financial flows on a bilateral basis from non-PD countries are
substantial, it is clear that a significant percentage of these do not meet Paris Declaration
criteria. The PD framework is intended as the standard for “good donorship” and “good
receivership”. Some of the practices of non-PD donors are similar or identical to the “bad
practices” of traditional donors that the PD is designed to rectify.
Fourth, whether or not they would qualify as ODA-like, non-PD financing sources are
increasing the diversity of channels and financial instruments for development.
Fifth, the growth in numbers, diversity level and patterns of financing of entities not
covered under the PD call for much more inclusive systems involving transparent
information, coordination, harmonization, governance leadership and renewed attention to
overall aid architecture.
Sixth, there is a paradoxical effect arising from the growing presence of non-PD
donors and their interactions with those adhering to the PD: while these may increase
complexity, foster fragmentation and lead to duplication,they could also be seen as advancing
the PD. In many cases, non-PD actorsare relying on channels established by traditional
donors that adhere to the PD, and this has led to what may be seen as an indirect adoption of
PD principles.
Seventh, the growing importance of non-DAC donors has led to pressures for changes
in the rules that determine what can be claimed as ODA, particularly to include different
forms of South-South Cooperation. This raises fundamental questions that require careful
study and debate. It also raises the need to explore complementaryand alternative frameworks
to accommodate development-oriented financial flows and cooperation activities that may
not easily fit conventional definitions of aid and assistance.
Finally, with regard to an estimate of non-PD resources that could be classified as
ODA-like, the findings in this study point to a far more modest figure than the US$60 billion
estimate provided by the Center for Global Prosperity. Given the weak state of available data,
all estimates should be treated skeptically, including our own reluctant conclusion of a very
rough estimate in the range of US$28-US$29.5 billion.
4Supplementary study on “Development resources beyond the
current reach of the Paris Declaration”
Introduction
The aims of the Paris Declaration (PD) of February 2005 are to bring greater
coherence into international development efforts and to increase overall aid effectiveness.
An ongoing evaluation of progress in implementing the PD1 became concerned that the scope
of the PD currently does not take into account a significant percentage of financing that
impacts directly on progress in developing countries. In order to address this and arrive at a
more realistic perspective of the true scope of the PD, therefore, the current study was
commissioned. It is to serve as a contribution to the second phase of the PD evaluation that
will undertake country evaluations and include in them an assessment of “other sources of
development finance and development cooperation partners beyond those so far endorsing
the Declaration”.2
The TORs of this study call specifically for an exploration of development assistance
resources beyond the current reach of the Paris Declaration (“non-PD resources”) with the
aim of better delineating their sources, magnitude and the implications of current and
emerging trends. There are, however, significant limitations to this study. In the first instance,
as will be clear throughout this paper, the data on development financing not accounted for in
the PD are to a significant extent weak, anecdotal or simply not available. Secondly, the
scope of the current study did not include original research to fill knowledge gaps. This is a
“meta study”, dependent on existing studies and data sets. It aims to analyze these and then
synthesize them into as comprehensive and clear a picture as possible, but it can go only as
far as existing materials permit.
Nevertheless, an extensive amount of material is available, including some empirical
studies, several data sets and, while essentially anecdotal, a broad and increasing range of
assessments by NGOs and other “on the ground” observers and an even wider range of press
reports. We have tried to draw in a balanced way from all these sources, which we have
organized into three categories of assistance flows beyond the current reach of the PD:
• Bilateral non-DAC donors and their related institutions for the delivery of
development assistance;
• Multilateral institutions at the regional and sub-regional level, as well as international
organizations operating as platforms channeling South-South and triangular
cooperation;3 and
1
See http://www.oecd.org/document/60/0,3343,en_21571361_34047972_38242748_1_1_1_1,00.html
2
As indicated in the synthesis report for the first phase of the evaluation, the context where the Paris
Declaration has been implemented is key: “one other crucial, and changing, part of the context, not yet properly
analyzed, is the effect of non-aid resource flows and growing aid flows which may remain outside the Paris
Declaration frameworks (particularly from major foundations and other private sources, non-traditional official
donors, and development NGOs.)”
3
Triangular cooperation refers to any arrangement where multilateral or bilateral donors provide funds or other
resources to developing countries in order to implement South-South cooperation projects. It also refers to the
5• Private organizations channeling resources for development purposes under
conditions comparable to Official Development Assistance (ODA), such as individual
and corporate philanthropy, foundations, socially responsible investment institutions
and international non-governmental organizations that channel resources from private
financial sources.
Looked at in aggregate terms, external aid is modest to insignificant when compared
to the resources generated internally by developing countries themselves. Indeed, the
aggregate numbers show that all externally generated financial resources, whether from
public or private sources, are dwarfed by those generated internally. This, however, is not the
case for many of the poorest developing countries.
Figure 1 shows ODA flows (which are relatively well documented) in relation to
Gross National Income (GNI) and Gross Capital Formation (GCF) for three categories of
developing countries. In 2008, ODA represented considerably less than one percent of GNI
and less than five percent of GCF for upper-middle and lower-middle income countries. In
countries such as China, Chile and Brazil it was less than two-tenths of one percent of
government expenditures. In sharp contrast, ODA comprised about 7.5 percent of GNI and
28 percent of GCF in low-income countries in 2008. Moreover, it is a very high percentage
of the national budgets of many poor countries. For example, ODA equaled almost 200
percent of Afghanistan’s government expenditures in 2008, almost 50 percent in
Mozambique and over 50 percent in the case of both Madagascar and Nepal. In the same
year, ODA accounted for fully 75 percent of all public capital investment in Madagascar. For
El Salvador and Honduras, it has recently averaged roughly 25 percent of government
expenditures.4
FIGURE 1. ODA as a percentage of gross national income (left) and gross capital
formation (right) by income level (1986 – 2008)
Source: World Development Indicators 2010
The remainder of this report is organized into three sections, as follows. The first
section describes criteria applied to determine the financial resources to be examined, taking
into account areas where the boundaries between PD and non-PD resources are blurred. The
second section describes and analyzes the amount, sources of financing, modalities and
instruments, motivations and future prospects of non-PD resources and their interactions with
case where these funds are managed by international organizations (platforms for South-South cooperation
activities).
4
Information obtained from the World Development Indicators database compiled by the World Bank.
6those resources and financial sources under the scope of the Paris Declaration (PD) and the
Accra Agenda for Action (AAA). The last section summarizes the main findings and
identifies major gaps for future research, and provides general recommendations for country
evaluation teams on collecting and systematizing non-PD resources.
I. Situating non-PD resources in the context of the international development
financing system
1. An institutional overview: the international developing financing system
The international development financing system is defined as the set of institutions
that provide external financing and technical assistance to developing countries, and global
and regional public goods to the international community (Sagasti, Bezanson and Prada
2005). These institutions are located at the intersection of the international financial system
and national and the international development systems and comprise three different
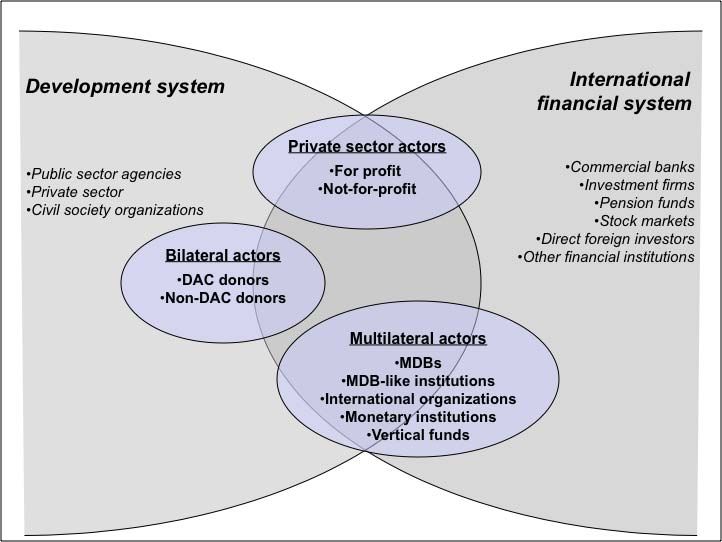
categories of actors, bilateral, multilateral and private (Figure 2):
FIGURE 2. The international developing financing system
a. Bilateral actors, which include the traditional DAC donors and a diverse group of
non-DAC donors (Kragelund 2008). The DAC describes itself as being the "venue
and voice" of the world's major donor countries. With the exception of South Korea,
whose membership was approved in 2009, all others have been aid donors for many
decades. Among the most important non-DAC donor countries would be China, India,
Saudi Arabia, Venezuela, Brazil, Thailand and Turkey. There are others (see Annex
1), including members of the European Union (e.g. Poland and the Czech Republic),
7countries currently negotiating OECD membership (e.g. Estonia and Turkey) and
members of the Organization of Petroleum Exporting Countries (OPEC) (e.g. Kuwait
and UAE), and a group of “non-traditional” or “emerging” donors from developing
countries.5
b. Multilateral actors, which may be said to be populated by four distinct groupings:
• Multilateral Development Banks (MDBs) composed of the World Bank Group,
regional and sub-regional development banks (RDBs and SRDBs respectively);
and MDB-like organizations such as the International Fund for Agricultural
Development (IFAD), the OPEC Fund for International Development, the
European Investment Bank (EIB) and the European Commission (EC).
• International organizations at the global and regional level, such as the United
Nations and its related organizations and trust funds. In addition, there is a diverse
group of international cooperation and regional integration organizations such as
the Organization of American States and the New Partnership for Africa’s
Development (NEPAD) that operate as platforms for South-South cooperation
(SSC).
• Monetary institutions such as the International Monetary Fund (IMF) and regional
organizations providing short-term financing to cope with balance of payments
imbalances, such as the Asian Monetary Fund and the Latin America Reserve
Fund.6
• Multi-donor organizations such as specific purpose or “vertical” funds and a
greater variety of public-private partnerships for development financing constitute
a fourth group within this category.
c. Private sector actors, which includes two groups. First, the for-profit private sector,
including investors providing direct foreign investment in developing countries, and
other institutions that channel private financing to developing countries such as
commercial banks, pension funds, stock markets, equity investment firms and
investment funds. Second, the not-for-profit private sector, including corporate social
responsibility programs, private foundations, international non-governmental
institutions,individual philanthropy and organizationsthat channel individual’s
donations and remittances.
There is no accepted inventory of the institutions and actors that populate these three
categories. A recent World Bank review included 236 organizations in its “List of Main
Development Organizations” (World Bank, 2008, Annex 3). The internet-based not-for-profit
“Directory of Development Organizations” lists 65,000 organizations from civil society,
academic and research institutions, governments and the private sector as international
development organizations.7
5
Apart from “non-DAC,” it is difficult to find a single term that describes these actors. They are not all “new”
and some do not like to be labeled “donors”. The study will cover this by referring to them specifically and
ascertaining later whether there are appropriate categories to classify them.
6
FLAR in Spanish.
7
See http://www.devdir.org/
82. Defining the scope of the study and non-PD resources
Each of the three categories described above includes formal adherents to the PD,8 but
also a large number of non-adherents, especially in the second and third categories. In the
case of bilateral donors, all DAC members are adherents to the PD, as are a majority of non-
DAC donors. A handful of non-DAC countries, however, have not yet taken this
step.9Regarding multilateral institutions, some multilateral development banks, such as the
World Bank and regional development banks, and several international organizations (e.g.
the UN Development Group and the main vertical funds) are adherents, but this is not the
case for the diverse network of institutions operating at the sub-regional level such as sub-
regional development banks and regional integration schemes that operate as platforms for
SSC activities (Sagasti and Prada 2006). In the case of the private sector, there are few
adherents to the Paris Declaration. The exceptions are a small group of civil society
organizations and a few private or quasi-private special initiatives such as the Millennium
Campaign, the Global Alliance for Vaccines and Immunization (GAVI), the Global Fund to
Fight AIDS, Tuberculosis and Malaria (GFATM), and the Education for All Fast Track
Initiative (FTI).
Turning to the developing countries themselves, most (110 in total)10 have taken the
steps required to become formal adherents to the PD principles (Annex 1). Most have done so
as aid recipients, but a growing number are now simultaneously aid recipients and donors.
Some of these have endorsed the PD principles only as recipients but not as donors. In
several cases, this is because they wish first to see changes to some of the PD principles that
affect their status as donors.11 Specifically, certain specific aspects of current PD criteria
would not recognize some of their South-South Cooperation (SSC) efforts as official
development assistance.12 The question for this study is what proportion of current SSC
would be considered as “aid” under existing PD criteria. These criteria derive from the
OECD definition which refer to “flows of official financing administered with the promotion
of the economic development and welfare of developing countries as the main objective, and
which are concessional in character with a grant element of at least 25 percent (using a fixed
8
The complete list of countries and organizations adhering to the PD and the AAA is found in the following
link http://www.oecd.org/document/22/0,3343,en_2649_3236398_36074966_1_1_1_1,00.html It is important to
note that the Paris Declaration and AAA do not have the same status as formal international agreements or
treaties. Adherence implies a willingness to voluntary implement its provisions, but that there are even some
questions about whether certain countries have endorsed these instruments selectively (e.g. only as recipients of
aid but not as “donors.”)
9
Non-DAC donors that have not adhered to the PD include: Bulgaria, Cuba, Chile, Costa Rica, Iran, Latvia,
Lithuania, UAE and Venezuela, as well as a group of middle-income countries with small technical cooperation
programs.
10
The status of Brazil has not yet been confirmed. If it is an adherent, the total would be 111.
11
Modifying some DAC criteria in order to recognize as ODA certain aspects of South-south cooperation was
raised as an issue at the high level meeting in Accra that produced the Accra Agenda for Action. This led in turn
to the “High Level Event on South-South Cooperation and Capacity Development” (Bogota, Colombia, March
24-26, 2010). The Bogota Statement recognizes the complementarities with “North-South” development
cooperation while emphasizing the singularities of the initiatives of developing countries as donors. See
http://www.impactalliance.org/ev_en.php?ID=48980_201&ID2=DO_COMMUNITY
12
This is an important debate that is discussed in the third section. For example China is progressively
becoming a major provider of SSC. In this regard, Davies (2007) indicates that, “(…) according to donors to
China, China probably signed up in its capacity as a recipient rather than as a donor country” (pp. 65).
910 percent rate of discount)” (OECD Glossary).13
Thus, the application of two criteria is required to determine the scope of this study:
(1) whether development assistance providers have endorsed the Paris Declarationor not; and
(2) whether the assistance they provide can be considered as ODA, ODA-like or not. Table 1
summarizes the configurations that emerge from the combination of both criteria. Even with
this, however, it should be noted that there could be permeability between at least some of the
categories. For example, regarding categories 3 and 4, military and security assistance
(beyond some strictly limited purposes specifically defined by the DAC)clearly falls outside
the boundaries of ODA, but it can include development resources in the form of grants and
technical cooperation, mainly for post-conflict reconstruction purposes or for alternative
development of anti-narcotic programs.
Similar problems of classification can arise for category 5. Some private sector
contributionsentail resources and financial instruments for development purposes and could
be considered as ODA-like. For example, “socially responsible” investment (SRI), corporate
social responsibility (CSR) and blended value instruments from private investors
(Girishankar 2009) entail resources for development purposes with characteristics
comparable to ODA in certain key respects. Also, resources obtained from international
capital markets and intermediated by financial institutions in the form oflower-than-market
interest rate loans, which are often used to strengthen domestic capital markets and underpin
microfinance operations,also contain an implicit grant element and could be viewed as ODA-
like resources.
The primary focus of this study is, therefore, on “ODA-like assistance” from
assistance providers that have not yet adhered to the Paris Declaration.It addresses this
through two approaches. First, a macro analysis has been undertaken of all financial flows to
developing countries based on the Global Development Finance (GDF) database of the
World Bank and the Creditor Reporting System of the DAC. This is aimed at gaining a broad
view of the scope of the resources covered by the PDrelative to all development assistance
andnon-aid financial flows. This may be termed an aggregate picture from a recipient point of
view.Second, using the three categories defined above (i.e. bilateral, multilateral and private)
we have drawn from multiple sources of information (international data bases, national
reporting statistics, empirical literature and a wide range of reports, including press reports),
with a view to providing a much more granular assessment of non-PD development
assistance flows to developing countries.
TABLE 1. Scope of development resources and the current reach of the PD
Source of development Type or category of development resources
resources
1. Assistance providers ODA through bilateral, multilateral and other channels; and ODA-
endorsing the PD like assistance (i.e. with development purpose, meeting the grant
element threshold)
2. Assistance providers not yet ODA-like assistance (i.e. with development purpose, meeting a
endorsing the PD grant element threshold) e.g. private and non-official grantors,
non-DAC official providers of development assistance–including
South-South and “triangular” cooperation
13
In the case of commercial credit loans, the DAC considers that loans with a grant element above 35 percent
are considered concessional loans, and therefore are part of ODA flows.
103. Assistance providers Assistance falling outside the boundaries of ODA (e.g. military,
endorsing the PD commercial, non-concessional loans, etc.)
4. Assistance providers not yet Assistance that is not ODA-like (e.g. military, commercial, non-
endorsing the PD concessional loans, etc.)
5. “Non-aid” development Private flows at market terms (investment, export credits, etc.) and
resources domestic development resources
Source: Adapted from Terms of Reference for this study
3. Estimating non-PD resources from a recipient perspective
Table 2 comprises the aggregated data from the GDF database, which provides a
broad picture of development resources flowing to developing countries. The figures of net
official flows include ODA and ODA-like resources but they also include non-concessional
loans from bilateral and multilateral lenders. It is immediately apparent that net official flows
provide only a small portion of total financial flows to developing countries as a whole. This,
of course, is not the situation for all developing countries. As noted earlier in this paper, the
proportion of ODA to GNI and to gross capital formation is miniscule in middle-income
countries, in contrast with the situation of low-income countries. Net official flows to middle-
income countries were in fact negative for most of the previous decade (2003 to 2009),
although they were slightly positive in 2008 because of a combination of public efforts to
mitigate the financial crisis and a reduction of private flows. While net official flows to low-
income counties remained positive over the same period, they amounted to only US$5.1
billion in 2008—a relatively small figure compared to net private flows (US$29.2 billion).
TABLE 2. Net capital flows to developing countries
(Annual average, US$ billion)
1970-1979 1980-1989 1990-1999 2000-2008
1. Net private flowsa 27.50 40.92 175.01 496.39
2. Net official flowsb 13.26 34.74 50.49 42.48
3. Net equity flows 5.13 13.45 113.61 328.62
3.1. Foreign direct investmentc 5.12 13.17 97.18 290.13
3.2. Portfolio equity flows 0.02 0.28 16.43 38.49
4. Net flows on debt 30.79 48.97 83.07 152.85
4.1. Official creditors 8.43 21.49 21.67 -14.92
4.2. Private creditors 22.37 27.48 61.40 167.77
Memo
5. Changes in reserves n.a. -0.97 48.72 367.12
6. Grantsd 4.83 13.25 28.82 57.41
7. Worker's remittances 4.32 20.77 53.56 183.99
Source: Global Development Finance 2009
a
Net debt flows from private creditors + net equity flows; bGrants + net debt flows from official creditors; cNet flows;
d
Technical cooperation grants not included
A somewhat similar differentiation applies with regard to net private flows. Private
flows (including FDI, commercial bank lending and capital market financing) are
concentrated in middle-income countries and even more in a small group of emerging
economies. FDI, the greater component of private flows, amounted to US$588 billion in
2008, of which 55 percent went to upper middle income countries, 40 percent to lower
middle income countries and the remaining 5 percent to low income countries (GDF
11database).
At the aggregate level, three main trends emerge when comparing these broad
categories of financial flows from the 1970s to the present:
First, globally official flows have declined dramatically in comparison with private
flows. During the 1970s, net official flows were almost one third of net financial flows (and
half of net private flows); while during the present decade they amount to less than eight
percent of the total.14
Second, private capital flows have been the main source of international development
financing and their dominance has increased steadily over the past two decades. Foreign
direct investment (FDI) has increased at the fastest rate and now accounts for roughly 60
percent of all net private flows, reaching an average of US$290 billion during 2000-2008.
Third, increased private flows are still overwhelmingly concentrated in middle-
income and a few low-income developing countries. An average of 70 percent of global FDI
to developing countries was concentrated in 10 middle-income countries.15 Over the same
period, low-income countries received at average of only 4.2 percent of FDI net inflows.
This, too, was highly concentrated, with 70 percent going to only 10 countries.
Portfolio equity has also grown substantially and now amounts to US$38 billion per
year. In the case of debt flows, which averaged US168 billion annually during 2000-2008,
private creditors have also surpassed official creditors. In addition, as the above table shows
individual (mainly workers’) remittances increased to an annual average of US$184 billion
from US$21 billion two decades earlier.16 Finally, the strengthening of international and
domestic capital markets has contributed to leveraging additional resources from external and
domestic savings to development financing, at least in emerging economies. For example, the
value of outstanding local-currency bond markets in 20 emerging economies have jumped
from US$2.9 trillion in 2005 to US$5.5 trillion in 2008, to represent nine percent of global
bond issuance (IIF 2009).17
The two decades long global dominance of private flows as a percentage of all
financial flows to developing countries may, however, be shifting somewhat as a
consequence of the recent financial crisis. Some slowing of aggregate private flows has
occurred, although FDI and remittances have been resilient and may recover to their pre-
crisis levels in 2010 (World Bank 2010). As overall private flows have slowed, there have
been major increases in transfers from multilateral institutions and also large increases in
their capital bases, which indicate that this trend is likely to continue for some time. The IMF
recently increased its capital availability by more that US$$250 billion. The capital of the
Inter-American Development Bank was increased this year by 70 percent (to US$170
billion), which will allow it to increase its average annual credit to the Latin American region
to US$12-15 billion from US$7-9 billion. The IDA-16 replenishment process is expected to
14
Considering financial flows in net terms allows comparability between different sources of financing,
especially when private sources are included. In terms of aid and financing from official sources, presenting
information about net flows allows a better appreciation of the specific contribution of loans and grants in
development financing.
15
China, Russia, Brazil, India, Mexico, Turkey, Chile, Poland, Kazakhstan, Romania.
16
There is growing evidence that remittances partially contribute to fund education, nutrition and health of
families in developing countries (Katseli et al. 2006; Cox and Ureta 2003).
17
However, just eight countries—Brazil, China, India, Malaysia, Mexico, South Africa, Thailand, and Turkey—
accounted for almost 90 percent of local-currency bonds out- standing in June 2008.
12increase available resources by no less than 30 percent. Discussions are underway to increase
the capital of the World Bank, the Asian Development Bank and the African Development
Bank. At the sub-regional level, the Andean Development Corporation (CAF) increased its
capital by US$2.5 billion in 2009. Finally, negotiations concluded in March 2010 to establish
a regional fund in Asia to operate in a similar way as the IMF with US$120 billion. Although
these changes are very significant and should affect the balance between public and private
flows, official resources do not have the potential to replace private investment as the main
source of development finance in developing countries overall.
Table 2 shows clearly that, over four decades, the current reach of the PD would
account for only a very small percentage of net capital flows to developing countries as a
bloc. It also shows that the trend has accelerated dramatically over the past twenty years. This
situates the PD in the large picture of total flows to developing countries, but it does not shed
light on the proportion of either total resources or net official resources not currently covered
by the PD that would meet the twin criteria of being principally aimed at the promotion of the
economic development and welfare of developing countries and with a grant element of at
least 25 percent.
An initial attempt was made to address this by looking only at net official flows and
by separating data in the GDF database into flows by PD-adherents and non-PD-adherents.
The result (Table 3) shows that non-adherent countries18account for less than one percent of
total net financial flows and six percent of ODA flows. This, however, is a very crude and
problematic measure for several reasons. First, net official flows are not comparable to ODA
flows or to resources covered by the reach of the PD. This is because ODA reporting
classifies multilateral disbursements as “other official flows” to avoid double counting and
the resulting difference can be significant. Secondly,the GDF does not include data from the
sub-regional development banks. Thirdly, although GDF distinguishes between grants in
general and technical assistance grants, it does not separate these by type of donor.
TABLE 3. Net official flows to developing countries
(Annual average, US$ billion)
Adherents Non – adherents Percentage non-
2000-2008 2000-2008 adherents d
(A) (B) (A)/(B)
1. Net official flows a 42.48 0.34 0.8%
2. Debt from official creditors -14.92 -2.97 19.9%
a. Multilateral creditors 2.44 -0.90 36.9%
- World Bank 3.10 -0.27 8.7%
IBRD -2.05 -0.50 24.4%
IDA 5.15 0.22 4.3%
- IMF -5.59 -0.54 9.7%
Non-concessional -5.77 -0.49 8.5%
Concessional 0.18 -0.05 27.8%
18
Developing countries that are recipients but non-adherents to the PD or AAA are: Algeria, American Samoa,
Angola, Azerbaijan, Belize, Bhutan, Bulgaria, Chile, Costa Rica, Cote d'Ivoire, Cuba, Dominica, Eritrea,
Georgia, Grenada, Guinea-Bissau, Iran, Kazakhstan, Kiribati, Korea Dem. Rep., Kosovo, Latvia, Lebanon,
Liberia, Libya, Lithuania, Macedonia, Maldives, Marshall Islands, Mauritius, Mayotte, Micronesia, Myanmar,
Palau, Seychelles, Somalia, St. Kitts and Nevis, St. Lucia, St. Vincent and the Grenadines, Suriname,
Turkmenistan, Uruguay, Uzbekistan, Venezuela, West Bank and Gaza and Zimbabwe.
13- Major RDBs 3.11 -0.14 4.5%
Non-concessional 1.41 -0.16 11.3%
Concessional 1.70 0.02 1.2%
- Other b 1.82 0.06 3.3%
b. Bilateral creditors -17.36 -2.07 11.9%
- Non-concessional -14.99 -2.06 13.7%
- Concessional -2.37 -0.01 0.4%
3. Grants c 57.41 3.30 5.7%
Memo
4. Technical cooperation grants 18.29 1.38 7.5%
5. ODAe 82.17 4.93 6.0%
Source: Global Development Finance 2009
a
Net debt flows from private creditors + net equity flows; bOther financial flows from a selected group of multilateral
institutions, mainly sub-regional and vertical funds; cTechnical cooperation grants not included; dIn absolute terms;
e
Correspond to the sum of net official flows + technical cooperation grants – non-concessional debt from bilateral and
bilateral creditors + donor administrative costs. However, this formula is not accurate since it assumes that “grants”
correspond only to grants from official sources and donor administrative costs are negligible.
The other major database, the Creditor Reporting System (CRS) fails to compensate
for these problems. The CRS is compiled by the DAC and includes ODA figures reported by:
DAC donors and data provided by non-DAC donors. While it contains detailed project
information, much of its data is of uneven quality and there are also significant gaps for the
purposes of this study. For example, its non-DAC cooperation information is provided
infrequently on a voluntarily basis and is less complete than the rigorous reporting required
of DAC members. In addition, it includes some but not all international organizations of the
UN system.
Thus, while available databases on capital and aid (concessional) flows show that the
PD deals with a relatively modest percentage of overall capital flows, they are of little value
in trying to assess the magnitude of ODA-like flows to developing countries from non-DAC
sources (i.e. the development flows currently beyond the scope of the PD). The following
section, therefore, reports on additional efforts to address this issue by drawing from multiple
sources of information and distilling from these as accurate a picture as possible.
II. Categories of non-PD resources: Assessing their scope, amounts and modalities
This section attempts to arrive at a more informed appreciation of the extent of ODA-
like development flows that fall outside the current scope of the PD (i.e. non-PD resources)
by drawing from and synthesizing materials from multiple sources that include financial
statements, annual reports, academic studies,NGO assessments, newspapers and other
publications. It is necessarily exploratory in nature and dependent on qualitative judgments as
well as quantitative analysis to the extent possible. For each category of donor (bilateral,
multilateral and private sector), main actors providing non-PD resources are identified and
data presented on the amount of financial resources provided and the instruments and
modalities used to allocate resources to developing countries. On each of these, it tries to
summarize the main issues and debates about their relative contribution.
1. Bilateral non-DAC donors
The category “Non-DAC donors” comprisesthe countries with international
cooperation programs which are not members of DAC and which do not mandatorily report
14to it. Non-DAC donors include (at least) two subgroups (Annex 1). A first subgroup is made
up of countries that are OECD or European Union (EU) members, but not yet DAC members.
The majority in this subgroup apply DAC standards when implementing their cooperation
programs, report to DAC on a voluntary basis19and are formal adherents to the PD. There are,
however, exceptions (Bulgaria, Latvia, Lithuania and Chile are members of OECD but do not
yet adhere to the PD) but the cooperation programs of these countries are miniscule,
amounting to a small fraction of one percent of ODA. Accordingly, the countries in this
grouping are excluded from the scope of this study.
The second subgroup of non-DAC countries is very mixed. It includes OPEC
members (Kuwait, Saudi Arabia, Venezuela and the United Arab Emirates), middle income,
emerging donor countries (Brazil, China, India, South Africa, Thailand, Turkey and the
Russian Federation) and a fewcountries whose donor role is difficult to classify (Cuba, Iran,
Israel and Taiwan).
The developing countries in the second subgroup engage in what is commonly
categorized as bilateral South-South Cooperation (SSC). The sequel to the PD is the Accra
Agenda for Action (AAA) which was negotiated and agreed in September, 2008. At the AAA
meeting, many of the countries in the second subgroup sought inclusion of their SSC
activities in the AAA framework. As a result, the “special status of SSC”was recognized in
the Accra declaration (paragraph 19 of the AAA) and three areas of work were established:
(1) adaptation of the principles of effectiveness of aid to SSC; (2) enrichment of the debate
on effectiveness with a systematization of the experiences; and (3) identification of areas
where SSC complements North-South cooperation.20 At the “High-Level Meeting for South-
South Cooperation and Capacity Development” (Bogota, 24-25 March 2010), the main SSC
donor countries indicated the importance of systematizing SSC experiences, but were also
critical of applying only DAC criteria to identify what constitutes official aid in the context of
SSC. Some of these donors also suggested a parallel “DAC for SSC”.
This is raising fundamental issues in current debates on SSC. As we have seen, DAC
criteria specify that aid must have as its main objective the promotion of the economic
development and welfare of developing countries and the financing must be concessional
(defines as having a grant element of at least 25 percent, using a fixed 10 percent rate of
discount). In addition to this, the Accra Declaration commits donors to support the purchase
of goods and services through the national procurement agencies of aid recipient countries.
To the extent that SSC practices do not meet these criteria, they could be considered as
official aid only if a dual standard were to be applied, one for “North-South cooperation” and
a second for SSC.
To examine this issue, we collected information from four sources: (1) voluntary
reports to DAC that appear in its CRS database; (2) reports, case studies and publications
about specific donors; (3) general databases about SSC activities (TT-SSC 2010; SEGIB
19
For example, South Korea became a DAC member on November 25th, 2009 but it has been reporting its
cooperation program since the late 1990s. Its cooperation program amounted to US$803 in 2008—one of the
smallest cooperation programs, comparable to that of Finland, Greece, Portugal, Luxembourg and New Zealand
that were below US$1.0 billion in 2008. Moreover, South Korea will host the next High Level Meeting on
Development Effectiveness, aimed at taking stock of the progress on the PD and the AAA.
20
The Task Team on SSC (TT-SSC), a southern-led platform hosted by the Working Party on Aid Effectiveness
(WP-EFF) at the OECD/DAC and co-chaired by Colombia and Egypt, has the mandate of organizing debates
and discussions to implement the three areas of work established in the AAA regarding SSC.
152008);21 and (4) the database – still in its test stage -- of “AidData”, an independent initiative
“dedicated to collecting project-level data from all multilateral donors and non-DAC bilateral
donors (NDBs) to provide a more complete picture of development finance flows and
activities.”22 The CRS database clearly separates ODA and non-ODA projects and activities,
but this is not the case for the other sources.
Tables 4 and 5 provide an initial summary of the data obtained from these sources,
Table 4 is from the AidData database. Table 5 represents an attempted amalgam of data from
the other sources for 2008, presented by country and showing the amount and percentage of
GDP of ODA-like flows and some main characteristics.
Juxtaposing the two tables reveals immediately the sheer size of the divergences of
SSC reporting that are found in different data sets. In the case of Brazil, for example,
AidData indicates a 2008 figure of only US$15.2 million, whereas The Reality of Aid, 2010
puts the figure almost 23 times higher at US$340 million. Also for 2008, Kuwait is shown in
one database at US$283 million and 54 percent higher in another at US$435 million. Chile in
one is listed at US$1.5 million and in a second over double that amount at US$3.3 million.
The large divergences also reflect the scanty nature of much of the information
provided on SSC. In many cases, the information provided is insufficient to distinguish
between the ODA-like and non-ODA development flows from non-DAC countries. Based on
cross-referencing from the multiple information sources mentioned above, we assembled
Table 5 which suggests that the flows that might be considered as ODA-like under DAC and
PD criteria could be in a range of US$12,300-US$14,140 million for 2008. This is
considerably more than some other estimates. For example, it is almost 300 percent larger
than the OECD estimate of just under US$5 billion for 2005 (OECD 2007).The estimate,
however, is very close to one provided in a United Nations commissioned study in 2006,
which suggested that SSC amounted to between $9.5 billion and $12.1 billion, representing
between 7.8 percent and 9.8 percent of total aid flows (ECOSOC 2008).
TABLE 4. ODA from selected non-DAC bilateral donors (2000-2008)
(US$ million)
2000 2001 2002 2003 2004 2005 2006 2007 2008 Total
Saudi Arabia - - 339.0 2,391.0 1,734.0 1,005.0 2,095.0 2,079.0 5,564.0 15,207.0
Kuwait 648.4 514.7 417.5 379.6 677.4 690.4 494.6 667.3 283.0 4,772.9
Taiwan - - - - 421.0 483.0 513.0 514.0 435.0 2,366.0
UAE 124.0 256.0 494.7 127.0 50.0 219.0 429.0 88.0 108.3 1,895.9
India - - - - - - - - 724.1 724.1
South Africa - - - - - 9.5 58.5 53.8 - 121.8
Brazil - 0.1 - - 2.2 2.8 2.8 6.5 15.2 29.5
Thailand - - - - - - - 16.1 - 16.1
Chile - - 0.1 0.0 0.1 0.1 1.8 0.8 1.5 4.5
Colombia - - - - - - 0.0 0.3 0.3 0.6
Total 772.4 770.8 1,251.2 2,897.6 2,884.7 2,409.8 3,594.7 3,425.8 7,131.3 25,138.3
Source: www.aiddata.org data.
21
See http://www.southsouth.info
22
See http://www.aiddata.org/about/index.
16You can also read