IV Singapore: Consultation-Press Staff Report; the Executive Singapore
←
→
Page content transcription
If your browser does not render page correctly, please read the page content below
IMF Country Reports         21/156

Singapore: 2021 Article IV
Consultation-Press Release;
Staff Report; and Statement by
the Executive Director for
Singapore

      INTERNATIONAL MONETARY FUND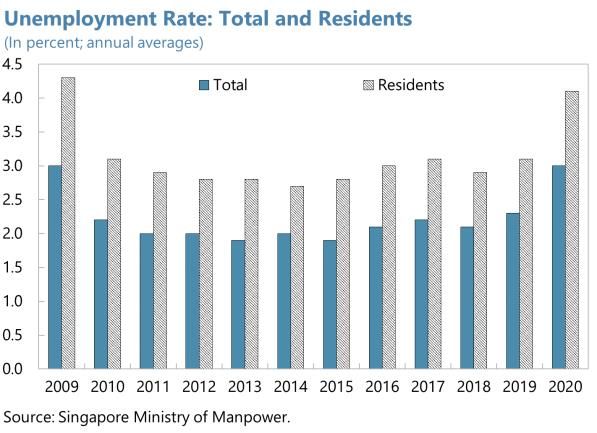
IMF Country Report No. 21/156

            SINGAPORE
            2021 ARTICLE IV CONSULTATION—PRESS RELEASE;
July 2021   STAFF REPORT; AND STATEMENT BY THE EXECUTIVE
            DIRECTOR FOR SINGAPORE
            Under Article IV of the IMF’s Articles of Agreement, the IMF holds bilateral discussions
            with members, usually every year. In the context of the 2021 Article IV consultation with
            Singapore, the following documents have been released and are included in this package:

            •    A Press Release summarizing the views of the Executive Board as expressed during its
                 July 9, 2021 consideration of the staff report that concluded the Article IV consultation
                 with Singapore.

            •    The Staff Report prepared by a staff team of the IMF for the Executive Board’s
                 consideration on July 9, 2021, following discussions that ended on May 11, 2021, with
                 the officials of Singapore on economic developments and policies. Based on
                 information available at the time of these discussions, the staff report was completed
                 on June 22, 2021.

            •    An Informational Annex prepared by the IMF staff.

            •    A Statement by the Executive Director for Singapore.

            The documents listed below have been or will be separately released.

                Selected Issues

            The IMF’s transparency policy allows for the deletion of market-sensitive information and
            premature disclosure of the authorities’ policy intentions in published staff reports and
            other documents.

                                   Copies of this report are available to the public from

                                    International Monetary Fund • Publication Services
                                          PO Box 92780 • Washington, D.C. 20090
                                     Telephone: (202) 623-7430 • Fax: (202) 623-7201
                                  E-mail: publications@imf.org Web: http://www.imf.org
                                               Price: $18.00 per printed copy

                                          International Monetary Fund
                                                Washington, D.C.

            © 2021 International Monetary Fund

                     ©International Monetary Fund. Not for Redistribution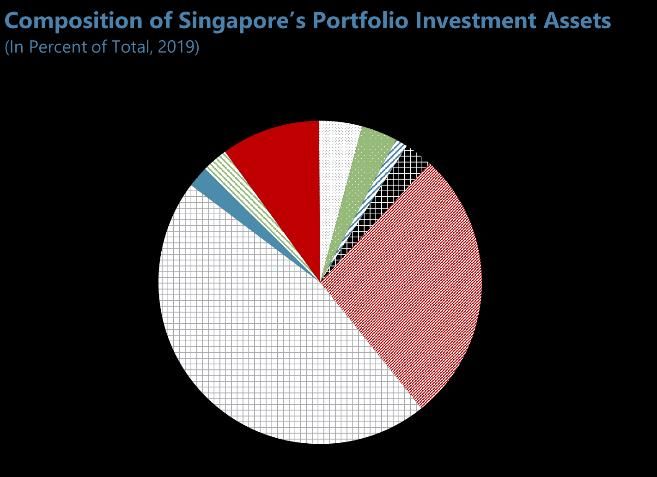
PR21/219

    IMF Executive Board Concludes 2021 Article IV Consultation
                         with Singapore
                                             FOR IMMEDIATE RELEASE

Washington, DC – July 16, 2021: The Executive Board of the International Monetary Fund
(IMF) concluded the Article IV consultation1 with Singapore.

Singapore entered the COVID-19 pandemic with sizable policy space and robust economic
policy frameworks. These have enabled the authorities to mount a coordinated,
comprehensive, and sizable policy response, with fiscal policy acting as a f irst line of defense.
As a result, worse outcomes were prevented and real GDP, which contracted by 5.4 percent
in 2020, registered 1.3 percent year-on-year growth in 2021Q1, led by a strong manufacturing
sector performance. Labor market conditions were supported by the wide-ranging policy
initiatives, and unemployment declined to 2.9 percent in April 2021 f rom its peak of 3.5
percent in September 2020. Inf lation, which had turned negative in 2020, registered 2.1
percent year-on-year in April. Policy support helped banks maintain strong liquidity and capital
buf fers. The current account surplus was resilient through the crisis and registered 17. 6
percent of GDP in 2020.

Singapore’s economic recovery is expected to remain on track in 2021. Activity is expected to
accelerate in 2021H2 as vaccines become more widely available, bringing annual growth to 6
percent in 2021. The recovery is expected to be led by manufacturing and modern services,
as hard-hit sectors such as aviation and tourism related industries improve more gradually.
Inf lation is expected to be contained given remaining slack in the labor market. With the
recovery in domestic demand, the current account surplus is expected to decline to 15.5
percent of GDP in 2021. Over the medium term, growth should converge to 2.5 percent with
the current account surplus declining and MAS core inflation stabilizing at 2 percent. The
outlook is subject to unusually high uncertainty, with balanced risks stemming mostly in the
near term f rom the unknown trajectory of the pandemic globally and locally, as well as the
path f or vaccines. Additional risks include volatile global financial conditions, threats to
globalization and trade, and the uncertain impact of the pandemic on the corporate sector.

Executive Board Assessment2

Executive Directors welcomed the large and comprehensive policy response to the pandemic
and ensuing economic crisis. Following a record contraction in 2020, the Singaporean
economy is expected to recover this year. Nevertheless, significant uncertainty continues to
cloud the outlook. Directors agreed that macroeconomic policies should remain supportive in

1
  Under Article IV of the IMF's Articles of Agreement, the IMF holds bilateral discussions with members, usually every year. A staff
team visits the country, collects economic and financial information, and discusses with officials the country's economic developments
and policies. On return to headquarters, the staff prepares a report, which forms the basis for discussion by the Executive Board.
2
 At the conclusion of the discussion, the Managing Director, as Chairman of the Board, summarizes the views of Executive Directors,
and this summary is transmitted to the country's authorities. An explanation of any qualifiers used in summings up can be found here:
http://www.IMF.org/external/np/sec/misc/qualifiers.htm.

                   ©International Monetary Fund. Not for Redistribution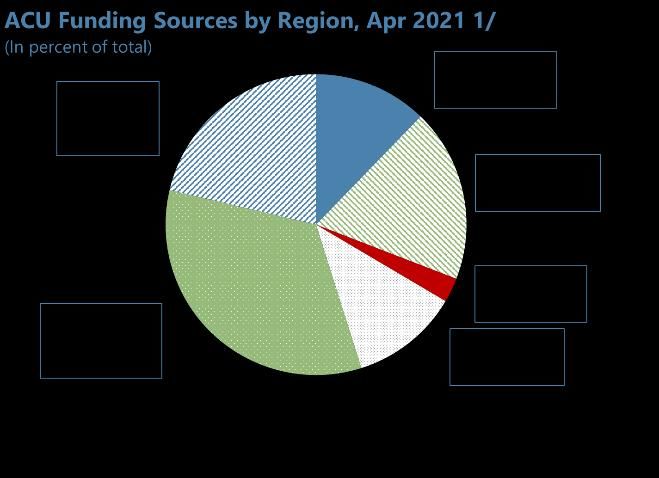
the near term while ef f orts should continue to facilitate a transition toward a greener, smarter,
and more inclusive economy over time.

Directors generally agreed that the fiscal response in 2021, with more targeted support, is in
line with the recovering economy. Should downside risks materialize, Directors recommended
using the ample fiscal space as the first line of defense to prevent a set-back in the recovery.
They acknowledged that the authorities’ plan to borrow for major infrastructure projects would
generate benefits across several generations.

Directors noted that Singapore’s external position remained substantially stronger than
warranted by fundamentals in 2020, although some acknowledged the need to interpret the
external sector assessment with caution given uncertainty surrounding the pandemic. They
considered that higher government spending to address long-term challenges, along with the
expected drawdown of household savings, should contribute to external rebalancing over
time. In this context, they encouraged the authorities to quantify the costs of addressing
challenges such as population aging, climate change, digitalization, and future pandemics,
with a view to guiding future plans for revenue mobilization.

Directors supported maintaining the accommodative, data-dependent monetary policy stance
until the recovery is fully entrenched. They welcomed the monetary authority’s liquidity and
credit support measures, which have ensured proper market functioning. Given pockets of
risks remaining in the financial sector, Directors recommended continued supervisory
vigilance, including a close monitoring of nonperforming loans in real estate markets and
banks’ foreign currency risk. They also encouraged the authorities to continue to strengthen
US dollar liquidity among domestic systemically important banks (D -SIBs). Directors looked
f orward to further progress in enhancing the effectiveness of the AML/CFT f ramework and in
implementing the 2019 FSSA recommendations.

Directors welcomed ongoing initiatives to facilitate economic transition post-pandemic. They
noted that the authorities’ focus on labor reskilling and training would help facilitate resource
reallocation to high-growth sectors. The plans to accelerate digitalization, innovation, and
climate-resilient infrastructure investment should help sustain medium-term economic growth.

              ©International Monetary Fund. Not for Redistribution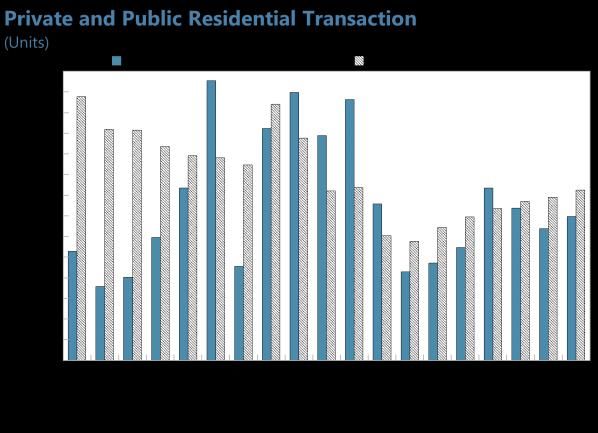
Table 1. Singapore: Selected Economic and Financial Indicators, 2015 –22
Nominal GDP (2020): US$340 billion
Population (2020): 5.69 million
GDP per capita (2020): US$59,819
Main goods exports (2020, percent of total non-oil goods exports): machinery & transport equip. (59.8 percent); chemical products (15.8 percent); and misc.
manufactured articles (10.6 percent).
Top three destinations for goods exports (2020, percent of gross goods exports): China (13.7 percent); Hong Kong SAR (12.4 pe rcent); and USA (10.5 percent).
                                                                                                                                                     Projections
                                                                                       2015       2016     2017     2018      2019      2020       2021       2022
Growth (percentage change)
   Real GDP                                                                               3.0       3.3      4.5      3.5        1.3     -5.4        6.0         3.1
      Total domestic demand 1/                                                            0.4       5.5      6.0      1.2        1.7    -10.7        5.3         3.1
           Final domestic demand 1/                                                       4.4       2.3      3.9      0.8        2.6    -10.2        5.4         3.1
        Consumption                                                                       5.9       3.4      3.1      3.8        3.3     -8.4        5.1         3.0
           Private consumption                                                            5.2       3.3      3.1      4.0        3.3    -14.1        5.6         3.1
        Gross capital formation 1/                                                      -8.6        9.5     11.1     -3.0       -1.1    -14.9        5.6         3.3
           Gross fixed investment                                                         2.0       0.5      5.4     -4.3        1.2    -13.7        6.0         3.4
           Change in inventories (contribution to GDP growth, percentage points) 1/     -3.0        2.3      1.6      0.3       -0.6     -0.5        0.0         0.0
        Net exports (contribution to GDP growth, percentage points) 1/                    3.6      -0.3      0.9      2.4       -0.1       3.1       2.5         1.0
Saving and investment (percent of GDP)
   Gross national saving                                                                44.0       44.0     44.6     40.4      38.9      40.2       39.1       38.7
   Gross domestic investment                                                            25.4       26.5     27.3     25.0      24.7      22.6       23.5       23.8
Inflation and unemployment (period average, percent)
   CPI inflation                                                                        -0.5       -0.5      0.6      0.4        0.6     -0.2        1.4         1.4
   CPI inflation, excluding food and energy 2/                                          -0.5       -0.5     -0.7     -0.1        0.4     -0.3        1.3         1.1
   MAS core inflation 2/                                                                  0.5       0.9      1.5      1.7        1.0     -0.2        0.8         1.4
   Unemployment rate                                                                      1.9       2.1      2.2      2.1        2.3       3.0       2.7         2.5
Central government finances (percent of GDP) 3/
   Revenue                                                                              17.3       18.5     18.9     17.9      17.9      17.7       18.7       18.6
   Expenditure                                                                          14.0       15.0     14.0     13.8      14.1      23.4       21.1       17.2
   Net lending/borrowing                                                                  3.3       3.5      4.9      4.1        3.8     -5.7       -2.4         1.4
   Net lending/borrowing, excluding nonproduced assets                                  -0.3        0.7      1.8      1.2        1.5     -7.4       -4.5       -0.9
   Primary balance 4/                                                                   -2.5       -2.5     -1.4     -2.0       -1.9    -11.1       -8.4       -4.3
Money and credit (end of period, percent change)
   Broad money (M2)                                                                       4.0       8.4      4.2      5.1        4.4     10.7        7.0         4.5
   Credit to private sector                                                               2.5       5.5      3.3      4.8        3.0       1.4       6.0         3.1
   Three-month S$ SIBOR rate (percent)                                                    1.2       1.0      1.5      1.9        1.8       0.4        …           …
Balance of payments (US$ billions)
   Current account balance                                                              57.6       56.0     59.3     57.9      53.4      59.8       59.1       59.8
        (In percent of GDP)                                                             18.7       17.6     17.3     15.4      14.3      17.6       15.5       14.9
      Goods balance                                                                     92.6       90.0   101.0    101.6       96.8      93.6      103.3      108.2
        Exports, f.o.b.                                                                396.2     373.2    416.4    458.9      441.3     411.6      465.7      488.3
        Imports, f.o.b.                                                               -303.7 -283.2 -315.4 -357.4 -344.5 -318.0 -362.4                       -380.1
   Financial account balance 5/                                                         52.4       56.9     34.2     45.4      61.8     -14.4       33.0       48.3
   Overall balance 5/                                                                     1.1      -1.8     27.4     12.5       -8.4     74.9       26.1       11.5
Gross official reserves (US$ billions)                                                 247.7     246.6    279.9    287.7      279.5     362.3      390.8      407.5
        (In months of imports) 6/                                                         6.7       6.0      6.0      6.2        6.8       7.8       7.9         8.0
Singapore dollar/U.S. dollar exchange rate (period average)                             1.37       1.38     1.38     1.35      1.36      1.38         …           …
Nominal effective exchange rate (percentage change) 7/                                  -0.9        1.9      0.0      1.0        1.4     -1.2         …           …
Real effective exchange rate (percentage change) 7/                                     -2.7       -0.2     -1.2     -0.6        0.2     -2.6         …           …
Memorandum items:
        Nominal GDP (in billions of Singapore Dollars)                                 423.4     440.4    474.1    507.1      510.7     469.1      502.1      524.7
        Growth (%)                                                                        6.1       4.0      7.7      7.0        0.7     -8.2        7.0         4.5
Sources: Data provided by the Singapore authorities; and IMF staff estimates and projections.
Note: Date and forecasts as of June 8, 2021
1/ Approximation based on available data.
2/ IMF staff estimates, showing projections from 2021. MAS core inflation excludes the costs of accommodation and private transport.
3/ IMF staff estimates on a calendar year basis following GFSM 2014.
4/ Net lending/borrowing excluding net investment return contribution (NIRC).
5/ Following the BPM6 sign convention, a positive entry implies net outflows.
6/ In months of following year's imports of goods and services.
7/ Increase is an appreciation.

                               ©International Monetary Fund. Not for Redistribution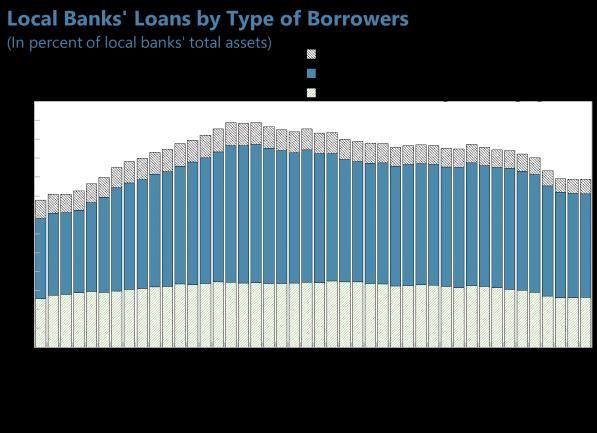
SINGAPORE
                STAFF REPORT FOR THE 2021 ARTICLE IV CONSULTATION
June 22, 2021

                KEY ISSUES
                Context

                Singapore entered the COVID-19 pandemic with sizable policy space and robust
                economic policy frameworks, yet facing longer-term challenges. The economy has been
                severely impacted by the pandemic, but a bold, comprehensive, and coordinated policy
                package has helped cushion the economic fallout. Following a record contraction in the
                first half of 2020, activity has rebounded, and growth is projected to strengthen to 6
                percent in 2021, underpinned by a recovery in domestic demand and a positive
                contribution from net exports. The uncertainty surrounding the outlook is larger than
                usual.

                Economic Policy Recommendations

                • As the recovery proceeds, the authorities’ shift from broad emergency relief to more
                   targeted fiscal and financial relief and policies to support post-pandemic priorities
                   is appropriate. In view of the substantial uncertainty, targeted policy support should
                   remain in place until the recovery is firmly entrenched.

                • Monetary policy is appropriately accommodative under the baseline scenario and
                  should remain data dependent going forward.

                • The financial sector remains healthy but vigilant financial supervision is called for.
                   The authorities should continue to enhance their strong system oversight and
                   remain watchful as smaller corporates may face challenges due to the crisis.

                • Should downside risks materialize, Singapore’s ample fiscal buffers can be drawn
                   upon to cushion the economic impact, with fiscal policy continuing to be the first
                   line of defense.

                • A quantification of spending needs to address medium- and long-term challenges—
                   including from aging, climate change, and technological development—would help
                   in assessing the need to use the existing fiscal space and to raise additional
                   revenue.

                • Achieving sustained growth post-pandemic would call for accelerated digitalization,
                   intensified re-skilling of workers displaced by technology shifts, and investment in
                   climate-resilient infrastructure. The authorities’ efforts to transition towards a
                   smarter, greener, and more inclusive economy post-pandemic are welcome.

                     ©International Monetary Fund. Not for Redistribution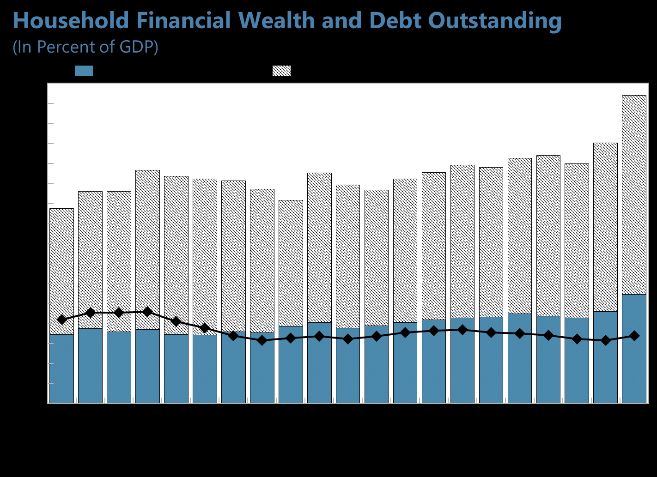
SINGAPORE

    Approved By             Mission meetings were held virtually during April 27–May 11, 2021.
    Odd Per Brekk (APD)     The mission team comprised: Nada Choueiri (Head), Tidiane Kinda,
    and Anna Ilyina (SPR)   Dan Nyberg, Abdul Mannan, Jiae Yoo (all APD), Natalia Novikova
                            (Resident Representative), and Han Teng Chua (Economist in
                            Singapore office). David Ong and Selene Yoe (OED) joined the
                            mission. Alisara Mahasandana (Executive Director) and Firman
                            Mochtar (Alternate Executive Director) joined the concluding
                            meeting. Kaustubh Chahande and Justin Flinner (both APD) assisted
                            in the preparation of this report. Data used in this report for staff
                            analyses are as of June 8, 2021, unless otherwise noted.

     CONTENTS

PRE-COVID-19 LANDSCAPE: STRENGTHS AND CHALLENGES ________________________________4

RECENT DEVELOPMENTS: A SEVERE IMPACT OF THE COVID-19 CRISIS CUSHIONED BY
POLICY SUPPORT ________________________________________________________________________________4

OUTLOOK: A RECOVERY WITH HEIGHTENED UNCERTAINTY AND BALANCED RISKS _______9

POLICIES TO SUSTAIN THE RECOVERY: TARGETED SUPPORT AND CLOSE MONITORING OF
RISKS ___________________________________________________________________________________________ 11
A. Near-Term Policy Mix _________________________________________________________________________11
B. Fiscal Policy ___________________________________________________________________________________12
C. Monetary and Financial Sector Policies _______________________________________________________14

BEYOND THE PANDEMIC: SUPPORT FOR A SMARTER, GREENER, AND MORE INCLUSIVE
ECONOMY _____________________________________________________________________________________ 18

STAFF APPRAISAL _____________________________________________________________________________ 20

BOXES
1. The COVID-19 Pandemic in Singapore________________________________________________________23
2. Impact of COVID-19 on Non-Financial Corporate Vulnerabilities _____________________________24
3. Singapore’s Climate Strategy _________________________________________________________________26

FIGURES
1. Real Sector Developments ____________________________________________________________________27
2. Labor Market Developments__________________________________________________________________28
3. Monetary and Financial Sector Developments ________________________________________________29
4. Banking Sector Developments ________________________________________________________________30
5. Housing Market Developments _______________________________________________________________31
6. External Sector ________________________________________________________________________________33

2      INTERNATIONAL MONETARY FUND

                ©International Monetary Fund. Not for Redistribution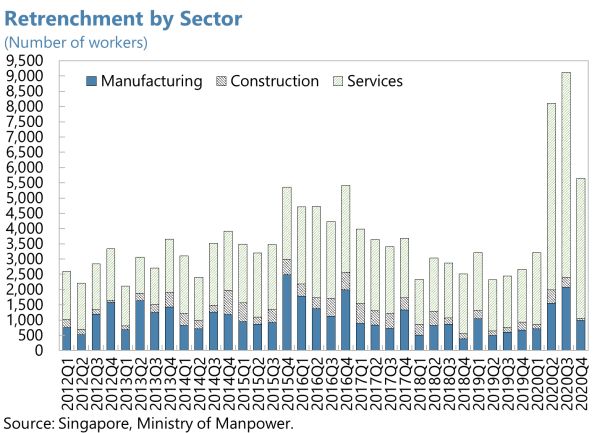
SINGAPORE

7. Spillovers _____________________________________________________________________________________34
8. Demographic Transition ______________________________________________________________________35
9. Social and Equality Indicators _________________________________________________________________36

TABLES
1. Selected Economic and Financial Indicators, 2015–22 ________________________________________37
2. Balance of Payments, 2015–22 ________________________________________________________________38
3. Monetary Survey, 2015–22____________________________________________________________________39
4. Indicators of Vulnerability, 2015–20 __________________________________________________________40
5. Medium-Term Scenario, 2015–25 _____________________________________________________________41
6. Summary of Government Operations and Stock Positions, FY2015−FY2021 __________________42
7. Financial Soundness Indicators—Local Banking Sector, 2017–20Q2 __________________________43
8. International Investment Position, 2015−20 __________________________________________________44

APPENDICES
I. Household Consumption Dynamics Around Shocks _________________________________________45
II. Labor Market Policy Responses to the COVID-19 Crisis ______________________________________47
III. COVID Pandemic Support Measures _________________________________________________________50
IV. External Sector Assessment __________________________________________________________________57
V. Risk Assessment Matrix ______________________________________________________________________58
VI. Public Debt Sustainability Analysis ___________________________________________________________59
VII. Status of Main Recommendations of the 2019 FSSA _________________________________________63
VIII. The Digital Economy: A Potential New Engine for Productivity Growth ______________________65
IX. E-Payments During the COVID-19 Pandemic and Beyond ___________________________________67
X. Green Finance _______________________________________________________________________________68

                                                               INTERNATIONAL MONETARY FUND         3

               ©International Monetary Fund. Not for Redistribution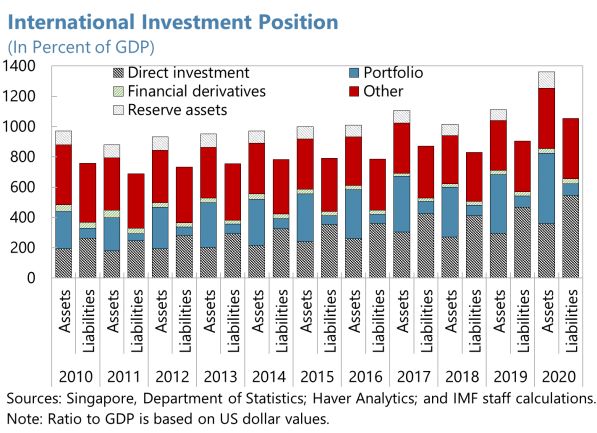
SINGAPORE

PRE-COVID-19 LANDSCAPE: STRENGTHS AND
CHALLENGES
1.      Singapore entered the pandemic with sizable policy buffers and robust policy
frameworks. Fiscal prudence and strong compliance with the balanced budget rule have led to the
accumulation of large net public sector assets. Monetary policy credibility, first-rate financial sector
regulation and supervision, and a resilient financial sector have been additional sources of strength.
More broadly, economic policy institutions and frameworks are strong. These features enable the
authorities to manage domestic and external shocks.

2.      Singapore was also facing important longer-term challenges. The pace of economic
expansion had moderated as growth averaged 3.6 percent during 2012-19, compared with 7.3
percent during 2002-07.1 This reflected in part declining productivity growth, especially in domestic-
oriented sectors. More recently, the tech cycle downturn and global trade tensions had weighed on
Singapore’s export-oriented economy, resulting in growth as low as 1.3 percent in 2019. Aging,
technological shifts, and climate change also presented longer-term challenges.

      SGP: Real GDP Growth                                                                                                                                      SGP Fiscal Balance
     (In percent y-o-y [LHS]; USD [RHS])                                                                                                                        (In percent of FY GDP, 5-year government term averages)
     16                                                                                                                                                70,000    1.8
              Real GDP Growth                                                                                                                                                               5-year Government Term
                     Average 2000-06
                                                                                                                                                                1.6                              5-year Government Term (Authorities’ definition)
     14              Average 2007-14
                                                                                                                                                       60,000
                     Average 2015-19
     12                                                                                                                                                         1.4
                     Nominal GDP Per Capita (USD) [RHS]
                                                                                                                                                       50,000   1.2
     10
                                                                                                                                                                1.0
       8                                                                                                                                               40,000
                                                                                                                                                                0.8
       6                                                                                                                                               30,000   0.6
       4                                                                                                                                                        0.4
                                                                                                                                                       20,000
       2                                                                                                                                                        0.2
                                                                                                                                                       10,000   0.0
       0
                                                                                                                                                                -0.2
      -2                                                                                                                                               0
           2000
                  2001
                         2002
                                2003
                                       2004
                                              2005
                                                     2006
                                                            2007
                                                                   2008
                                                                          2009
                                                                                 2010
                                                                                        2011
                                                                                               2012
                                                                                                      2013
                                                                                                             2014
                                                                                                                    2015
                                                                                                                           2016
                                                                                                                                  2017
                                                                                                                                         2018
                                                                                                                                                2019

                                                                                                                                                                -0.4
                                                                                                                                                                         FY1997-2001       FY2002-2006        FY2007-2011       FY2012-2015    FY2016-2019
      Sources: SGP Dept. of Statistics, CEIC Data, and IMF staff calculations.                                                                                  Sources: SGP Dept. of Statistics; and IMF staff calculations.

RECENT DEVELOPMENTS: A SEVERE IMPACT OF THE
COVID-19 CRISIS CUSHIONED BY POLICY SUPPORT
3.       The economic impact of the pandemic has been severe but uneven. While the first
COVID-19 cases were registered in January 2020, the virus spread worsened in 2020Q2, leading to
strict containment measures (Box 1). Consequently, real GDP contracted by a record 13.3 percent
year-on-year in 2020Q2. As the health crisis began to ease and restrictions were partly relaxed, the
economy rebounded, also helped by an exceptionally strong policy response. Overall, real GDP
contracted by 5.4 percent in 2020 (Figure 1). Tourism, consumer-facing services, and construction

1
 GDP per capita more than doubled during this period, from less than US$24,000 in 2000 to above US$65,000 in
2019.

4    INTERNATIONAL MONETARY FUND

                                                     ©International Monetary Fund. Not for Redistribution
SINGAPORE

were the hardest hit sectors, while manufacturing, information & communication, and finance &
insurance industries proved relatively resilient. On the demand side,

                                                             Output Level in 2020-2021 vs. Pre-COVID
                                                             (Pre-COVID, 2019Q4 = 100; seasonally adjusted)
                                                                   Manufacturing                                Construction
                                                                   Trade                                        Hotel & food
                                                                   Transportation                               InfoComm
                                                                   Finance & insurance                          Real estate, professional admin. & support svc.
                                                                   Overall GDP
                                                             130                                                                                            130
                                                             120                                                                                            120
                                                             110                                                                                            110
                                                             100                                                                                            100
                                                              90                                                                                            90
                                                              80                                                                                            80
                                                              70                                                                                            70
                                                              60                                                                                            60
                                                              50                                                                                            50
                                                              40                                                                                            40
                                                              30                                                                                            30
                                                                      2019Q4         2020Q1          2020Q2   2020Q3       2020Q4          2021Q1
                                                             Source: Haver, IMF staff calculations

external demand for goods provided some support while service exports and domestic demand
contracted sharply—particularly private consumption which remained weak in 2020H2, reflecting
subdued consumer sentiment and lingering health risks (Appendix I and Chapter 1 of Selected
Issues). The recovery firmed up in 2021Q1, with growth reaching 1.3 percent year-on-year , led by
strong manufacturing sector performance.

4.       Goods exports have increased after a sharp
drop in 2020Q2. While goods imports slowed, goods
exports increased in 2020, led by a pickup in non-oil
domestic exports (NODX), especially non-monetary
gold, specialized machinery, and electronics. NODX to
the U.S., Japan, and Korea grew in 2020, while NODX
to China declined. The strong growth of NODX has
continued in 2021, reaching 11.3 percent year-on
year in real terms in the first quarter. Services trade
declined sharply in 2020 driven

    Singapore: Temporary Adjustment and Retrenchment
   (Persons)
   90000
   80000             Retrenchment
                     Short work week & temporary layoff
   70000
   60000
   50000
   40000
   30000
   20000
   10000
        0
            2014Q1
            2015Q1
            2016Q1
            2017Q1
            2018Q1
            2019Q1
            2020Q1
            2021Q1
            1999Q1
            2000Q1
            2001Q1
            2002Q1
            2003Q1
            2004Q1
            2005Q1
            2006Q1
            2007Q1
            2008Q1
            2009Q1
            2010Q1
            2011Q1
            2012Q1
            2013Q1

    Sources: Haver Analytics.

                                                                                    INTERNATIONAL MONETARY FUND                                         5

                                ©International Monetary Fund. Not for Redistribution
SINGAPORE
by travel and transport services, with a sharper decline in imports than in exports, and remained
subdued in 2021Q1.
5. The labor market has been hard hit but is recovering. In 2020, retrenchments rose to 12.8
per 1,000 employees from 5.1 in 2019 but remained lower than in previous major recessions, as
firms relied more on flexible working arrangements (Figure 2).2 Total employment fell by 181,000
over the same period, led by the service sector. Non-resident employment accounted for the
decline, while resident employment increased, helped by large support measures such as wage
subsidies under the Jobs Support Scheme (JSS) that encouraged employers to retain local
employees and the Jobs Growth Incentive that supported employers to expand local hiring
(Appendix II and Chapter 2 of Selected Issues). Employment growth (excluding migrant domestic
workers) turned positive in 2021Q1, with the net increase in total employment level by 4,800, and
the number of retrenchments fell to pre-pandemic levels. Unemployment has steadily declined from
its peak of 3.5 percent in September 2020 to 2.9 percent in April 2021 but remained elevated (3.3
percent at end-2020 compared to 2.3 percent at end-2019).
6. Inflation has turned positive in 2021, after deflation in 2020. Both MAS core and
headline average inflation recorded -0.2 percent in 2020, as a significant output gap opened.3 MAS
core inflation turned negative in February 2020,
reflecting lower fuel, retail, and services prices,
and remained subdued through end-2020.
Headline inflation, however, recovered to zero at
end-2020, due to rising private transport and
accommodation costs. Inflation picked up in
2021 with MAS core inflation increasing to 0.6
percent in April, reflecting higher services
inflation and a smaller decline in retail and fuel
prices. Headline inflation reached 2.1 percent in
April, reflecting higher private transport costs,
and continued increase in accommodation costs.
7. The authorities have mounted an appropriately strong, comprehensive, and
coordinated policy response to cushion the impact of the pandemic. Support came primarily
through a substantial fiscal package (about S$97.3 billion, or 20.7 percent of GDP) in FY2020,
deployed in multiple stages and mostly financed through drawdowns of government reserves.
Above-the-line measures (about 16 percent of GDP) supported healthcare and mitigated economic
and social hardship through assistance to businesses, workers, and households. MAS helped
2
Retrenchment refers to the termination of permanent employees due to redundancy and early termination of term
contract employees due to redundancy. The incidence of retrenchment recorded 16.7 and 14.2 per 1,000 employees
during SARS (in 2003) and the global financial crisis (in 2009), respectively.
3
MAS includes food and energy items in core inflation but excludes the costs of accommodation and private road
transport as the latter largely reflect administered prices.
6 INTERNATIONAL MONETARY FUND
©International Monetary Fund. Not for RedistributionSINGAPORE
through monetary policy easing and liquidity provision (see below), as well as a broad financial
sector package that included opt-in moratoria on loan repayments, extension of payment terms for
trade finance facilities, additional financing Singapore: Key Policy Responses to the COVID-19 Pandemic in 2020
for working capital, and regulatory and List of Measures
Estimated size
(in percent of GDP)
supervisory flexibility (Appendix III). Fiscal
Emergency public health measures to fight COVID-19 2.9
Support for jobs, workers, businesses 15.6
Wage subsidies under the Jobs Support Scheme 5.7
8. The unprecedented fiscal response Loan capital (below-the-line measure) 4.7
Support to households 2.1
has led to the largest budget deficit in Care and Support Package (CSP) and Solidarity Payment 1.2
Singapore’s history. As government Monetary
Monetary policy easing (zero percent NEER appreciation)
spending rose substantially in FY2020, tax
Financial
revenues declined by 0.9 percent of GDP and MAS/Federal Reserve US$60bn swap line
Special financial relief programme
were only partially offset by larger Enhanced government loan schemes for corporates
Cap on domestic bank dividend distribution to 60 percent of FY2019 level
contributions from net investment returns Sources: Data provided by the Ministry of Finance; and IMF staff estimates.
(0.5 percent of GDP).4 Consequently, from a surplus of 1.7 percent of GDP in FY2019, the overall
fiscal balance excluding land sales turned to a deficit of 10.4 percent of GDP in FY20205, imparting a
12 percent of GDP fiscal impulse in FY20206 (or, on calendar basis, 10 percent of GDP fiscal impulse
in 2020) and adding an estimated 5 percentage points to growth in 2020.7
9. MAS’s policy response has helped
stabilize financial conditions. Financial
conditions tightened sharply in March-April
2020 but have since normalized, supported
by domestic, as well as global, central bank
policy measures (Figure 3). MAS eased
monetary policy at end-March 2020 in
response to deteriorating macroeconomic
conditions and a weakening outlook; it has
maintained a zero percent appreciation rate
of the nominal effective exchange rate
(S$NEER) since then, while providing liquidity
through money market operations. Interest rates and government bond yields declined to record-
low levels in 2020.
4
Fiscal year 2020 corresponds to April 1, 2020 to March 31, 2021. The IMF staff projection for GDP (for instance S$
470.6 billion in FY2020) is used to calculate the authorities’ budgetary accounts in percent of GDP.
5
Land sales represent the transformation of non-financial assets into financial assets and do not constitute a change
in total government net worth, therefore they are not included in the fiscal aggregate in this report. The overall
balance including land sales is estimated at -8.9 percent of GDP in FY2020.
6
The fiscal impulse measured as the change in the cyclically adjusted overall balance (excluding land sales) amounts
to an estimated 11.5 percent of potential GDP in FY2020.
7
The difference between the announced above-the-line measures (about 16 percent of GDP) and the estimated
fiscal impulse (about 12 percent of GDP) reflects the reallocation of some budgetary spending to the COVID-19
policy response package and budgetary execution in FY2020. The estimated growth impact of the fiscal impulse
assumes a multiplier of 0.5.
INTERNATIONAL MONETARY FUND 7
©International Monetary Fund. Not for RedistributionSINGAPORE
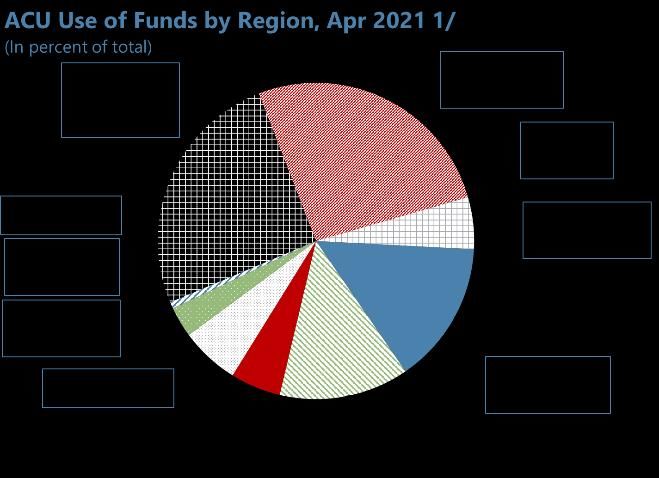
10. The role of Singapore as a regional financial hub was not disrupted by the pandemic.
Cross-border interbank markets have been resilient during the pandemic, although the global
economic slowdown entailed a moderation of trade finance volumes and net financing to the
region. The MAS-Federal Reserve US$60bn swap line, announced in March 2020 and subsequently
extended through end-December 2021, has played a critical role in boosting confidence and
stabilizing USD funding markets and lending to businesses both in Singapore and in the region. The
non-bank financial sector, including asset managers, has weathered the pandemic shock well.
11. Policy support has helped banks maintain strong buffers. Total regulatory capital to risk-
weighted assets stood at 17.8 percent in 2021Q1 (up from 16.8 percent in 2020Q1), substantially
above the 10 percent regulatory minimum. Supported by government measures, asset quality of
local banks held up, with NPLs at 1.5 percent of total non-bank loans in 2021Q1 (down from 1.6
percent in 2020Q1). Banks’ liquidity indicators improved, with non-bank deposits increasing by 4
percent year-on-year in 2021Q1 (following a 9.9 percent year-on-year increase in 2020) driven by
precautionary saving and safe-haven motives. Private sector non-bank credit growth was broadly
unchanged in the year to March 2021, upheld by government relief measures to facilitate credit
supply (Appendix III). The foreign currency loan-to-deposit ratio declined to 112 percent at end-
2021Q1 from 119 percent at end-2020Q1, while the domestic currency loan-to-deposit ratio
declined to 77 percent in 2021Q1 from 80 percent in 2020Q1, reflecting both higher US$ deposits
and lower trade-related financing during the pandemic (Figure 4). In 2021Q1, large domestic banks
reported robust earnings growth, alongside healthy and stable asset quality, and strong balance
sheet fundamentals in terms of capital, funding, and liquidity.
12. Debt-related risks in the corporate sector have risen. Singapore’s non-financial corporate
sector maintained healthy liquidity buffers before the pandemic, with the median cash ratio at 39
percent as of end-2019.8 The cash ratio increased further to 43 percent in 2020Q2, as many
corporates enhanced their liquidity buffers through short-term borrowing. This short-term debt,
together with a drop in GDP, drove corporate debt up to 169 percent of GDP in 2020Q2 (156
percent at end-2019). As profitability has deteriorated with the pandemic, corporate debt service
capacity has weakened, with the share of debt-at-risk doubling to 28 percent in 2020Q2 (Box 2).
While this suggests elevated debt-related risks at the trough of the crisis, corporate earnings are
expected to improve with the economic recovery. Corporate debt rollover risks, measured by the
share of short-term debt to total debt, decreased to 38 percent in 2020Q4 from 43 percent in
2019Q4.
13. The housing market has been stable during the pandemic, while the commercial real
estate market has been more adversely impacted. Private house prices and transactions have
held up; following a 2.2 percent increase in 2020, house prices further increased by 6.6 percent in
2021Q1 (year-on-year), while household mortgage loan NPLs remained stable at ½ percent of the
bank’s mortgage book in 2020 (Figure 5). The economic downturn, however, has reduced demand
for commercial space, and by end-2021Q1 prices for office and retail space had declined by 9.5
percent and 4.6 percent respectively. Vacancy rates for retail space edged up from 8.0 percent in
8
The cash ratio is defined as cash and cash equivalent divided by current liabilities.
8 INTERNATIONAL MONETARY FUND
©International Monetary Fund. Not for RedistributionSINGAPORE
2020Q1 to 8.5 percent in 2021Q1, and for office space from 11.0 percent to 11.9 percent during the
same period, although these have come down from peak levels in 2020.9
14. Singapore’s external position was substantially stronger than warranted by
fundamentals in 2020. The current account (CA) surplus rose to 17.6 percent of GDP (14.3 percent
in 2019), led by a large decline in services imports, a narrower oil trade deficit, and a decrease in net
payments of primary income related to the COVID-19 shock (Figure 6). IMF staff assesses the CA
gap at 1.2 to 7.2 percent of GDP (Appendix IV). The main drivers of Singapore’s external position
have been its financial center status and saving motives related to rapid aging (Figure 7 and 8). The
substantial increase in government spending in response to the crisis has helped reduce public
saving, as has been the case in peer countries. Over the medium term, higher government spending
directed to infrastructure, aging-related outlays, climate change, and the push towards digitalization
should help move Singapore towards external balance. Consistent with the estimated CA imbalance,
the 2020 real effective exchange rate is assessed to be undervalued by 2.5 to 14.5 percent, having
depreciated by 2.6 percent year-on-year.
15. Economic policies have been broadly consistent with past Fund advice. The authorities’
response to the COVID crisis was in line with Fund advice that fiscal policy should be the first line of
defense against downside risks materializing. Monetary policy remained data dependent and was
significantly eased in response to the deceleration in inflation. In recent years, government
expenditure had increased to accommodate healthcare and other aging-related spending,
transportation infrastructure, innovation, and targeted benefits to promote workers’ skills acquisition
and reduce inequality (Figure 9). The budget has increasingly benefited from contributions from the
net investment returns on government assets. As confirmed by the 2019 Financial System Stability
Assessment (FSSA), Singapore’s strong oversight underpins a resilient financial sector that is well-
positioned to support the post-pandemic economic recovery.
OUTLOOK: A RECOVERY WITH HEIGHTENED
UNCERTAINTY AND BALANCED RISKS
16. Singapore’s recovery is on track. Activity is expected to accelerate in 2021H2 as vaccines
become more widely available, bringing annual growth to 6 percent in 2021. Recovery in hard-hit
sectors, such as aviation and tourism-related industries, however, is likely to be more gradual
compared to manufacturing or modern services. Labor shortages are expected to weigh on the
construction sector. A recovery in domestic demand will likely underpin growth, alongside a positive
contribution from net exports. Inflation is expected to pick up as domestic demand recovers but to
remain contained given the remaining slack in the labor market. The CA surplus is projected to
decline to 15.5 percent of GDP as the recovery in domestic demand drives up imports, even as
9 Vacancy rates for retail and office space reached recent peaks of 9.6 percent and 12.1 percent respectively in
2020Q2.
INTERNATIONAL MONETARY FUND 9
©International Monetary Fund. Not for RedistributionSINGAPORE
exports continue to rise. Over the medium term, growth should converge to 2.5 percent, with the CA
surplus declining and MAS core inflation stabilizing at 2 percent.
17. The outlook is highly uncertain, but risks are balanced. Near term developments critically
depend on the local, regional, and global path of the pandemic, which is hard to predict given the
threat of new infections, limited information about new strains and effectiveness of vaccines against
them. Vaccine hesitancy could also hinder the path to recovery. A prolonged pandemic would delay
economic normalization, undermining growth prospects (Appendix V). Tighter or more volatile
global financial conditions could lead to sharp asset price declines and a rise in credit spreads, while
threats to globalization and trade would weigh on Singapore’s exports and growth. Increased
corporate sector vulnerabilities, including weakened debt service capacity due to the pandemic, and
the banking sector’s large exposure to the real estate market, are also sources of risk. On the upside,
faster-than anticipated global vaccine rollout and pandemic containment, as well as increased
confidence in the recovery, could further boost growth. A stronger-than-projected impact of the
recovery in the U.S. and in Europe on Singapore could also further support growth. While it remains
muted, domestic inflation should be closely watched in the context of rising inflation in trading
partners and global commodity prices.
Authorities’ Views
18. The authorities broadly agreed with staff’s assessment of the outlook. They expect real
GDP growth at 6 percent or above in 2021, barring a serious outbreak of infections domestically or
globally, as the recovery consolidates over the year supported by domestic and external demand.
COVID-19 will likely continue to have disparate impacts across sectors. Strong momentum in
manufacturing, led by electronics, would be sustained in 2021, even as hard-hit sectors such as
aviation and travel-related industries remain affected by travel restrictions. Substantial policy
stimulus, both domestically and in major trading partners, has helped alleviate adverse effects of the
pandemic and will continue supporting recovery prospects. The labor market is expected to
continue its recovery, even though slack could persist in some sectors in 2021. Inflation is picking
up, but the pace would ease in the second half of the year, as the base effects fade and global
commodity inflation moderates.
19. The authorities concurred that the outlook is subject to unusually high uncertainty. A
stronger-than-expected global electronics cycle and manufacturing performance could further
boost growth. So would faster than expected containment of the pandemic through global
vaccination efforts and other measures. However, the recovery could be thwarted, in case a strong
resurgence of the virus necessitates a significant tightening of containment measures. The uneven
impact of the pandemic will be a risk to the broader recovery in employment and corporate profits.
20. The authorities noted that Singapore’s financial sector has remained resilient during
the crisis. They emphasized that the financial sector entered the pandemic from a position of
strength and has maintained strong capital and liquidity buffers and good asset quality throughout
the crisis. Decisive fiscal, monetary, and financial policy measures have helped ease financial
conditions and facilitate the flow of credit to businesses and households. The balance sheets of
10 INTERNATIONAL MONETARY FUND
©International Monetary Fund. Not for RedistributionSINGAPORE
corporates, households, and banks have remained resilient following the onset of the COVID-19
pandemic. The banking sector’s strong capital and liquidity positions are a source of strength and a
robust base for banks to continue supporting the economy’s demand for credit during the recovery.
21. The authorities continue to disagree with the external balance assessment and
emphasized the unusually high uncertainty around the assessment due to the pandemic. Large
shocks such as the COVID-19 pandemic in 2020 make the assessment even more challenging than
usual. The authorities noted staff’s assessment that the policy gap had all but dissipated in 2020.
They considered the fact that the gap is almost entirely accounted for by the residuals as
underscoring the large uncertainty around the model assessment and the need for further work to
fully understand the impact of COVID-19 on the CA. In their view, Singapore’s CA balance reflects its
role as a regional financial hub, and its saving-investment gap is largely driven by the household
and government sectors. High household saving reflects the high share of prime working age
population actively saving for retirement, a factor which will decline as the population ages rapidly,
as well as social norms such as strong bequest motives. Government saving has already come down
and continues to reflect prudent and efficient management of fiscal policy. The authorities view that
government assets abroad are necessary given expected sizeable and growing expenditure
pressures over the medium term, associated with aging, infrastructure investment, climate change,
and the likely increase in the frequency of large magnitude shocks.
POLICIES TO SUSTAIN THE RECOVERY: TARGETED
SUPPORT AND CLOSE MONITORING OF RISKS
A. Near-Term Policy Mix
22. Considering the uneven recovery and significant uncertainty, near-term policies need
to focus on the appropriate fiscal, monetary, and financial policy mix to secure a broad-based
and durable recovery and manage risks:
• Under the baseline, as the economy recovers, the authorities’ shift from broad emergency
assistance to targeted fiscal and financial relief and policies to support post-pandemic priorities,
in the context of accommodative monetary policy, is appropriate. This strategy aims at allowing
the economy to operate as close-to-normal as possible under pandemic circumstances.
• The exit strategy from targeted fiscal and financial measures should continue to be aligned with
the breadth and pace of the recovery while facilitating resource reallocation across sectors. The
uneven sectoral impact of the pandemic will likely necessitate continued targeted support to
affected individuals and hard-hit, but solvent sectors, while facilitating the restructuring of non-
viable corporates.
• Should downside risks materialize, Singapore has ample fiscal space to deploy policy support.
Fiscal policy, which can best target affected sectors and households, should continue to play the
INTERNATIONAL MONETARY FUND 11
©International Monetary Fund. Not for RedistributionSINGAPORE
role of first line of defense without recourse to additional monetary policy accommodation,
barring large adverse shocks. Financial sector support should remain targeted to adversely
affected sectors and be time-bound.
B. Fiscal Policy
23. The reduced fiscal deficit in 2021, accompanied with the shift toward targeted relief
and post-pandemic priorities, is in line with the recovering economy. The FY2021 budget
includes a S$11bn (2.2 percent of GDP) COVID-19 Resilience Package aimed at extending some
measures from the preceding year.10 The package includes: public health care measures to support a
safe reopening of the economy; targeted support to workers and businesses, in particular some
extension of wage subsidies under the JSS with a lower level of wage support; targeted support to
the hardest hit sectors; and skills upgrade and job creation initiatives to facilitate resource
reallocation across sectors.11 The FY2021 budget also supports the transition towards a greener,
digital, and more inclusive economy (see below). As the recovery proceeds, the shift from broad
emergency relief to more targeted support is appropriate. The reduction in the fiscal deficit in
FY2021, following an unprecedent fiscal expansion in FY2020, is consistent with the speed at which
the output gap is closing. After widening by 12 percent of GDP in FY2020, the overall deficit is
projected to decline by 7.8 percent of GDP to 2.6 percent of GDP in FY2021,12 mostly due to lower
special transfers, in particular reduced wage subsidies under the JSS.
Singapore: Composition of the COVID-19 Resilience Package in the FY2021 Budget Change in Budget Balance
(In percent of GDP)
Estimated size
List of Measures Change in Budget Balance Change in output gap
(in percent of GDP) 10 10
Negative Fiscal
Public health and safe reopening 1.0 Impulse
6 6
including COVID-19 testing, vaccination, and tracing
Support for jobs, workers, businesses 1.1 2 2
Wage subsidies under the Jobs Support Scheme 0.6
-2 -2
SGUnited Jobs and Skills package, including Jobs Growth Incentive 0.3
Support to hardest hit sectors (e.g. aviation and tourism) 0.2
-6 -6
Support to households 0.1
-10 Positive Fiscal -10
COVID-19 Support Grant/Recovery Grant 0.1 Impulse
-14 -14
Total 2.2
FY2003
FY2004
FY2005
FY2006
FY2007
FY2008
FY2009
FY2010
FY2011
FY2012
FY2013
FY2014
FY2015
FY2016
FY2017
FY2018
FY2019
FY2020
FY2021
Sources: Data provided by the Ministry of Finance; and IMF staff estimates.
Notes: Numbers may not sum up due to rounding. Sources: IMF World Economic Outlook and IMF Staff Calculations
10To mitigate the economic impact of tightened social distancing measures associated with the return to Phase-2
(Heightened Alert), the government announced some additional measures totaling S$800 million (0.2 percent of
GDP) on May 28, 2021, to support impacted workers, businesses, and individuals. Financed through budgetary
reallocation within the FY2021 budget, the measures include enhanced support under the JSS, additional cash payout
to eligible individuals and workers, and rental relief.
11
A S$900 million (0.2 percent of GDP) Household Support Package not included in the COVID-19 Resilience
Package aims to provide continued support for families, including through one-off cash transfers.
12
The structural primary deficit is expected to decline by 7.3 percent of potential GDP in FY2021, following a
widening of 12.2 percent of GDP in FY2020.
12 INTERNATIONAL MONETARY FUND
©International Monetary Fund. Not for RedistributionSINGAPORE
24. Singapore retains ample fiscal space to provide additional support if needed in the
future (Appendix VI). With the trajectory of the recovery still highly uncertain, a derailment cannot
be ruled out. Should downside risks materialize, the authorities should have contingency plans ready
to deploy additional resources towards targeted economic support. While the size and composition
of these plans would depend on the magnitude of the downside risks and their specific nature, a key
element would be to ensure adequate support to the most vulnerable, including through the JSS
and social assistance. The fiscal measures announced in May in response to the tightened social
distancing measures, including temporary additional assistance under the JSS and a one-off payout
to affected individuals and businesses, illustrate the authorities’ readiness to provide further support
as needed.
25. The pace of budget adjustment needs to be aligned with the breadth and pace of the
recovery and account for spending needed to address medium- and long-term challenges.
These challenges include (1) an increase in spending needs due to the rapidly aging population, in
particular on healthcare; (2) fundamental threats including climate change given Singapore’s low-
lying areas; (3) the risk of future pandemics and the associated asymmetric, large economic impacts;
(4) lumpiness in the spending needed to rejuvenate public housing and infrastructure (such as rail
lines as well as water, drainage, and sewage systems); and (5) the need to raise productivity and help
ease transition costs for firms and workers as Singapore embraces technological change and
structural transformation. A quantification of the cost of these challenges and risks would be needed
to better assess their implications for the fiscal stance, plans for government borrowing, and
revenue mobilization needs, including the plan to hike the Goods and Services Tax (GST) rate
between 2022 and 2025.
26. The authorities’ plans to fund new major long-term infrastructure projects through
borrowing is appropriate. The government plans to issue new bonds under the Significant
Infrastructure Government Loan Act (SINGA) to finance major long-term infrastructure projects, such
as new rail lines, water management facilities and infrastructure to protect against rising sea levels. A
limit of S$90bn under SINGA is based on the pipeline of projects over the next 15 years. The
borrowings under SINGA would entail a significant shift in policy from the long-standing approach
of not using proceeds from central government borrowing for budget financing. Scaling up
infrastructure spending financed through debt is appropriate, considering low sovereign borrowing
costs, the potential role of government paper in deepening debt markets, and the boost that
government green bonds could provide to the authorities’ green finance objectives. 13
Authorities’ Views
27. The authorities emphasized that fiscal policy has been front and center in their
response to the pandemic. They countered the crisis with a large and comprehensive fiscal
package to stabilize the economy and prevent scarring, illustrating the country’s readiness to tap on
its sizeable fiscal reserves in the presence of large shocks. The authorities have shifted from broad
13
As part of the broad borrowing plan, the government plans to issue S$19 billion of green bonds over the next few
years.
INTERNATIONAL MONETARY FUND 13
©International Monetary Fund. Not for RedistributionSINGAPORE
emergency relief to targeted support and active labor market policies such as training and re-skilling
to facilitate labor reallocation to growing sectors and support the recovery. As fiscal policy remains
the first line of defense, the authorities stand ready to deploy additional targeted fiscal support,
commensurate with the size of the shock and its macroeconomic implications.
28. The authorities reiterated the need to maintain large fiscal reserves to preserve
intergenerational equity and in view of medium-term spending pressures. They indicated that
preserving a steady stream of income through contributions from net investment returns to
supplement the budget across generations is important for maintaining intergenerational equity. In
addition, the authorities reaffirmed their plans to raise the GST between 2022 and 2025 and
indicated that they are also considering increases in other taxes to ensure sufficient fiscal space to
meet future spending needs and large shocks. The authorities plan to issue bonds under SINGA to
finance major infrastructure projects, including green bonds for select projects, in line with their
fiscal principle to finance current spending with current revenue and use borrowing only for major
investments that benefits multiple generations.
C. Monetary and Financial Sector Policies
29. The accommodative monetary policy stance is appropriate. Since 1981, MAS has
operated a basket, band, and crawl exchange rate-based monetary policy framework in which the
S$NEER is managed against an undisclosed basket of currencies—a framework that has, as intended,
helped deliver price stability.14 Since the April 2020 policy easing, and in the face of weak inflation
and negative output gap, MAS has appropriately maintained a zero percent per annum rate of
appreciation of the policy band and an unchanged width of the band. With sustained inflows, this
policy required FX reserve purchases to the tune of US$44 billion in 2020H1, up from US$30 billion
in 2019H2.15 Monetary policy should remain data dependent. With the output gap still negative and
inflationary pressures muted, an accommodative monetary policy stance is called for until the
recovery is firmly entrenched.
FX Intervention
(Six month total; US$bn)
50
45
40
35
30
25
20
15
10
5
0
2019H2 2020H1
Sources: Haver Analytics
14
See CR 19/233.
15
The MAS started disclosing its foreign exchange (FX) intervention operations aggregated over a six-month period
with a 3-months lag in April 2020.
14 INTERNATIONAL MONETARY FUND
©International Monetary Fund. Not for RedistributionSINGAPORE
30. The authorities have made progress in implementing the 2019 FSSA
recommendations, particularly in strengthening cyber resilience, payment system oversight,
and US dollar liquidity among D-SIBs (Appendix VII). Efforts in these and other areas should
continue. While the MAS/Federal Reserve US$ swap line was critical in supporting US$ liquidity
during the peak of the crisis, MAS should continue to strengthen US dollar liquidity among D-SIBs
and work with banks to ensure they actively monitor and prudently manage their foreign currency
risk. MAS continues to work on enhancing operational readiness of the resolution framework and on
formalizing its supervisory expectation on banks’ management of material outsourcing risk.
31. Systemic banks are expected to remain solvent in the face of COVID-related shocks.
The impact of the pandemic may become more prolonged than assumed in IMF staff’s baseline
macro framework. In 2020H2, MAS conducted a stress test incorporating COVID shock scenarios for
D-SIBs, which assumed continued disruptions to economic activity in 2021 due to delays in vaccine
deployment alongside a global resurgence in virus outbreaks (the shocks are broadly similar in size
to the 2019 FSSA stress tests). The results showed that all D-SIBs would remain solvent, with their
aggregate common equity (CET1) capital ratios well above MAS’ minimum regulatory requirements.
Still, commercial banks are likely to face continued challenging operating conditions until the
pandemic is under control. In this context, dividend distribution limits should be considered in the
context of updated stress tests to ensure strong capital and liquidity buffers amidst elevated
uncertainty about the trajectory of the pandemic.16 .
32. Financial support measures should remain targeted to adversely impacted sectors and
gradually withdrawn as the recovery broadens. The government’s policy response has provided
adequate, temporary, and increasingly targeted, support to corporates. However, pockets of risks
remain for smaller firms (which tend to be financially weaker) and firms in domestically oriented or
travel-related services, which have been hardest hit by the pandemic. Against the background of a
possible increase in economic distress, the authorities have taken welcome temporary measures to
amend the insolvency framework and raised the thresholds for bankruptcy and lengthening the
statutory period for debtors to respond to creditor demands. The authorities have also temporarily
simplified the insolvency and debt restructuring procedures for micro and small enterprises. Once
the recovery is broadly entrenched, a gradual withdrawal of support, complemented with continued
skills upgrade and job placement initiatives in growing sectors (see below), will facilitate necessary
resource reallocation across sectors, while the insolvency framework will address non-viable
companies. Financial indicators to consider when calibrating the withdrawal of support could include
the evolution of banks’ lending standards, sectoral credit growth, and indicators of corporate
financial health.
33. Continued careful monitoring of real estate markets and associated financial stability
risks is called for. Corporate real estate related debt and household mortgages capture a
substantial share of domestic systemically important banks’ assets. The outlook for the commercial
16
In July 2020, MAS called on Singapore-headquartered locally incorporated banks to cap their total dividends per
share for FY2020 at 60 percent of FY2019 levels to pre-emptively bolster their resilience and capacity to lend.
INTERNATIONAL MONETARY FUND 15
©International Monetary Fund. Not for RedistributionYou can also read