COVID-19 Economic Assessment
←
→
Page content transcription
If your browser does not render page correctly, please read the page content below
Special Report
10 August 2020
Phone: 03 9655 3881
Email: info@ibisworld.com
COVID-19 Economic Assessment
Introduction
Leading industry research company IBISWorld has published an in-depth breakdown of how the
COVID-19 pandemic is affecting every subdivision in the economies of Australia and New Zealand.
This report, compiled by a team of senior industry analysts, classifies the level of disruption for each
subdivision, and provides analysis on the key factors that have determined performance over 2019-
20, and will affect each subdivision in 2020-21 and beyond.
The worsening COVID-19 outbreak during 2020 has had a significant and growing influence on
domestic and international economic activity. Australia and New Zealand have been relatively
successful in containing COVID-19 compared with other regions. However, supply chain disruptions,
and ongoing travel and tourism restrictions continue to hinder Australia and New Zealand. Overall,
the virus’ impact on economic activity has been highly damaging, leading to the first technical
recession in Australia since 1991-92.
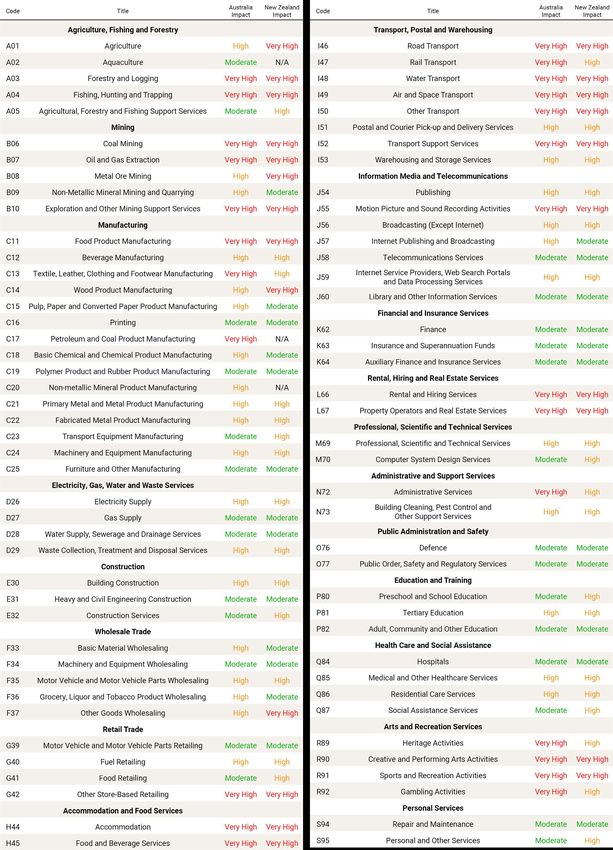
‘IBISWorld has classified the degree of impact for each subdivision as moderate, high or very high.
The level of disruption depends on the degree of exposure to international trade, and the impact on
business and consumer confidence,’ said Senior Industry Analyst Matthew Reeves.
COVID-19 has negatively affected the Australian and New Zealand economies by disrupting consumer
demand and business supply. Consumer sentiment has deteriorated significantly, weakening demand
across most industries. Households have scaled back discretionary spending due to fears relating to
rising unemployment and economic uncertainty. Many businesses have abandoned or postponed
investment in new productive capacity to retain cash and provide a liquidity buffer to survive the
COVID-19 pandemic. Supply chain disruptions in Australia and New Zealand, and in foreign markets
have also hindered business activity, further dampening economic growth.
Some subdivisions are expected to outperform during the COVID-19 pandemic. Social distancing
has pushed many consumers to online channels for shopping, communication, food purchases and
working arrangements. This trend has driven a surge in sectors such as online shopping, postal
services, and data storage services. Some industries in the Mining subdivision have benefited
from declining operating costs associated with lower fuel prices. Other industries have suffered
direct negative effects, but have also seen positive factors, such as rising demand for repairs and
maintenance services replacing new purchases.
Ratings methodology
Exposure ratings are determined by assessing an industry’s reliance on international trade, supply
chain risks and other industry-specific factors. Ratings are assigned in comparison with the rest of the
economy. While almost all industries are experiencing dramatic effects due to COVID-19, IBISWorld’s
ratings system will result in some industries being deemed to have lower exposure to COVID-19.
COVID-19 Economic Assessment 10 August 2020 www.ibisworld.com.au 1Australia and New Zealand Impact Levels COVID-19 Economic Assessment 10 August 2020 www.ibisworld.com.au 2
Victorian Update
The Victorian Government has implemented Stage 4 restrictions from 2 August, including a nightly
curfew and unprecedented curtailment of economic activity. These restrictions are set to have a
major and long-lasting impact on both the Victorian and national economies.

Economic impact in Victoria
In Victoria, 250,000 employees are expected to be stood down this week. This figure is in addition
to the roughly 250,000 Victorians who have already lost employment since the COVID-19 outbreak
emerged in February 2020. While the original loss of employment was primarily concentrated in
hospitality and tourism industries, the latest job losses are far more widespread. Imminent job
losses will be concentrated in the retail, wholesale, construction and manufacturing divisions, which
accounted for 58.7% of Victoria’s Gross State Product (GSP) in 2018-19. Over 500,000 Victorians are
already working from home, and one million teachers and students will not attend school throughout
the lockdown period.
An economic update provided by the Victorian Government in late July 2020 outlined an expected
budget deficit of $7.5 billion in 2019-20, down from a $618 million surplus originally anticipated for
the year. The update also predicted a 5.25% GSP decline for 2020, and a 6.25% recovery in 2021.
However, these figures were predicated on a six-week Stage 3 lockdown through to 20 August
2020. The far-reaching Stage 4 restrictions through to mid-September are expected to cost Victoria
between $20 and $25 billion. Victoria’s GSP is estimated to be about 14% lower in the June and
September quarters relative to forecasts in the 2019‑20 state budget, dropping $55 billion over an
18‑month period.
Many large national retailers no longer qualify for JobKeeper, forcing their Victorian employees to
rely on accrued leave or JobSeeker support throughout the six-week lockdown. Wesfarmers’ major
brands, including Kmart, Target, Bunnings and Officeworks, employ over 25,000 people in Victoria
and are not eligible for JobKeeper support.
The effects of the Stage 4 lockdown will extend far beyond the next six weeks. The latest restrictions
are anticipated to create gaps in supply chains across the Manufacturing division, which will likely
be met by interstate companies. While this resolution will alleviate the national implications of the
Victorian lockdown, it will also lead to a permanent loss in market share for Victorian enterprises to
interstate competitors.

Economic impact across Australia
The loss of economic activity across most Victorian industries is a devastating blow for the Australian
economy. According to SGS Economics and Planning, Melbourne accounted for 39.8% of national
GDP growth in 2018-19. Melbourne contributed the most growth across all regions in Australia, and
achieved the highest growth on record in that year.
The second wave of COVID-19 has delayed the resumption of interstate travel, with border restrictions
still enforced for most states and territories. Plans to implement an international travel bubble with
New Zealand have been effectively abandoned, extending the economic fallout for the Tourism
industry. The second wave has also negatively affected consumer sentiment and business confidence
across Australia, stifling the modest recovery in employment that occurred from late April to early
June 2020.
According to the Australian Prudential Regulation Authority, $274 billion in loans were granted
temporary repayment deferrals as at 30 June 2020, equivalent to 10% of all outstanding loans in

COVID-19 Economic Assessment             10 August 2020            www.ibisworld.com.au              3
Australia. Almost 17% of all loans to small businesses were deferred, and 11% of all housing loans.
These measures are expected to rise significantly through to September in response to the Stage 4
restrictions imposed in Victoria, placing further pressure on the National and Regional Commercial
Banks industry.
Projections released by the Federal Government on 23 July outlined an estimated $184.5 billion
deficit in 2020-21. Stage 4 restrictions in Victoria are expected to significantly worsen this forecast,
particularly as Victoria accounted for 23.7% of Australian GDP in 2018-19. National GDP in the
September quarter is expected to decline by 5.0%, primarily due to Victoria’s stronger lockdown
restrictions. Both the Victorian and Federal Governments have announced additional business
support measures, including up to $20,000 for businesses forced to close and $1,500 in pandemic
leave support for employees forced to self-isolate.
If successful, Victoria’s struggle against COVID-19 could leave all of Australia with minimal active
COVID-19 cases heading into the final quarter of 2020. This outcome would position Australia for a
strong rebound in economic activity during 2021. However, state governments will likely be cautious
about relaxing restrictions, given the hard lessons learned by Victoria’s failure to contain the virus.

COVID-19 Economic Assessment              10 August 2020           www.ibisworld.com.au               4
Victorian Impact Levels

COVID-19 Economic Assessment   10 August 2020   www.ibisworld.com.au   5
Contents
Australia.................................................................................................. 12
Agriculture, Forestry and Fishing....................................................................................... 12
A01 Agriculture: High...................................................................................................................................................... 12
A02 Aquaculture: Moderate......................................................................................................................................... 13
A03 Forestry and Logging: Very High....................................................................................................................... 13
A04 Fishing, Hunting and Trapping: Very High..................................................................................................... 13
A05 Agricultural, Forestry and Fishing Support Services: Moderate............................................................ 14

Mining....................................................................................................................................... 14
B06 Coal Mining: Very High.......................................................................................................................................... 14
B07 Oil and Gas Extraction: Very High...................................................................................................................... 15
B08 Metal Ore Mining: High......................................................................................................................................... 15
B09 Non-Metallic Mineral Mining and Quarrying: High................................................................................... 16
B10 Exploration and Other Mining Support Services: Very High................................................................... 16

Manufacturing......................................................................................................................... 17
C11 Food Product Manufacturing: Very High ...................................................................................................... 17
C12 Beverage Manufacturing: High........................................................................................................................... 18
C13 Textile, Leather, Clothing and Footwear Manufacturing: Very High.................................................... 19
C14 Wood Product Manufacturing: High .............................................................................................................. 20
C15 Pulp, Paper and Converted Paper Product Manufacturing: High ........................................................ 20
C16 Printing (Including the Reproduction of recorded media): Moderate .............................................. 21
C17 Petroleum and Coal Product Manufacturing: Very High ........................................................................ 21
C18 Basic Chemical and Chemical Product Manufacturing: High ................................................................ 22
C19 Polymer Product and Rubber Product Manufacturing: Moderate ...................................................... 23
C20 Non-metallic Mineral Product Manufacturing: High................................................................................. 23
C21 Primary Metal and Metal Product Manufacturing: High.......................................................................... 24
C22 Fabricated Metal Product Manufacturing: High.......................................................................................... 24
C23 Transport Equipment Manufacturing: Moderate......................................................................................... 24
C24 Machinery and Equipment Manufacturing: High........................................................................................ 25
C25 Furniture and Other Manufacturing: Moderate........................................................................................... 25

Electricity, Gas, Water and Waste Services...................................................................... 26
D26 Electricity Supply: High.......................................................................................................................................... 26
D27 Gas Supply: Moderate........................................................................................................................................... 26
D28 Water Supply, Sewerage and Drainage Services: Moderate................................................................... 27
D29 Waste Collection, Treatment and Disposal Services: High...................................................................... 27

COVID-19 Economic Assessment                                          10 August 2020                             www.ibisworld.com.au                                       6
Construction............................................................................................................................ 27
E30 Building Construction: High................................................................................................................................. 27
E31 Heavy and Civil Engineering Construction: Moderate............................................................................... 28
E32 Construction Services: Moderate....................................................................................................................... 28

Wholesale Trade..................................................................................................................... 29
F33 Basic Material Wholesaling: High....................................................................................................................... 29
F34 Machinery and Equipment Wholesaling: Moderate................................................................................... 29
F35 Motor Vehicle and Motor Vehicle Parts Wholesaling: High..................................................................... 29
F36 Grocery, Liquor and Tobacco Product Wholesaling: High........................................................................ 30
F37 Other Goods Wholesaling: High......................................................................................................................... 30

Retail Trade.............................................................................................................................. 30
G39 Motor Vehicle and Motor Vehicle Parts Retailing: Moderate................................................................. 30
G40 Fuel Retailing: High................................................................................................................................................. 31
G41 Food Retailing: Moderate..................................................................................................................................... 31
G42 Other Store-Based Retailing: Very High.......................................................................................................... 31

Accommodation and Food Services................................................................................. 32
H44 Accommodation: Very High ............................................................................................................................... 32
H45 Food and Beverage Services: Very High ....................................................................................................... 33

Transport, Postal and Warehousing.................................................................................. 34
I46 Road Transport: Very High..................................................................................................................................... 34
I47 Rail Transport: Very High........................................................................................................................................ 35
I48 Water Transport: Very High.................................................................................................................................... 35
I49 Air and Space Transport: Very High.................................................................................................................... 36
I50 Other Transport: Very High.................................................................................................................................... 36
I51 Postal and Courier Pick-up and Delivery Services: High............................................................................ 37
I52 Transport Support Services: Very High.............................................................................................................. 37
I53 Warehousing and Storage Services: High........................................................................................................ 38

Information Media and Telecommunications................................................................ 38
J54 Publishing (Except Internet and Music Publishing): High......................................................................... 38
J55 Motion Picture and Sound Recording Activities: Very High..................................................................... 39
J56 Broadcasting (Except Internet): High................................................................................................................. 40
J57 Internet Publishing and Broadcasting: High................................................................................................... 40
J58 Telecommunications Services: Moderate........................................................................................................ 41
J59 Internet Service Providers, Web Search Portals and Data Processing Services: High.................... 41
J60 Library and Other Information Services: Moderate..................................................................................... 41

COVID-19 Economic Assessment                                         10 August 2020                             www.ibisworld.com.au                                      7
Financial and Insurance Services........................................................................................ 41
K62 Finance: Moderate................................................................................................................................................... 41
K63 Insurance and Superannuation Funds: Moderate....................................................................................... 42
K64 Auxiliary Finance and Insurance Services: Moderate................................................................................. 43

Rental, Hiring and Real Estate Services............................................................................ 43
L66 Rental and Hiring Services (Except Real Estate): Very High...................................................................... 43
L67 Property Operators and Real Estate Services: Very High.......................................................................... 44

Professional, Scientific and Technical Services............................................................... 45
M69 Professional, Scientific and Technical Services: High................................................................................ 45
M70 Computer System Design Services: Moderate............................................................................................ 46

Administrative and Support Services............................................................................... 46
N72 Administrative Services: Very High................................................................................................................... 46
N73 Building Cleaning, Pest Control and Other Support Services: High.................................................... 47

Public Administration and Safety...................................................................................... 47
O76 Defence: Moderate ............................................................................................................................................... 47

Education and Training........................................................................................................ 48
P80 Preschool and School Education: Moderate ................................................................................................ 48
P81 Tertiary Education: High ....................................................................................................................................... 50
P82 Adult, Community and Other Education: Moderate.................................................................................. 51

Health Care and Social Assistance...................................................................................... 51
Q84 Hospitals: Moderate............................................................................................................................................... 51
Q85 Medical and Other Healthcare Services: High............................................................................................. 52
Q86 Residential Care Services: High.......................................................................................................................... 52
Q87 Social Assistance Services: Moderate.............................................................................................................. 52

Arts and Recreation Services.............................................................................................. 53
R89 Heritage Activities: Very High.............................................................................................................................. 53
R90 Creative and Performing Arts Activities: Very High.................................................................................... 53
R91 Sports and Recreation Activities: Very High.................................................................................................. 54
R92 Gambling Activities: Very High........................................................................................................................... 54

Personal Services................................................................................................................... 55
S94 Repair and Maintenance: Moderate................................................................................................................. 55
S95 Personal and Other Services: Moderate.......................................................................................................... 55

COVID-19 Economic Assessment                                         10 August 2020                             www.ibisworld.com.au                                     8
New Zealand......................................................................................... 56
Agriculture, Forestry and Fishing...................................................................................... 56
A01 Agriculture: Very High............................................................................................................................................ 56
A03 Forestry and Logging: Very High....................................................................................................................... 57
A04 Fishing and Aquaculture: Very High................................................................................................................. 57
A05 Agricultural, Forestry and Fishing Support Services: High...................................................................... 57

Mining...................................................................................................................................... 58
B06 Coal Mining: Very High.......................................................................................................................................... 58
B07 Oil and Gas Extraction: Very High...................................................................................................................... 59
B08 Metal Ore Mining: Very High............................................................................................................................... 59
B09 Non-Metallic Mineral Mining and Quarrying: Moderate......................................................................... 60
B10 Exploration and Other Mining Support Services: Very High................................................................... 60

Manufacturing........................................................................................................................ 60
C11 Food Product Manufacturing: Very High ...................................................................................................... 60
C12 Beverage Manufacturing: High........................................................................................................................... 61
C13 Textile, Leather, Clothing and Footwear Manufacturing: High............................................................... 62
C14 Wood Product Manufacturing: Very High .................................................................................................... 62
C15 Pulp, Paper and Converted Paper Product Manufacturing: Moderate ............................................. 63
C16 Printing: Moderate ................................................................................................................................................. 63
C18 Basic Chemical and Chemical Product Manufacturing: Moderate . .................................................... 63
C19 Polymer Product and Rubber Product Manufacturing: Moderate ...................................................... 63
C21 Primary Metal and Metal Product Manufacturing: High.......................................................................... 64
C22 Fabricated Metal Product Manufacturing: High.......................................................................................... 64
C23 Transport Equipment Manufacturing: High................................................................................................... 64
C24 Machinery and Equipment Manufacturing: High........................................................................................ 65
C25 Furniture and Other Manufacturing: Moderate........................................................................................... 65

Electricity, Gas, Water and Waste Services...................................................................... 65
D26 Electricity Supply: High.......................................................................................................................................... 65
D27 Gas Supply: Moderate........................................................................................................................................... 66
D28 Water Supply, Sewerage and Drainage Services: Moderate................................................................... 66
D29 Waste Collection, Treatment and Disposal Services: High...................................................................... 66

Construction............................................................................................................................ 67
E30 Building Construction: High................................................................................................................................. 67
E31 Heavy and Civil Engineering Construction: Moderate............................................................................... 67
E32 Construction Services: High................................................................................................................................. 67

COVID-19 Economic Assessment                                         10 August 2020                             www.ibisworld.com.au                                     9
Wholesale Trade..................................................................................................................... 68
F33 Basic Material Wholesaling: Moderate............................................................................................................ 68
F34 Machinery and Equipment Wholesaling: Moderate................................................................................... 68
F35 Motor Vehicle and Motor Vehicle Parts Wholesaling: High..................................................................... 68
F36 Grocery, Liquor and Tobacco Product Wholesaling: Moderate............................................................. 68
F37 Other Goods Wholesaling: Very High.............................................................................................................. 69

Retail Trade.............................................................................................................................. 69
G39 Motor Vehicle and Motor Vehicle Parts Retailing: Moderate................................................................. 69
G40 Fuel Retailing: High................................................................................................................................................. 69
G41 Food Retailing: High............................................................................................................................................... 70
G42 Other Store-Based Retailing: Very High.......................................................................................................... 70

Accommodation and Food Services.................................................................................. 71
H44 Accommodation: Very High ............................................................................................................................... 71
H45 Food and Beverage Services: Very High......................................................................................................... 72

Transport, Postal and Warehousing................................................................................... 72
I46 Road Freight Transport: Very High...................................................................................................................... 72
I47 Rail Freight Transport: High................................................................................................................................... 73
I48 Water Transport: Very High.................................................................................................................................... 73
I49 Air and Space Transport: Very High.................................................................................................................... 73
I50 Other Transport: Very High.................................................................................................................................... 74
I51 Postal and Courier Pick-up and Delivery Services: High............................................................................ 74
I52 Transport Support Services: Very High.............................................................................................................. 74
I53 Warehousing and Storage Services: High........................................................................................................ 75

Information Media and Telecommunications................................................................. 75
J54 Publishing (Except Internet and Music Publishing): High......................................................................... 75
J55 Motion Picture and Sound Recording Activities: Very High..................................................................... 75
J56 Broadcasting (Except Internet): High................................................................................................................. 76
J57 Internet Publishing and Broadcasting: Moderate........................................................................................ 77
J58 Telecommunications Services: Moderate........................................................................................................ 77
J59 Internet Service Providers, Web Search Portals and Data Processing Services: High.................... 77
J60 Library and Other Information Services: Moderate..................................................................................... 77

Financial and Insurance Services........................................................................................ 78
K62 Finance: Moderate................................................................................................................................................... 78
K63 Insurance and Superannuation Funds: Moderate....................................................................................... 78
K64 Auxiliary Finance and Insurance Services: Moderate................................................................................. 78

COVID-19 Economic Assessment                                         10 August 2020                             www.ibisworld.com.au                                    10
Rental, Hiring and Real Estate Services............................................................................. 79
L66 Rental and Hiring Services (Except Real Estate): Very High...................................................................... 79
L67 Property Operators and Real Estate Services: Very High.......................................................................... 79

Professional, Scientific and Technical Services............................................................... 80
M69 Professional, Scientific and Technical Services: High................................................................................ 80
M70 Computer System Design Services: High...................................................................................................... 81

Administrative and Support Services................................................................................ 81
N72 Administrative Services: High............................................................................................................................. 81
N73 Building Cleaning, Pest Control and Other Support Services: High.................................................... 82

Public Administration and Safety...................................................................................... 82
O76 Defence: Moderate................................................................................................................................................. 82
O77 Public Order, Safety and Regulatory Services: Moderate........................................................................ 82

Education and Training........................................................................................................ 82
P80 Preschool and School Education: High............................................................................................................ 82
P81 Tertiary Education: High ....................................................................................................................................... 83
P82 Adult, Community and Other Education: Moderate.................................................................................. 84

Health Care and Social Assistance..................................................................................... 84
Q84 Hospitals: Moderate............................................................................................................................................... 84
Q85 Medical and Other Healthcare Services: High............................................................................................. 85
Q86 Residential Care Services: High.......................................................................................................................... 85
Q87 Social Assistance Services: High........................................................................................................................ 85

Arts and Recreation Services.............................................................................................. 85
R89 Heritage Activities: High........................................................................................................................................ 85
R90 Creative and Performing Arts Activities: Very High.................................................................................... 86
R91 Sports and Recreation Activities: Very High.................................................................................................. 86
R92 Gambling Activities: High..................................................................................................................................... 86

Personal Services................................................................................................................... 86
S94 Repair and Maintenance: Moderate................................................................................................................. 86
S95 Personal and Other Services: High.................................................................................................................... 87

COVID-19 Economic Assessment                                        10 August 2020                            www.ibisworld.com.au                                   11
Australia
Agriculture, Forestry and Fishing
A01 Agriculture: High
The COVID-19 outbreak is expected to significantly affect the Agriculture subdivision in Australia
due to the export-oriented nature of many agricultural industries and their downstream markets.
Although Australia’s agricultural production more than satisfies domestic demand, economic
disruption in downstream markets poses a risk to agriculture firms. For example, sales of fruit and
vegetables shifted to retail and wholesale markets as public health restrictions on movement and
gatherings caused demand from food-service industries to decline. Smaller producers that normally
sell their produce to food-service businesses and at fresh produce markets could encounter difficulty
in accessing retail and wholesale markets, which typically favour large-scale producers. However,
these pressures are anticipated to ease as state and territory governments gradually lift restrictions
on movement and gatherings across Australia. In addition, farms are also anticipated to face labour
shortages as Australia’s international borders remain closed to temporary visa holders, which will
likely affect output for labour-intensive commodities. As of 1 July 2020, the Federal Government
has expanded Harvest Labour Services into 16 regional areas with the aim of helping farmers secure
labour.
Falling incomes both locally and globally are anticipated to place downward pressure on some
agricultural commodity prices over the medium term, presenting a threat to subdivision operators’
revenue. For example, global demand for cotton and wool is anticipated to decline as retail sales
fall, which will likely reduce prices and therefore revenue generated by Australian growers. In June
2020, the Australian Bureau of Agricultural and Resource Economics (ABARES) reported that the
COVID-19 pandemic would likely contribute to continued declines in prices received for wool, sugar
and oilseeds. Deteriorating economic conditions globally have contributed to declining demand
and prices for crude oil. Falling crude oil prices have affected demand for derived and substitute
products, such as synthetic fibres and alternative fuels.
Disruption to global economic activity due to the COVID-19 outbreak is expected to affect demand for
Australian agricultural exports. Nevertheless, Australia’s agricultural produce has a strong reputation
in export markets, which will likely support demand for some products. Agricultural exporters also
face risks from declining air cargo traffic, which has raised freight costs for highly perishable goods
that require air freight transport. In April 2020, the Federal Government announced a $110.0 million
International Freight Assistance Mechanism to reduce shipping costs and support exporters. These
flights have since commenced, delivering Australian produce to several countries, mainly in Asia. In
July 2020, the Federal Government announced that it would extend the air freight scheme until the
end of 2020, at a cost of $240.0 million. The NSW Government has also announced a $140.0 million
support package for agricultural firms affected by the summer 2020 bushfires. These measures, along
with other federal and state government stimulus measures, are anticipated to provide significant
support to operators across the Agriculture subdivision.
The COVID-19 outbreak has had mixed effects on export markets for Australian meat and dairy
products. Sheep, beef and dairy cattle farmers have benefited from strong domestic retail demand
for lamb, beef and dairy products, which has partly offset declining demand from the food-service
sector. Over the first half of 2019-20, exports of beef and lamb to China surged from a high base
following an outbreak of African swine fever that cut China’s pig herd in half. In June 2020, ABARES
reported that livestock prices have remained high due to continued strong demand from other

COVID-19 Economic Assessment             10 August 2020            www.ibisworld.com.au             12
countries in Asia. Trade tensions between Australia and China are also affecting agricultural exports,
with China limiting beef imports and imposing heavy tariffs on Australian barley in May 2020. These
measures are expected to negatively affect prices received for Australian produce in other export
markets.

A02 Aquaculture: Moderate
The Aquaculture subdivision is expected to be moderately affected by the COVID-19 outbreak. The
Aquaculture industry is not heavily exposed to international trade, with industry exports accounting
for less than 5% of all seafood exports by value. Nevertheless, declining demand from the domestic
food service sector is anticipated to place downward pressure on prices and revenue for aquaculture
firms. Furthermore, ongoing trade tensions with China could negatively affect sales if China restricts
imports of additional Australian agricultural products after placing restrictions on beef and heavy
anti-dumping tariffs on barley.
Declining domestic demand from the food-service sector has placed downward pressure on seafood
prices, negatively affecting industry revenue. Aquaculture producers without established links to
processors or retailers face moderate risks from reduced demand and prices. For example, oyster
farmers in South Australia have reported difficulty getting their product to market as demand from
food-service businesses has contracted sharply. Salmon producer Huon Aquaculture has reduced its
targeted harvest due to lower demand but anticipates demand to recover in 2020-21. Nevertheless,
a deep and prolonged economic downturn would likely affect aquaculture firms that rely on the
food service sector or have high export exposure to virus-affected countries.

A03 Forestry and Logging: Very High
The COVID-19 outbreak is expected to significantly affect the Forestry and Logging industry. The
2019-20 summer bushfires significantly affected areas designated for timber production, with
ABARES reporting that approximately 8.5 million hectares of forests were likely affected. The
COVID-19 pandemic is anticipated to compound the difficulties faced by forestry and logging
businesses. Lower global economic activity is anticipated to affect demand for timber, creating a
global oversupply and placing downward pressure on the domestic price of timber. Anticipated
declines in new house construction are also forecast to negatively affect timber demand and prices.
However, the Federal Government’s home renovation grants are anticipated to boost demand for
timber products, supporting the industry.
The federal and state governments have announced multiple financial support packages to support
industry firms. In April 2020, the NSW Government announced a $140.0 million package for
agricultural sector firms affected by the bushfires. The Victorian Government has extended Regional
Forest Agreements covering native forest logging until 2030, which has allowed harvesting activity
to continue in the state. In June 2020, the Federal Government announced an additional $86.0
million in funding for forestry businesses to support recovery efforts in bushfire-affected regions.
This funding includes $40.0 million to help timber mills prepare for future wood supply shortages
through innovation and diversification.

A04 Fishing, Hunting and Trapping: Very High
The Fishing industry is the only industry included in this subdivision, and the COVID-19 outbreak
has already had a substantial negative effect on industry revenue. Seafood exports account for over
half of the Fishing industry’s revenue. Rock lobsters are the industry’s largest export item by value,
with over 95% of the catch in Western Australia and South Australia usually destined for China and

COVID-19 Economic Assessment             10 August 2020           www.ibisworld.com.au             13
other Asian countries, while 99% of Queensland’s coral trout is exported to China. Reduced demand
from export markets and food-service businesses has significantly affected rock lobster sales, with
prices falling as producers attempt to sell their catch to other domestic markets. Nevertheless, the
Federal Government’s freight subsidy is supporting continued rock lobster exports. In addition,
exports to other markets, which account for approximately 13% of the Fishing industry’s revenue,
are expected to decline due to COVID-19’s global economic disruption. Overall, as fresh fish and
seafood items are highly perishable, reduced demand and freight availability have significantly
affected commercial fishing operations. Nevertheless, the Federal Government’s International Freight
Assistance Mechanism has supported exports of fresh seafood, bolstering industry revenue.
The COVID-19 outbreak has also significantly affected seafood demand and prices in domestic
markets. In particular, falling demand from restaurants and other food-service establishments
has placed strong downward pressure on prices. In April 2020, Coles announced that it would sell
sashimi-grade tuna typically used by fine-dining restaurants for half the price it would normally
cost at such restaurants. This trend exemplifies the substantial shift in demand and prices for the
Fishing industry’s produce as a result of COVID-19. However, demand is expected to partly recover
as state and territory governments ease restrictions on movement and gatherings across Australia.
In June 2020, the Federal Government announced $4.0 million in funding for a national advertising
campaign promoting Australian seafood in a bid to boost demand.

A05 Agricultural, Forestry and Fishing Support Services: Moderate
Weaker global economic activity is expected to contribute to an oversupply of timber. As a result,
logging and timber processing activity is anticipated to decline over the medium term, limiting
demand for forestry support services. Demand for other agricultural support services, such as
shearing and cropping, will also depend on primary producing and growing activities. The COVID-19
outbreak is forecast to only lightly affect cropping activity over the short term, as producers will
likely proceed with harvesting crops as normal. Cropping activity would only be significantly affected
if farmers reduce future plantings. A similar trend is anticipated for cotton ginning. Farms will still
process current cotton crops in the short term, but may reduce future plantings as global economic
disruption will likely reduce global demand for cotton over the medium term. In July 2020, shearing
contractors reported concerns related to labour shortages as border closures mean that shearers
based in New Zealand will likely be unable to travel for the spring shearing season. This shortage
poses both financial and animal welfare risks for sheep farmers. Shearing activity is anticipated to
decline over the medium term as falling incomes negatively affect global demand for wool.

Mining
B06 Coal Mining: Very High
The COVID-19 outbreak is expected to significantly disrupt demand for the Coal Mining subdivision.
Most black coal mined in Australia is exported, with China and Japan the largest markets, accounting
for approximately 50% of exports. While operators in the Coal Mining subdivision continued to
produce while lockdowns were in place, quarantine measures throughout the global economy are
expected to disrupt supply chains, hinder manufacturing activity and reduce demand for coal. As
a result, global demand for black coal from Australia is anticipated to remain weak in 2020-21,
negatively affecting export prices. Due to weakening demand, metallurgical coal prices fell to a four-
year low in June 2020, with the Office of the Chief Economist forecasting that Australian premium
hard coking coal would average US$126 per tonne over 2020, down almost 30% on the previous
year. Thermal coal producers are anticipated to cut production in response to price weakness.

COVID-19 Economic Assessment             10 August 2020            www.ibisworld.com.au             14
Consequently, revenue in the Coal Mining industry is expected to fall by 6.9% in 2020-21. Some
countries, such as China, may also seek to increase reliance on their own coal production to stimulate
their economy amid a downturn caused by COVID-19. Chinese coal production peaked in March
2020, as the country sought to secure its energy supply while battling the COVID-19 outbreak. On 18
April, the China Coal Transport & Distribution Association called for a 10% reduction in production
volumes to support coal prices and combat an oversupply of coal in the market.
In April, the International Energy Agency predicted that global demand for coal would fall by 8.0%
in 2020. Reduced global manufacturing activity could potentially intensify a supply glut, further
weighing on coal prices. Australian exporters have limited capacity to redirect sales to alternative
markets, particularly given the ongoing shift towards renewable energy sources. With subdued
steelmaking activity in China and India, several buyers are also anticipated to delay shipments. Over
the long term, a significant decline in oil prices associated with the COVID-19 outbreak may cause
demand for coal to decline, as oil and coal are partial substitutes in energy generation.

B07 Oil and Gas Extraction: Very High
The Oil and Gas Extraction subdivision is expected to be heavily affected by the COVID-19 outbreak.
A slowdown in global economic activity is anticipated to reduce demand for both crude oil and
natural gas. The subdivision is heavily exposed to export markets, with exports accounting for over
80% of revenue in a typical year. As a result, weakening global demand has weighed heavily on
prices., with Australian LNG export prices falling to records lows. Due to falling prices, revenue for
the Oil and Gas Extraction industry is anticipated to fall by 7.3% in 2020-21. In response to price
weakness, many industry firms are anticipated to significantly reduce capital expenditure and delay
investment decisions for new projects.
Declining demand for oil led to a breakdown in negotiations between OPEC and Russia. In early
March, both Saudi Arabia and Russia announced plans to significantly increase oil output, amid
declining demand due to COVID-19. Oil prices have since heavily declined, which is expected to
significantly undermine the performance of major oil and gas extraction firms in Australia. On 12
April, OPEC+ agreed to a staged reduction in oil production, starting with a two-month reduction
of approximately 10% (9.7 million barrels a day) from 1 May. OPEC’s oil production fell to its lowest
level in June 2020 since May 1991 during the Gulf War. OPEC+ announced plans to reduce cuts to
7.6 million barrels a day in August in response to stabilising demand conditions. However, global oil
prices will likely remain under pressure due to subdued demand in parts of the world struggling to
contain the COVID-19 outbreak.

B08 Metal Ore Mining: High
The Metal Ore Mining subdivision is expected to be highly affected by COVID-19. Demand for
industrial commodities such as copper, mineral sands and nickel is projected to be subdued. The
disruption of global supply chains is expected to exert downward pressure on manufacturing activity,
lowering prices for these commodities. For example, revenue in the Copper Ore Mining industry is
anticipated to decline by 7.7% in the current year, as output and copper prices decline. Copper prices
fell to a low of US$4,620 a tonne in March 2020. Declining global vehicle sales are also anticipated to
constrain demand for aluminium, negatively affecting some operators in the subdivision. Aluminium
prices have fallen by almost 10% over the year. In Australia, new vehicle sales fell by almost 24% over
the year through May, compared with sales in the previous year.
However, operators in the Iron Ore Mining industry are anticipated to benefit from more severe supply
chain disruptions in other major iron ore producing countries. A decline in steel manufacturing output

COVID-19 Economic Assessment             10 August 2020            www.ibisworld.com.au             15
was forecast for China, which accounts for over 80% of Australia’s iron ore exports. However, as China
has moved to stimulate their economy coming out of COVID-19 lockdowns, steel manufacturing
activity has improved. This coincided with supply disruptions in Brazil, the world’s second largest iron
ore producing country. The COVID-19 outbreak is projected to constrain Brazilian iron ore supply,
providing some relief for Australian iron ore producers over the year. As a result, global iron ore
prices rose by almost 25% in May. According to the Office of the Chief Economist (OCE), Australian
iron ore exports exceeded $100 billion in 2019-20, rising by over 30% on the previous year. Growing
export volumes, high prices and a weak Australian dollar supported iron ore producers over the year.
Precious metals producers will likely benefit from growing investor demand for safe-haven assets.
The price of gold has reached record highs, rising to over $1,900 USD per ounce in July. This rise is
expected to significantly benefit Australian gold miners. As a result, revenue for the Gold Ore Mining
industry is anticipated to increase by 4.8% in 2020-21, as gold production rises. Lower oil prices will
likely exert downward pressure on operating costs, assisting the viability of metal ore miners.

B09 Non-Metallic Mineral Mining and Quarrying: High
The Non-Metallic Mineral Mining and Quarrying subdivision is expected to be highly affected by
COVID-19. Exports of some commodities, such as lithium, will likely be disrupted by the closure or
reduced output of factories across the globe. Other industries in this subdivision, such as the Gravel
and Sand Quarrying industry, have a primarily domestic focus and are therefore less likely to be
directly affected by international trade conditions. However, a slowdown in domestic construction
activity, particularly in the residential sector, is anticipated to affect demand for some operators in
the subdivision. Operators in this subdivision may benefit from domestic spending on infrastructure
projects or initiatives to support residential construction activity, as federal and state governments
seek to support economic activity. For example, the Victorian Government announced a $2.7 billion
infrastructure package and assembled the Building Victoria’s Recovery Taskforce to support activity in
the construction sector during the COVID-19 outbreak and encourage economic activity. Furthermore,
in June 2020, the Federal Government announced plans to fast-track 15 major infrastructure projects
to support Australia’s economic recovery, including the Brisbane-Melbourne inland rail project. The
Federal Government also announced support for the residential construction sector through the
HomeBuilder program, which provides grants for some new homes and renovations. The Diamond
and Gemstone Mining industry may benefit from investors seeking to move wealth from risky assets,
such as stocks, to alternative stores of wealth, such as diamonds. Weak oil prices are expected to
exert downward pressure on operating costs, assisting the viability of firms in this subdivision.

B10 Exploration and Other Mining Support Services: Very High
COVID-19 is expected to have a major impact on mineral and petroleum exploration firms.
Fluctuations in the global prices of commodities such as oil, natural gas and iron ore are expected to
significantly affect this subdivision. In the short term, a decline in commodity prices may discourage
mining firms from investing in exploration. Major oil and gas producers are anticipated to reduce
capital expenditure in response to weak prices. These cuts may also include reducing expenditure
on exploration, which could significantly affect demand for the subdivision. Contract mining service
providers may be hindered in the short term as large mining firms curtail output due to low prices
or place some mines into care and maintenance.Falling global oil prices are expected to significantly
discourage new petroleum exploration expenditure, which may have a large impact on petroleum
exploration firms. The extent of this damage depends on how long oil prices remain low, which will
be determined by the output of foreign oil producers, such as Saudi Arabia and Russia. On 12 April,
OPEC+ agreed to reduce oil production from 1 May, which is anticipated to provide some support
for oil prices in the short term. In May, despite some countries not meeting their reduction targets,

COVID-19 Economic Assessment              10 August 2020           www.ibisworld.com.au              16
You can also read