Reaching higher Rising investment despite uncertainty - Q1 2019 - JLL Indonesia
←
→
Page content transcription
If your browser does not render page correctly, please read the page content below

Asia Pacific Property Digest
Q1 2019

Reaching higher
Rising investment despite uncertainty

13
4
                                                   Office

                                                                           35
                                                   14   Hong Kong
                                                   15   Beijing
                                                   16   Shanghai
                                                   17   Shenzhen
                                                   18   Taipei

Feature                                            19
                                                   20
                                                        Tokyo
                                                        Osaka

Articles
                                                   21
                                                   22
                                                        Seoul
                                                        Singapore          Retail
                                                   23   Bangkok            36   Hong Kong
04   Optimism still prevails despite               24   Jakarta            37   Beijing
     uncertainties                                 25   Kuala Lumpur       38   Shanghai
05   Investors thronging to Asia Pacific’s         26   Manila             39   Shenzhen
     property market                               27   Ho Chi Minh City   40   Tokyo
08   Technology and prosperity drive               28   Delhi              41   Seoul
     office demand in Shenzhen
                                                   29   Mumbai             42   Singapore
09   Fair winds set for 'City of Sails' offices:
                                                   30   Bengaluru          43   Bangkok
     a closer look at Auckland
                                                   31   Sydney             44   Jakarta
10   Multifamily rental housing on the rise
     in Korea                                      32   Melbourne          45   Delhi
11   E-retailers are pushing the store             33   Brisbane           46   Sydney
     frontier in Singapore                         34   Auckland           47   Melbourne
Editor's Note
Real estate investment volume across Asia Pacific in 2019 kicked off to a healthy start, hitting yet another
record high.

Within the office sector, tech companies, professional and financial services firms and flexible space providers
continue to drive demand.

3PL firms and manufacturers remain the strongest sources of industrial leasing demand across most markets.

While in the retail sector, landlords and retailers are having to adapt to keep up with changing market
demands.

For more detail by asset class, view this report online at http://www.jllapsites.com/research/appd-online/.

The Asia Pacific research team hopes that you find this publication valuable, and we welcome your feedback.

                      Thanks,
                      Dr Megan Walters
                      Head of Research – Asia Pacific

49                                    59                                     67
Residential                                                                  Hotels
50
51
      Hong Kong
      Beijing
                                      Industrial                             68    Hong Kong
52    Shanghai                        60    Hong Kong                        69    Beijing
53    Singapore                       61    Beijing                          70    Shanghai
54    Bangkok                         62    Shanghai                         71    Tokyo
55    Jakarta                         63    Tokyo                            72    Singapore
56    Manila                          64    Singapore                        73    Bangkok
57    Sydney                          65    Sydney                           74    Jakarta
58    Melbourne                       66    Melbourne                        75    Sydney
4 – Features

               ASIA PACIFIC ECONOMY

               Optimism still prevails despite uncertainties
               Economic indicators at the start of the year have shown mixed results as concerns about slowing global demand remained
               front and centre against a backdrop of ongoing China-US tensions and geopolitical risks. However, fears of a major slowdown
               appear to have been somewhat overdone. The US economy is expanding at a decent pace, China's growth beat expectations
               in the first quarter, while a change in tone by the US Fed is giving central banks around the world more room to buoy
               economic momentum.

               Exports still under pressure               Looser monetary conditions                 Resiliency through the uncertainty
               Softer Chinese import demand, in           The US Federal Reserve held rates          Though there has been evidence
               particular, is presenting challenges       steady in April, highlighting the shift    pointing to an improvement in the
               for many markets while at the same         to a patient approach to interest          second half of the year, the global
               time a slowdown in segments of the         rates as inflation stays low. The policy   economy is at a delicate period where
               technology industry is adding further      reversal by the Fed along with subdued     downside risks still a present major
               downward pressure, most notably            inflationary pressures have opened         hurdle to momentum—especially
               in North Asia. After a surprising          the door for a more supportive stance      if China-US trade tensions escalate
               jump during March, Chinese exports         by central banks. In China, looser         further and send jitters through
               declined in April which contributed to a   monetary policy has started to slowly      markets. Fortunately, a less restrictive
               flat performance during the first fourth   take effect to the benefit of some,        policy stance by central banks in the
               months of the year.                        albeit any major loosening seems           absence of inflationary pressures
                                                          unlikely barring any major negative        alongside likely expansionary fiscal
               A recent flare up in tensions have seen
                                                          events as the government has shown         measures by some governments
               the US raise tariffs on USD 200 billion
                                                          more willingness to accept slower          should help bolster domestic demand.
               worth of Chinese goods and China
                                                          growth. In the face of risks at home
               has announced counter measures.
                                                          and abroad, the Reserve Bank of India
               Although more negotiations are
                                                          cut its policy rate in April as it seeks
               reportedly planned between the two
                                                          to support the economy and similar
               countries, any reversal in tariffs would
                                                          steps were taken by central banks
               be slow to unwind and this situation
                                                          in Malaysia, New Zealand and the
               will remain a key overhang on global
                                                          Philippines in early May.
               markets until a final deal is signed and
               sealed.
5 – Features
Table 1: Outlook for Major Economies

                                        Real GDP
         Country                     (y-o-y change)                                              2019 Outlook
                                2018           2019F

            China                6.6            6.3    Downward pressure to persist but supportive macro policies should help bolster domestic demand.

                                                       Weak exports and slowing investment to lead to modest growth. Looming GST hike could weigh on
            Japan                0.8            0.5
                                                       consumer spending, although planned government measures may help offset the impact.

                                                       Fiscal stimulus and accommodative monetary policy to help sustain strong growth. Financial sector
            India                7.4            7.0
                                                       challenges to still present headwinds.

                                                       Slowdown in global trade and ICT demand to see sluggish export performance persist. Pick up in
            South Korea          2.7            2.1
                                                       fiscal spending to buoy the economy.

                                                       Government expenditures should help counter downward pressures from subdued consumer
            Australia            2.8            2.2
                                                       spending and a weak residential market.

                                                       Buoyant private consumption and healthy investment growth to underpin steady economic
            Indonesia            5.2            5.0
                                                       momentum.

                                                       Macroeconomic headwinds to weigh on exports and domestic demand. Increased government
            Hong Kong            3.0            1.8
                                                       spending likely to provide some support to growth.

                                                       Exports and manufacturing to face a challenging global backdrop. Fortunately, domestic demand to
            Singapore            3.2            2.3
                                                       be aided by supportive macro policies.

Source: Oxford Economics, May 2019

ASIA PACIFIC PROPERTY MARKET

Investors thronging to Asia Pacific’s
property market
The Asia Pacific region saw a record-setting investment performance in the first quarter underpinned by strength in China—
where volumes more than doubled from a year earlier. The amount of capital seeking exposure to real estate continues to
rise, despite economic and political uncertainty remaining at the forefront. Office leasing volumes, on the other hand, were
impacted by the uncertainty with some MNCs delaying decision making. Despite ongoing concerns about the macroeconomic
environment, underlying commercial property market fundamentals look solid and poised to sustain healthy levels of activity.

Economic uncertainty and low                           Supply volumes pick up although                    Rents move higher across many
vacancy impact leasing volumes                         vacancy generally trends down                      markets
Gross leasing volumes declined 20%                     India and China delivered nearly 60% of            Declining vacancy has bolstered landlords’
year-on-year in Asia Pacific in 1Q. Delhi              all new additions in 1Q, with Bengaluru            position to raise rents in Singapore, with
again was the regional leasing volumes                 alone accounting for a quarter of the              q-o-q growth accelerating in 1Q. Despite
leader, but strong activity levels were                total completions. Jakarta also saw a              a large supply pipeline, Tokyo conditions
also recorded in Tokyo, Bengaluru and                  wave of new supply enter the market to             continued to tilt in favour of landlords
Manila. Occupier demand was relatively                 account for 15% of the 1Q total. Despite a         and rent growth maintained an uptrend.
broad based but financial, professional                healthy volume of completions, vacancy             Relatively balanced supply and demand
services, and tech firms continued to stand            dropped in three-fifths of the tracked Asia        saw Delhi and Mumbai SBD rents edge up,
out. Flexible space providers were still               Pacific markets. The tighter vacancy was           while Sydney recorded a modest q-o-q
expanding aggressively in some markets                 led by markets such as Singapore and               rise in rents with growth dampened by
while focusing on improving centre                     Seoul, which continued to record good              incentives edging up over the quarter. In
occupancy and profitability in others,                 absorption levels.                                 Hong Kong, rents trended higher despite
particularly Mainland China.                                                                              vacancy rising in the overall market as it
still remains at a very low level. Slowing improvement in confidence. In Hong in volumes in China which more than
6 – Features
demand led to a quarterly rental decline Kong, the primary sales market picked up doubled y-o-y. Amongst the other major
in Shanghai, although there was a big momentum over the course of the quarter markets, South Korea maintained its
divergence in performance between as reasonably priced projects piqued momentum from last quarter, increasing
submarkets and buildings. buyers interest. Buying sentiment in 28% y-o-y while Singapore also registered
Singapore continued to be clouded by last a 71% improvement in volumes. The
Capital values rise, albeit at a slower July’s cooling measures as well as lingering combined strength of these markets more
pace global economic uncertainty with sales of than offset declines in Australia, Japan and
Sustained investor interest in tandem with private residential homes remaining tepid. Hong Kong.
rental growth has pushed capital values
higher across many markets. Buoyant Another record performance for The office sector made up half of all
market conditions and optimism about investment volumes transaction volumes, close to the long-
the outlook supported continued growth Real estate investment volumes across term average. Retail and industrial
in Singapore’s capital values. In Tokyo, Asia Pacific kicked off 2019 in a healthy properties made up 18% and 13%
investor expectations and rent growth state, hitting yet another record high for a respectively. Cross-border purchasers
helped lift capital values, holding market first quarter to reach USD 44.9 billion, up stepped up interest in regional real estate
yields stable. The strong investment 14% y-o-y. This is also a 5% increase over with a heavy net purchasing bias. These
demand and healthy fundamentals held the final quarter of last year, which is a cross-border purchasers made up 30% of
Sydney CBD yields flat as they are likely at traditionally strong quarter. total volumes, the highest level in 12 years
a cyclical trough. when compared to annual percentage
This was mainly supported by the spike figures.
Evolving customer demands push
landlords and retailers to adapt
Overall leasing activity continued to be Figure 2: Office Rental & Capital Value Changes, Yearly % Changes, 1Q19
driven by F&B, sportswear, cosmetics and
20
children-related brands in China’s tier 1
markets. Catering to a growing number
of tech-savvy consumers, landlords 15
and retailers maintain a focus on tech-
driven services to enhance the customer 10
experience. Mass market retailers such
as cosmetics, pharmacy and F&B were 5
still the key drivers of demand in Hong
Kong and leasing activity in the core
0
area was again dominated by renewals.
In Singapore, F&B and activity-based
retailers were the most active. Challenging -5
conditions in Australia have seen most
retailers maintain a cautious stance with a -10
focus on existing stores.
ng
e
k
ila
ey
yo
ne
ng
ai
l
i
rta
ba
ou
or
ko
gh
dn
an
k
Ko
ur
iji
ka
um
Se
ap
To
ng
Be
an
bo
M
Sy
Ja
ng
ng
Ba
M
Sh
el
3PLs strong source of logistics
Ho
Si
M
demand Rental Values Capital Values
Manufacturers comprised a significant
Figures relate to the major submarket in each city
portion of demand in Shanghai, while cold Source: JLL (Real Estate Intelligence Service), 1Q19
chain solution providers are also emerging
as a key driver. Robust demand remained
in Tokyo, with labour market shortages Figure 3: Direct Commercial Real Estate Investment 2009-1Q 2019
supporting the movement towards more
technologically integrated and automated 180
industrial facilities. A market where the
160
3PL demand wavered was Hong Kong;
amid the US-China trade tensions, 140
3PLs adopted a wait and see approach.
Consolidation and expansion by 3PL firms 120
underpinned demand in Singapore’s
100
logistics market. Industrial demand
in Sydney and Melbourne remained 1Q 2019
80 $44.9 bill
firm, supported by broadly positive 14% y-o-y
macroeconomic fundamentals. 60
Mixed signals for residential 40
sentiment 20
Mortgage rates in Shanghai for first-time
home buyers continued to fall in 1Q, after 0
dropping for the first time in close to two 2009 2010 2011 2012 2013 2014 2015 2016 2017 2018 2019
years in December 2018. This coupled Japan China Australia Hong Kong South Korea Singapore Other
with a cut in the transaction tax and
stamp duty, helped support a gradual Figures refer to transactions over USD 5 million in office, retail, hotels and industrial.
Source: JLL (Real Estate Intelligence Service), 1Q19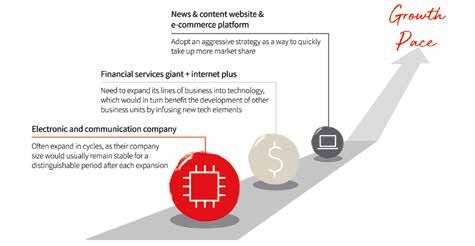
7 – Features
   Figure 4: Rental Property Clocks, 1Q19

    Grade A Office                                                                           Prime Retail

                                                   Beijing                                                         Tokyo*, Auckland       Hong Kong*
                      Hong Kong, Tokyo
                                                                                                                     Beijing
                                                                 Kuala Lumpur                                   Shenzhen                               Wellington
                                                                   Shanghai
                                                                                                           Shanghai

               Sydney                                                                                                                                             Kuala Lumpur
               Taipei
                                 Growth                  Rents                                                           Growth               Rents
          Singapore
 Manila, Melbourne               Slowing                 Falling                                                         Slowing              Falling
                                                                               Guangzhou         Guangzhou,
                                                                                              Jakarta, Manila
              Osaka
Canberra, Wellington             Rents                Decline                 Jakarta                                     Rents              Decline
           Auckland              Rising               Slowing                                                             Rising             Slowing
            Bengaluru,                                                     Shenzhen                     Mumbai,
      Ho Chi Minh City                                                                                   Bangkok
                                                                                                               Delhi
                Bangkok, Delhi
                                                                                                              Bengaluru
                   Adelaide, Chennai                         Seoul                            Melbourne (Regional), Chennai
                    Hanoi, Mumbai, Perth Brisbane                                                                                         Singapore, SE Queensland (Regional),
                                                                                                                                          Sydney (Regional), Seoul*

   Note: Clock positions for the office sector relate to the main submarket in each city.    *High Street Shops/Multi-level High Street

    Prime Residential                                                                        Prime Industrial

                                                   Hong Kong, Manila                                                                      Hong Kong
                                 Bangkok
                    Kuala Lumpur                                 Shanghai                                           Tokyo

                 Guangzhou

                                 Growth                  Rents                                                           Growth               Rents
                                 Slowing                 Falling                                                         Slowing              Falling
                                                                                                 Wellington
Jakarta, Singapore*                                                                          Manila, Sydney
                                                                                                  Auckland
                                                                                                     Beijing
                                  Rents                  Decline                                                          Rents              Decline
                                  Rising                 Slowing                                   Melbourne,             Rising             Slowing
                  Beijing                                                                           Shanghai

                                                                                                          Singapore
                                                                                                     (Business Park)
                                                                                                                       Brisbane
                                                                                                                                          Singapore (Logistics)

   *Luxurious                                                                                *Logistics space (Hong Kong, Shanghai, Beijing, Greater Tokyo)

   Source: JLL, Real Estate Intelligence Service, 1Q19

   Optimism still prevails despite                                   the interest rate environment likely creates
   uncertainties                                                     new opportunities for investors in select
                                                                     markets.
   There is likely to be ongoing pressure in
   the office leasing market as uncertainty
   related to the US-China trade situation
   and slow decision-making from MNCs
   lingers. Nonetheless, the positive long-
   term outlook for the region will continue to
   support underlying demand fundamentals
   and leasing volumes should hold up well.                          About the author
                                                                     Dr Megan Walters joined JLL in 2010 and in October 2016 was
   With a significant weight of capital                              appointed as Head of Research – Asia Pacific. In this role, Megan
   targeting real estate in the region,                              leads a team of 170 professional researchers in the region, which
   investment activity is expected to remain                         forms part of a network of over 400 researchers in 65 countries
   healthy as deleveraging, fund expiries and                        around the globe.
8 – Features
Technology and prosperity drive office
demand in Shenzhen
China’s overall economic growth for 2019 Figure 1: The pace of expansion by technology-driven companies
is expected to slow down mainly due to
headwinds caused by US-China trade tensions
and slower domestic credit growth. Despite
this, Shenzhen, which has been likened to the
country’s Silicon Valley, located in south China,
is anticipated to achieve a better economic
performance. High tech, financial services
and culture-related businesses are to lead
growth and drive the city’s economy. The
latest whitepaper, 'Shenzhen’s Tech Prosperity
Drives Office Demand' published by JLL, offers
an in-depth analysis on the latest trends in
Shenzhen’s fast-evolving office leasing market.
Shenzhen has been a magnet for socio-
economic experiments and technological
innovation since economic reform in 1980s.
Particularly, Shenzhen’s R&D capacity
Source: JLL
increased significantly over the decade.
By 2017, R&D spending accounted for
around 4% of the city’s overall GDP, a of RMB 265 per sqm per month, the highest collaborative. Instead of flooding the office
proportion comparable to that achieved after Beijing and Shanghai. market, the huge upcoming supply will
in tech-oriented countries such as Israel well satisfy a range of space needs, such as
and Finland. Moreover, it is worth nothing The tech industry is among the most active upgrading, expansion and relocation.
that China’s Central Government linked ones exploring expansion options in the
Hong Kong, Macau and 9 Pearl River Shenzhen office market. Demand for office The long-term outlook for the tech industry
Delta cities including Shenzhen into an expansion is supported by the growth of is attractive. Technology will further
integrated economic hub in 2017, namely existing sectors and emergence of new strengthen Shenzhen’s competitiveness,
Greater Bay Area (GBA). It is no doubt that sectors. New businesses proliferate and enabling it to rival global gateway cities
a historic technological sea change in the many companies keep expanding and and regions such as London, New York,
GBA is on the horizon. This will likely see multiply their employee numbers. This and Silicon Valley. Start-ups, particularly
the area play a pivotal role in leading China results in a surging need for larger, more unicorns, and established enterprises
towards its new services and innovation-led standard office environments. in the tech industry will ensure surging
growth model. Indeed, technology and the office demand. Owners and investors are
Technology will shift more innovative advised to evaluate tech companies’ needs
prosperity of Shenzhen’s office market are
business activities from business park to holistically and take advantage of such
interwoven interestingly.
Grade A office buildings, and it will make future growth.
Shenzhen has evolved into the third-largest the typical workplace more productive and
office market in Mainland China in just 15
years. Over the period, Grade A office stock About the author
has grown by eight times to around Silvia Zeng is JLL’s Head of Research for South China, based in
7 million sqm at the end of 2018. Annual net Guangzhou. Having more than 10 years’ experience, Silvia leads our
absorption has jumped by six times during research teams in Guangzhou and Shenzhen, providing real estate
2005-2018. Over the 15-year period, rents research and consulting to our clients.
have soared by 243% to a GFA-based level9 – Features
Fair winds set for ‘City of Sails’ offices: a closer
look at Auckland
“Ladies and gentleman, it is my pleasure if anything. Population growth may be Figure 1: Auckland office transactions
to introduce you to the next big thing in slowing on the back of easing net migration over NZD 5 million
international office investment… in the short term, but the population
please give it up for… AUCKLAND, surge in recent years and a further 37% of $2.5
NEW ZEALAND!” expected future growth by 2043 in Auckland
alone should continue to underpin $2.0
Ok, so perhaps in reality property won’t underlying demand for construction and
ever quite generate the same buzz as a new property.
Billions
stadium tour band, but it isn’t all that $1.5
long ago that New Zealand was tagged The case for international investment
by Paul Bloxham, HSBC’s chief economist in offices has been coming $1.0
for Australia and New Zealand as a “rock Putting two and two together doesn’t
star” economy. In all seriousness though, always equal four, but there has been a very
$0.5
in terms of institutional grade office clear upward trend in the scale of office
investment, Auckland has gone global in investment in Auckland in recent years, so
the last 18 months and is making itself trend conclusions aren’t controversial. We $0
heard. 05 06 07 08 09 10 11 12 13 14 15 16 17 18
track investment sales of in excess of NZD 20 20 20 20 20 20 20 20 20 20 20 20 20 20
5 million and this straightforward graph Source: JLL
And about time too. Invesco (buying
(Figure 1) needs little interpretation in
125Q, Chorus and 50% of the ANZ Centre)
terms of Auckland’s direction of travel.
and Blackstone (the VXV Portfolio) have over 55,000 sqm of high-grade space),
invested over a combined NZD 1.15 Keeping a weather eye on the horizon the pipeline is naturally restricted by land
billion in offices and have, between them, availability and construction cost. This is
But while there are strong winds and
smashed through Auckland’s international creating opportunity.
Auckland is traversing over the waves at
investor glass ceiling. More inflow of
a great rate of knots, it isn’t all likely to be
investment will undoubtedly follow and With such an attractive and dynamic
plain sailing (yes, only one sentence but
yields have naturally sharpened. market from so many different points of the
four nautical clichés). Prime office space
vacancy rates are low – and likely to get compass, Auckland is on the international
Why New Zealand? Why now? radar for very good reason. On balance,
lower – and a shortage of quality space is
In a world where global media headlines our conclusion and forecast is as this blog’s
creating some market imbalance. But, for
have been dominated by economic title suggests, “Fair winds set for ‘City of
investors, that’s a good problem to have.
uncertainty throughout 2018, New Sails’ offices” as our view is investors will
New development takes time and post
Zealand’s economy and property not want to (yes, you’ve guessed it)… miss
Commercial Bay and One55 Fanshawe
investment market has continued to the boat…
Street (both largely pre-let and adding
quietly, confidently and purposefully
propel itself forward with little fuss or
undue self-promotion.
With an official economic growth rate of About the author
2.8% (to year-end December 2018), New Paul Winstanley is Head of Research and Consultancy for
Zealand has outperformed many key JLL New Zealand. With over 20 years of property related
trading partners around the world and experience across the disciplines of valuation, property
2019 should be no different according to management and strategic consulting, he is also a
commentator forecasts. The investment specialist in residential investment at scale and mixed-use
case for New Zealand at a structural level developments. He is a Fellow of RICS.
remains strong and robust, and more so10 – Features
Multifamily rental housing on the rise in Korea
Like most Asian markets where individuals allocation in the residential market are maintenance services, 24/7 security service,
prefer to reside in owner-occupied houses driving these institutional investors to tap as well as having more appealing amenities
rather than in rental homes, Korea’s into the sector. and communal spaces.
residential real estate market has been
dominated by individual ownerships. Demographic shifts drive demand To add, the national and city government
Due to this, developers and construction From a demand perspective, millennials has recently raised the stake for investors by
companies in Korea have been preoccupied have been a strong driving force behind launching initiatives to introduce enterprise
with selling lots to owners prior to rental housing. Unlike the older generation, managed rental housing – “Newstay” and
construction. This is one of the reasons why millennials in Korea do not perceive home “2030 Youth Housing”. Even though there
multifamily rental properties, operated by ownership as a requirement. The younger are restrictions such as on rental escalations,
real estate companies, never fully emerged generation are gravitating towards rental these government schemes offer benefits
until recently. housing more than ever due to high ownership such as higher floor area ratio, reduction
costs along with the rise of single family in tax, and financial support. Following the
Players tapping into multifamily households. announcement of these schemes, several
Multifamily rental housing is gaining traction special asset managers were created to
from conglomerates and developers such Apart from demographic shifts, the demand work on government backed residential
as Lotte, KT and KT&G. Many of these for institutionally managed multifamily development projects.
players are drawn to this segment as they assets can be attributed to the fact that
young people prefer enterprise run rental Just like the logistics sector, the multifamily
are seeking greater efficiencies from their
housing models over other residential sector is still in its infancy stages and
existing real estate portfolios. They do this
formats such as officetels (office and hotel vastly underrepresented in the real estate
by renovating old retail venues or unused
mix) and studio apartment complexes portfolios managed by financial institutions
sites for residential projects. Simultaneously
as each unit is owned and managed and investors. However, robust market
prominent investors such as GIC, Koramco,
individually. In officetels, many services are fundamentals, keen interest from investors
and IGIS have recently established their
often rendered poorly by individual owners and developers, and recent government
foothold in the segment by making notable
whereas tenants living in institutionally support signals a bright future ahead for this
bets on residential projects in Korea. Tight
owned multifamily homes tend to be more sector.
competition in other real estate asset
classes, low vacancy risk and massive under satisfied with building management and
About the author
Jisoo Hong is a Research Analyst based in Seoul. Jisoo is responsible
for data collection, quarterly office presentations, tenant surveys,
and writing the Seoul office and retail reports for JLL's Korea Property
Digest.11 – Features
E-retailers are pushing the store frontier
in Singapore
Just over a year since the opening of its customers can try its collections in-store. gift bar and a café. Naiise has two other
4,603-sq ft flagship store at the heart of The store houses an expanded range of stores at Wisma Atria and I12 Katong.
Singapore’s shopping belt area in 313@ product offerings from a curated selection
Somerset, local online fashion retailer of lingerie brands including Perk by Kate, One landlord is the first mover on this shift
Love Bonito, opened a 3,555-sq ft store at Eberjay, Timpa, Addiction Lingerie and to physical retail. CapitaLand recently
JEM. The move was to expand the physical Commando. established a 11,000-sq-ft “phygital”
platform to promote customer awareness multi-label concept store, NomadX at Plaza
and facilitate connection with customers. E-retailers are discovering that online Singapura, which offers plug & play retail
The stores allowed its female fans to attend platforms have become extremely units, available on a short lease, to enable
workshops and for trained staff to advise competitive and more saturated as niches online retailers to have an in-store presence
customers on the appropriate style and are rapidly becoming filled. In an effort to to trial new concepts and products and to
right fit for various body types, with the drive growth and expand market share, respond to customer feedback in a cost-
overall aim of building new and repeat e-retailers are making a stronger push in efficient way. The units are integrated with
business. the physical store frontier, particularly smart technologies to encourage product
in the Orchard shopping belt and the discovery by customers and to enhance
Similarly Reebonz, a Singapore-based suburban malls in Singapore. Their aim is the shopping experience. Alibaba’s Taobao,
e-commerce luxury retailer, established a to build brand equity and enhance sensory alongside other e-fashion businesses
physical showroom and store for product experience to differentiate from their including Digital Fashion Week, evenodd,
display and arrangements of private competitors. Révolte and Style Theory, has embraced
viewings to gain customer trust and to this concept, establishing their first physical
reduce friction to purchasing higher value Not just limited to fashion, homegrown outlets in Singapore at NomadX.
luxury goods online. Currently, Reebonz multi-label online design retailer, Naiise,
offers private viewings of select premium has similarly established physical stores As more e-retailers experiment with
items via appointment at a showroom in to build brand equity and experience and blending the convenience of online retailing
the head office at Tampines in Singapore, to drive retail revenue. Recently, Naiise with sensory experiences in physical stores
as well as operating a store in Sydney. expanded its physical presence to include to differentiate from competitors, more
a 9,000-sq ft retail showcase at Design online brands will emerge in the physical
Recently, local online lingerie retailer, Orchard which will be launched in May world. This shift will benefit the physical
Perk by Kate, opened its first 330-sq ft 2019, as well as a new concept store at real estate world.
physical store at Telok Ayer Street, where Jewel@Changi, offering a fully customised
About the author
Angelia Phua is a Director for JLL, based in Singapore. She guides a
team of analysts in undertaking consultancy projects, including real
estate market studies, highest and best use studies and planning
studies. She oversees research in the retail sector in Singapore and is
involved in strategic research work.Proptech.
It’s changing our homes, work and cities.
Start-up funding for proptech in Asia Pacific
will reach US$4.5 billion in 2020.
How will it change your life?
We’ve done the research. Download
Clicks and Mortar:
The Rising Influence of Proptech at –
access.jll.com/proptech-report-2017Office
Hong Kong
                                    “Vacancy rates creep
                                    higher as demand for
                                    Grade A offices slows.”
14 – Office

                                                                                                                                              sq ft per month,                  Stage in Cycle
                                    Denis Ma, Head of Research,                                       Rental Growth Y-O-Y
                                           Hong Kong                                                        8.1%
                                                                                                                                            net effective on NLA                Growth
                                                                                                                                            HKD 130.1                           Slowing

               Financial Indices                                                                  Office market posts negative net absorption in 1Q19
                                                                                                  •     Weak demand led to the occupier market contracting by 217,500 sq ft in
                             170
                                                                                                        1Q19, recording negative net absorption for the first time since 2Q17. The
                             160                                                                        vacancy environment in the city's core-area markets led to the bulk of leasing
                             150                                                                        requirements being met in decentralised locations.
                             140
                                                                                                  •     Supermarket chains ALDI and WM Morrison became the latest companies
                             130                                                                        to relocate their offices to Kowloon East, taking advantage of the higher
              Index

                             120                                                                        availability of space in the submarket. In both instances, the moves were
                             110                                                                        underpinned by lower rents on offer and the opportunity to consolidate
                             100                                                                        multiple offices under the one roof.
                              90                                                                  FY2019/20 Land Sale Programme to deliver 8.8 million sq ft
                              80
                               4Q14       4Q15        4Q16    4Q17       4Q18       4Q19
                                                                                                  •     Chinachem’s One Hennessy in Wanchai and LVGEM’s NEO in Kwun Tong were
                                      Rental Value Index      Capital Value Index                       issued with occupation permits and were major contributors to the overall
                                                                                                        vacancy rate increasing to 4.8% in 1Q19.
               Arrows indicate 12-month outlook
               Index base: 4Q14 = 100                                                             •     The government released its FY2019/20 land sale programme, which includes
               Financial Indicators are for Central.                                                    seven commercial/hotel sites capable of providing a total GFA of up to 8.8
               Source: JLL
                                                                                                        million sq ft. The list also includes the highly anticipated site above the West
                                                                                                        Kowloon Terminus of the Hong Kong-Shenzhen-Guangzhou High Speed Rail
               Physical Indicators                                                                      Link.

                             350                                                    7             Rental values advance even as leasing demand slips
                             300                                                    6
                                                                                                  •     The slight rise in vacancy failed to dent the negotiating positions of landlords
                                                                                                        with overall rentals growing 0.9% q-o-q in 1Q19. A relatively quiet strata-titled
                             250                                                    5                   sales market, on the other hand, led to capital values trending down by 0.4%
              Thousand sqm

                             200                                                                        q-o-q in 1Q19 as vendors softened on asking prices.
                                                                                    4
                                                                                        Percent

                             150
                                                                                    3             •     PAG has reportedly acquired Mapletree Bay Point in Kwun Tong from Mapletree
                             100                                                                        Investments for HKD 8.58 billion (HKD 12,994 per sq ft). This is the second-
                                                                                    2
                              50                                                                        highest transaction ever recorded in the submarket after LVGEM’s HKD 9.0
                               0                                                    1                   billion acquisition of 8 Bay East in 2017.
                              -50                                                   0
                                      14     15      16      17     18      19F                   Outlook: Rents to grow in 2019, albeit at a slower pace
                                       Take-up (net)              Completions                     •     Though vacancy rates are expected to continue to rise they still remain below
                                       Future Supply              Vacancy Rate                          the critical point where landlords will adjust their rental expectations. As
                                                                                                        such, we still expect rents to grow 0-5% in 2019 though downside pressure is
               For 2014 to 2018, take up, completions and vacancy rates are year-end
               annual. For 2019, take-up, completions and vacancy rate are as at 1Q19,                  expected to gradually increase over the course of the year.
               while future supply is for 2Q19 to 4Q19.
               Physical Indicators are for the overall market.                                    •     Along with the potential for higher borrowing costs and weakened sentiment,
               Source: JLL                                                                              capital values are forecast to retreat in the range of 5-10% over the next 12
                                                                                                        months as investors demand higher yields to cover these risks.

                                                                                                  Note: Hong Kong Office refers to Hong Kong's overall Grade A office market.
Beijing
“IT companies remain active
amid economic uncertainty,
but are taking a more
15 – Office
Stage in Cycle
conservative approach.”
Rental Growth Y-O-Y sqm per month,
3.1%
net effective on GFA Rents Mi Yang, Acting Head of Research,
RMB 398 Stable Beijing
Demand picks up slightly, but IT expansion activity slows Financial Indices
• Demand picked up slightly in 1Q19, but rental budgets across sectors were 150
noticeably lower than recent quarters. As such, overall demand failed to meet
landlord expectations, causing destocking to occur at a slower pace. 140
• Supported by favourable policies, the IT sector continued to expand, but 130
at a more conservative pace than in previous quarters. Due to heightened 120
Index
economic concerns, some tenants reduced rental budgets, putting
expansions plans from end-2018 on hold. 110
100
No new projects complete in the quarter
• No new projects were completed in 1Q19, benefitting landlords under 90
increased pressure to fill vacant spaces in the slower economic climate. Great 80
Wall Financial Centre in Lize was delayed from entering the market in the 4Q14 4Q15 4Q16 4Q17 4Q18 4Q19
quarter as infrastructure projects remained incomplete. Rental Value Index Capital Value Index
• The overall vacancy rate was stable at 4.7%. With IT demand strongest in Arrows indicate 12-month outlook
Index base: 4Q14 = 100
Zhongguancun, the submarket recorded a further decrease in vacancy as the Financial Indicators are for the CBD.
rate dipped to 0.8%, nearing its historic low (0.5%). Source: JLL
Rents hold steady despite tenants’ lower rental budgets
• As tenants exhibited lower rental budgets under the current economic Physical Indicators
environment, most landlords waited for tenants with larger budgets and/
1,000 8
or pedigrees; they preferred to hold out for quality tenants with higher
900
affordability rather than filling remaining vacancies more quickly, leading to 7
800
flat rental growth (-0.2% q-o-q). 6
700
Thousand sqm
• Domestic IT giants were active: JD.com transacted a project in Zhongguancun 600 5 Percent
and plans to convert it into an incubator, while a nearby project was said 500 4
to be under negotiation – for the same purpose – by ByteDance. The 400 3
low-vacancy and high-rent office market has led some rapidly expanding 300
2
companies to purchase entire buildings in order to meet their requirements. 200
100 1
Outlook: CBD Core Area faces further risk of delay 0 0
14 15 16 17 18 19F
• Due to ongoing infrastructure challenges, the CBD Core Area faces further risk Take-up (net) Completions
of delay. But select landlords are pursuing project-level solutions to counter Future Supply Vacancy Rate
pending delays, committed to opening in 2019.
For 2014 to 2018, take-up, completions and vacancy rates are year-end
• TMT companies are expected to be the dominant source of leasing demand annual. For 2019, completions, take-up and vacancy rates are as at
1Q19, while future supply is for 2Q19 to 4Q19.
for the Grade A leasing market in 2019. But as more firms work with lower Physical Indicators are for the overall market.
rental budgets, the Grade B market may attract an increasing number of Source: JLL
TMTs, particularly as comparatively large amounts of lettable space remain
available.
Note: Beijing Office refers to Beijing’s overall Grade A office market.Shanghai
“Emerging submarkets
outperform in terms of leasing
activity.”
16 – Office
sqm per day, Stage in Cycle
Daniel Yao, Head of Research, Rental Growth Y-O-Y
China 1.0%
net effective on GFA Rents
RMB 10.4 Falling
Financial Indices Leasing activity stays strong in emerging Qiantan and Xuhai Bund
• Leasing demand softened in 1Q19 in the traditional CBD as concerns about a
140
slowing economy led to tenants becoming increasingly cost-sensitive. In the
130 Pudong CBD, net take-up declined due to the rising competition from emerging
areas. In the Puxi CBD, demand was stable and mainly driven by professional
120 service firms and retailers.
• The decentralised market continued to see strong demand, with strong net take
Index
110
up of 133,000 sqm in 1Q19. Emerging CBDs such as Qiantan and Xuhui Bund have
100 attracted strong interest from healthcare, TMT, and manufacturing firms seeking
cost saving and expansion opportunities.
90
Two projects add 228,900 sqm
80 • Gubei SOHO delivered 57,851 sqm, leading Puxi CBD vacancy to rise 0.7
4Q14 4Q15 4Q16 4Q17 4Q18 4Q19
percentage points (ppts) to 10.1%. Pudong CBD vacancy increased 0.8 ppts q-o-q
Rental Value Index Capital Value Index
to 12.9%, as several large tenants relocated to the decentralised locations to save
Arrows indicate 12-month outlook costs or move into self-use projects.
Index base: 4Q14 = 100
Financial Indicators are for the CBD. • In the decentralised market, The Gate reached completion with a total GFA of
Source: JLL
171,000 sqm. Despite of the large amount of new space, strong demand kept the
vacancy rate flat at 23.3%.
Physical Indicators Greater divergence in building-level performance
700 12 • Slowing demand has led rents to decline in 1Q19. Pudong CBD rents decreased
by 1.4% q-o-q and Puxi CBD rents edged down by 0.5% q-o-q. Rents were
600 10 relatively stable in the decentralised market. The market saw a greater divergence
500 in performance, not just between submarkets, but even between individual
8
Thousand sqm
buildings in the same submarket.
400
Percent
6
300
• Foreign investors are actively seeking opportunities to increase their capital
4 allocations to China, taking advantage of the current window in which the
200 domestic financing environment remains tight.
100 2
Outlook: Decentralised take-up to continue to be strong
0 0
14 15 16 17 18 19F • While there will be no new supply in the Pudong CBD in 2019, available space
Take-up (net) Completions in existing projects combined with competition from decentralised areas is
Future Supply Vacancy Rate likely to cause landlords more negotiable on rental terms. In the Puxi CBD, asset
performance is expected to further diverge in the face of rising competition.
For 2014 to 2018, take-up, completions and vacancy rate are year-end
annual. For 2019, take-up, completions and vacancy rate are as at 1Q19, • In the decentralised market, new stock is expected reach 1.3 million sqm in 2019,
while future supply is for 2Q19 to 4Q19.
Physical Indicators are for the CBD. 76% higher than last year. Despite the surge in new additions, rents are expected
Source: JLL to stay flat due to strong demand, which is mainly driven by fast-growing TMT
firms along with CBD tenants that have large size requirements.
Note: Shanghai Office refers to Shanghai’s overall Grade A office market, consisting of Pudong, Puxi and
decentralised areas.Shenzhen
“The issuance of the GBA’s
master blueprint will inject
new opportunities in the
17 – Office
Stage in Cycle
city.”
Rental Growth Y-O-Y sqm per month,
-4.5%
net on GFA Decline Silvia Zeng, Head of Research,
RMB 274 Slowing South China
Sentiment recovering along with stabilisation of the economy Financial Indices
• Overall sentiment has improved in 1Q19 with an increase of inquiries on the 120
leasing market. Due to the credit market easing, directly affected industries
115
such as banking and finance were particularly active in 1Q19.
110
• With the Greater Bay Area's (GBA) pro-development and financial reform
105
policies through reinforcing internationalisation, Shenzhen has become a
Index
global anchor by attracting overseas companies. Amazon and BCG both 100
signed new leases in 1Q19. 95
A small uptick in vacancy with four new completions 90
• New additions in Shenzhen have been consistent with four new completions 85
in 1Q19, which covered a total of 282,000 sqm. Half of the completions are 80
located within the Nanshan area. 4Q14 4Q15 4Q16 4Q17 4Q18 4Q19
Rental Value Index Capital Value Index
• Overall vacancy rates edged up slightly by 1.3 percentage points to 16.0% in
1Q19, due to the fact that newly completed buildings were still in the phase of Arrows indicate 12-month outlook
Index base: 4Q14 = 100
leasing out their inventories. Financial indicators are for Futian.
Source: JLL
Rising capital values stimulated by easing credit market
• The existing landlords in Futian substantially lowered their rents in order to
attract more tenants, while other districts also experienced rental declines. Physical Indicators
Therefore, the overall rental value decreased by 2.4% compared to last
2,000 18
quarter.
1,800 16
• Due to the relaxation in domestic credit supply and liquidity injection, the 1,600 14
lower financing cost has boosted investors’ confidence. The highest historic 1,400
12
Thousand sqm
transacted price was recorded in Shenzhen, as the OCT Tower with a GFA of 1,200
10
Percent
150,754 sqm was purchased by China Life. 1,000
8
800
Outlook: Rents edge down as incoming stock drives up vacancy 600 6
400 4
• The issuance of the GBA’s Outline Development Plan will likely stimulate
200 2
demand, signalling a less pessimistic outlook. Whereby, the easing of the
0 0
credit market should help boost confidence further to recover the leasing and
14 15 16 17 18 19F
sales activities. Take-up (net) Completions
• Nevertheless, over the short term, rents are expected to edge down over the Future Supply Vacancy Rate
next 12 months as a significant volume of future office supply will likely drive For 2014 to 2018, take up, completions and vacancy rates are year-end
up vacancy and lower the overall rental value. annual. For 2019, take-up, completions and vacancy rate are as at 1Q19,
while future supply is for 2Q19 to 4Q19.
Physical Indicators are for the overall market.
Source: JLL
Note: Shenzhen Office refers to Shenzhen's overall Grade A office market.Taipei
“Limited availability of
stock drives rental growth.”
18 – Office
Jamie Chang, Head of Research, ping per month, Stage in Cycle
Rental Growth Y-O-Y
Taiwan net on GFA Growth
1.7% NTD 3,316 Slowing
Financial Indices Occupier demand focuses on space released in 2018
• As newly completed buildings reach full occupancy and no new additions
130
are planned, new leases in 1Q19 mainly derived from space released from
tenant upgrade and relocation activity. Only small lease deals were seen in the
120 remaining space in the new buildings.
• The quarterly net absorption was recorded at 7,638 ping, which was slightly
higher than the average of past ten first-quarters. The overall vacancy continued
Index
110
to drop by 1.0 percentage point to 4.4%.
100 Supply pipeline is limited with no significant additions expected
• No new supply was delivered to the office market in 1Q19.
90 • Only one new project is expected to enter the market this year providing 4,272
4Q14 4Q15 4Q16 4Q17 4Q18 4Q19 ping of lettable space.
Rental Value Index Capital Value Index
Arrows indicate 12-month outlook
Limited availability of stock fuels rental growth
Index base: 4Q14 = 100 • Decreasing vacancy, limited availability of space and leases closed on higher
Financial Indicators are for Xinyi.
Source: JLL floors of remaining space in new buildings pushed the overall rent upwards.
The average rent increased 0.9% to NTD 2,753 per ping per month.
• Overall yield and capital value remained flat as investment activity slowed.
Physical Indicators Quarterly direct real estate transactions totalled NTD 14.7 billion, which is
slightly lower than the average of the past 10 first quarters. Conversely, total
250 12
land transactions was recorded at NTD 41.6 billion, the highest single-quarter
10 figure on record.
200
8 Outlook: Robust leasing demand and land investment ahead
Thousand sqm
150
Percent
6
• After the large influx of office supply and large-scale take-up in 2018, as well
100
as the absence of new large-scale additions over the next four years, limited
4 space availability is likely to foster more significant rental growth. The growth
50 is projected to be around 3% this year and is expected to increase even more
2
rapidly thereafter.
0 0 • Investors from a variety of business sectors have continued to channel their
14 15 16 17 18 19F
funds to real estate in order to retain monetary value. As available en-bloc
Take-up (net) Completions
Future Supply Vacancy Rate
properties with decent returns are limited, funds are likely to flow to alternative
property niches and private-and-public partnership projects.
For 2014 to 2018, take-up, completions and vacancy rate are year-end
annual. For 2019, take-up, completions and vacancy rate are as at 1Q19,
while future supply is for 2Q19 to 4Q19.
Physical Indicators are for the overall market.
Source: JLL
Note: Taipei Office refers to Taipei’s overall Grade A office market.Tokyo
“Office leasing market
sees strong forward
commitment rates.”
19 – Office
tsubo per month, Stage in Cycle
Rental Growth Y-O-Y Takeshi Akagi, Head of Research,
4.4%
gross on NLA Growth Japan
JPY 38,719 Slowing
Robust demand leads to strong pre-commitment Financial Indices
• According to the Tankan Survey in March, the business sentiment of large 150
manufacturers was 12 points, 7 points lower compared with the previous
survey in December, reflecting a deceleration in overseas economies. The 140
business sentiment of large non-manufacturer also declined by 3 to 21 points,
a relatively modest deterioration. 130
Index
• Net absorption in 1Q19 totalled 125,000 sqm, increasing slightly compared 120
with the previous quarter. Given the limited space in existing buildings, robust
demand coming from the information and communication, professional 110
services and financial services sectors has been absorbing future supply.
100
Vacancy rate continues to reflect 1% 90
• New supply totalled 127,000 sqm in 1Q19, increasing the total stock by 1% 4Q14 4Q15 4Q16 4Q17 4Q18 4Q19
q-o-q and 7% y-o-y. Four buildings, including Nihonbashi Muromachi Mitsui Rental Value Index Capital Value Index
Tower (NLA 67,000 sqm), Shibuya Solasta (NLA 28,000 sqm) and Abema Arrows indicate 12-month outlook
Towers (NLA 19,000 sqm), entered the market. Index base: 4Q14 = 100
Source: JLL
• The vacancy rate stood at 1.0% at end-1Q19, remaining flat q-o-q and
decreasing 170 bps y-o-y. While vacancy tightened in Akasaka/Roppongi,
increases were recorded in the submarkets of Otemachi/Marunouchi.
Physical Indicators
Rent and capital value growth continues
700 5
• Rents averaged JPY 38,719 per tsubo per month at end-1Q19, increasing
1.4% q-o-q and 4.4% y-o-y. Rental growth was in line with that of the previous 600
4
quarter, driven primarily by Shibuya and Akasaka/Roppongi. 500
Thousand sqm
• Capital values increased 1.9% q-o-q and 8.8% y-o-y in 1Q19. Growth was 400 3
Percent
driven by rental increase across submarkets. Cap rates were stable. Grade A
300
transactions in the quarter included Dai-ichi Life Group-led joint acquisition 2
of a portion of Toranomon 2-chome Project Office Tower, due in 2023 for an 200
undisclosed price. 1
100
Outlook: Rental growth to slow; capital value growth to quicken 0 0
14 15 16 17 18 19F
• According to Oxford Economics, Japan’s real GDP is forecast to grow by Take-up (net) Completions
0.7% and the CPI is likely to rise by 0.9% in 2019. Rising trade tensions and Future Supply Vacancy Rate
uncertainties in the global economy remain as downside risks.
For 2014 to 2018, take up, completions and vacancy rates are year-end
• Upcoming supply to be delivered in 2019 and 2020 is equivalent to 130% and annual. For 2019, take-up, completions and vacancy rate are as at 1Q19,
while future supply is for 2Q19 to 4Q19.
200% of the previous 10-year average. However, demand has been catching Source: JLL
up, absorbing the incoming stock up to 2022. As such, rise in vacancy shall
be limited and we expect to rental growth. Further rent growth and cap rate
compression shall accelerate capital value growth.
Note: Tokyo Office refers to Tokyo's 5 Kus Grade A office market..Osaka
“Historically low vacancy
rates and expanding
investment market.”
20 – Office
tsubo per month, Stage in Cycle
Yuto Ohigashi, Director - Research, Rental Growth Y-O-Y
Japan 11.2%
gross on NLA Rents
JPY 21,437 Rising
Financial Indices Net absorption picks up amid limited supply
• According to the March Tankan survey for Greater Osaka, the business
260
sentiment index for large manufacturers was 8 points, decreasing by 9 points
240 q-o-q on the back of the slowdown in overseas economies. The index for non-
220 manufacturers was 13 points, a decrease of 6 points q-o-q.
200
• Net absorption totalled 11,000 sqm in 1Q19, a pick-up from the negative net
Index
180 absorption recorded in 4Q18. Healthy demand came from information and
160 communication, education and real estate sectors, amid extremely limited
140 available stock. This was reflected in a sub-3% vacancy trend for nine-
120 consecutive quarters.
100 Vacancy rate reflects virtually no vacancy in the market
80
4Q14 4Q15 4Q16 4Q17 4Q18 4Q19
• No new supply entered the market in 1Q19, with none scheduled for the rest of
the year.
Rental Value Index Capital Value Index
Arrows indicate 12-month outlook • The vacancy rate stood at 0.5% in 1Q19, decreasing 60 bps q-o-q and 50 bps
Index base: 4Q14 = 100 y-o-y, marking the third-lowest level since JLL started tracking in 2004. The
Source: JLL decrease in part reflected the take-up at a building in Namba, which was
completed in the previous year.
Physical Indicators
Double-digit rental growth for fourth-consecutive quarter
• Rents averaged JPY 21,437 per tsubo per month in 1Q19, increasing 3.6% q-o-q
160 9 and 11.2% y-o-y. Rental growth accelerated for the second-consecutive quarter
140 8 amid robust demand and extremely limited supply.
120 7 • Capital values grew 5.1% q-o-q and 25.8% y-o-y, marking the 22nd-consecutive
6 quarter of growth. Cap rates were stable in 1Q19. Notable transactions in the
Thousand sqm
100
Percent
5 quarter included the acquisition of Sankei Real Estate (J-REIT) of a portion of
80
4 Breeze Tower for JPY 8.6 billion or at an NOI cap rate of 4.7% upon its listing in
60
3 March.
40 2
20 1
Outlook: Rent and capital value growth to continue
0 0 • Although economic growth for Osaka is expected to be limited in 2019 amid
14 15 16 17 18 19F global headwinds; however, underlying demand for Osaka's office sector is
Take-up (net) Completions expected to remain healthy.
Future Supply Vacancy Rate
• With no new completions scheduled in 2019, net absorption should remain
For 2014 to 2018, take up, completions and vacancy rates are year-end constrained by the lack of available space. Vacancy rate shall remain at very
annual. For 2019, take-up, completions and vacancy rate are as at 1Q19,
while future supply is for 2Q19 to 4Q19. low levels and underpin positive rent growth momentum. Capital values should
Source: JLL also rise, reflecting rent growth and further compression of cap rates.
Note: Osaka Office refers to Osaka's 2 Kus Grade A office market.Seoul
“Yeouido and Gangnam
record positive net
absorption; CBD records
21 – Office
Stage in Cycle
negative net absorption.”
Rental Growth Y-O-Y pyung per month,
0.5%
net effective on GFA Decline Sungmin Park, Head of Research,
KRW 91,665 Slowing Korea
Demand for Gangnam shows strong net take-up Financial Indices
• Overall net absorption recorded 20,530 pyung, with positive take-ups in 120
Yeouido and Gangnam. Hyundai Auto Ever signed a lease with Luceen Tower
in Gangnam at around 5,300 pyung to consolidate. Mirae Asset Life Insurance
entered a large-size lease (around 2,800 pyung) with GT Tower. In Yeouido IFC
signed leasing deals with Biersdort, BFIN and P&G. 110
Index
• Samsung Life Taepyungro in CBD secured a large-scale contract with Boram.
However, net absorption for CBD reverted to negative territory because
Kumho and Hyundai Engineering scaled back their existing occupied spaces. 100
Vacancy decreases with decent take-up in Gangnam
• Seoul's vacancy rate dropped to 11.5% with a solid take-up. Gangnam saw the 90
largest take-up as vacancy decreased to 4.6% with a strong take-up occurring 4Q14 4Q15 4Q16 4Q17 4Q18 4Q19
at key Grade A buildings such as Gangnam N Tower, GT Tower and the ASEM Rental Value Index Capital Value Index
Tower. Arrows indicate 12-month outlook
Index base: 4Q14 = 100
• No new Grade A supply came online during the quarter. Financial Indicators are for the CBD.
Source: JLL
Rental performance is stable in 1Q19
• Seoul's rents in 1Q19 increased 0.6% q-o-q, as many landlords at Yeouido
and Gangnam raised headline rents at the start of the year. CBD rental Physical Indicators
performance continued to be weak with a slight uptick in rent-free period,
300 14
although net rent increased.
250 12
• The largest deal concluded during 1Q19 was NH Investment’s acquisition of
Seoul Square in CBD for KRW 988.2 billion. Another notable transaction was 200
10
Thousand sqm
the Samsung SDS Tower West Campus in Jamsil for KRW 628 billion by Ryu 8
Percent
Kyung PSG Asset Management. 150
6
Outlook: Net absorption and rental growth to be stable 100
4
• Overall net absorption is expected to be moderate, to some extent. With 50 2
an economic slowdown and tight space coupled with limited stocks, the
Gangnam submarket should experience slower take-up. The strong leasing 0 0
14 15 16 17 18 19F
momentum should continue for the Yeouido submarket but is likely to lose Take-up (net) Completions
some steam later in 2019. Future Supply Vacancy Rate
• Rental growth is likely to soften, amid sticky vacancies and new supplies For 2014 to 2018, take up, completions and vacancy rates are year-end
for CBD and Yeouido. Meanwhile, with low vacancy and limited stocks, annual. For 2019, take-up, completions and vacancy rate are as at 1Q19,
while future supply is for 2Q19 to 4Q19.
coupled with strong underlying demands, Gangnam should continue to see a Physical Indicators are for the overall market.
contraction in rent-free periods, translating into a decent rental performance Source: JLL
down the line.
Note: Seoul Office refers to Seoul’s Grade A office market.Singapore
“Grade A CBD rents soar
past recent peak to reach
a decade-high as demand
22 – Office
and supply diverge.” Stage in Cycle
Rental Growth Y-O-Y sq ft per month,
Tay Huey Ying, Head of Research,
12.5%
gross effective on NLA Growth
Singapore SGD 10.6 Slowing
Financial Indices Singapore remains an attractive office location
130
• The leasing market stayed abuzz with enquiries from a wide range of industries
such as financial institutions, technology and business services companies.
They comprise a mix of new entries, expansions and renewals.
120
• Corporates remained keen to set up offices in Singapore as evidenced by Dyson’s
110 decision to relocate its headquarters from Britain to Singapore. The Indonesian
Index
government also announced plans to open a new office in Singapore to attract
100 even more investment from its neighbours and top investment sources.
90
Vacancy approaches frictional level amid stock contraction
• 18 Robinson and Anson House’s conversion of a car park floor to office space
80 received temporary occupation permits (TOPs) in 1Q19. As the withdrawal of
4Q14 4Q15 4Q16 4Q17 4Q18 4Q19 space in Chevron House for refurbishment exceeded these completions, the
Rental Value Index Capital Value Index overall Grade A CBD stock contracted in 1Q19. No further completions are
Arrows indicate 12-month outlook expected in the rest of 2019.
Index base: 4Q14 = 100
Financial Indicators are for the CBD. • Firm demand amid stock shrinkage led to vacancy rates inching down,
Source: JLL approaching frictional level in 1Q19.
CBD Grade A rents soar past recent peak to reach a decade high
Physical Indicators • The creeping down of vacancy towards a frictional level has emboldened
landlords to be aggressive in terms of asking rents. This has brought about an
250 12
acceleration in quarter-on-quarter growth in rents, pushing them past the recent
10 peak to a 10-year high.
200
8 • The relentless rise in rents amid limited stock kept investors upbeat about the
Thousand sqm
150 office sector, underpinning another quarter of growth in capital values.
Percent
6
100 Outlook: 2019’s rent growth could match or even exceed 2018’s
4
• The recently announced CBD incentive scheme that awards 25-30% more plot
50 2 ratio for the conversion of eligible office assets in selected areas primarily in
the Shenton Way submarket, to mixed use, has raised the possibility of more
0 0
14 15 16 17 18 19F withdrawals for redevelopment.
Take-up (net) Completions • The prospects of further stock withdrawal could place landlords in an even
Future Supply Vacancy Rate
stronger position in lease negotiations, thus giving rents more upside than before.
For 2014 to 2018, take-up, completions and vacancy rates are year-end It could also slow down the growth of CBD office inventory and improve the
annual. For 2019, completions, take-up and vacancy rate are as at 1Q19, outlook for the asset class, thus supporting a stronger appreciation in asset value
while future supply is for 2Q19 to 4Q19.
Physical Indicators are for the CBD. than projected earlier.
Source: JLL
Note: Singapore Office refers to Singapore’s CBD Grade A office market in Marina Bay, Raffles Place, Shenton
Way and Marina Centre.You can also read