Dunedin Income Growth Investment Trust PLC - Selecting a diverse portfolio of high-quality UK and overseas companies to deliver a resilient ...
←
→
Page content transcription
If your browser does not render page correctly, please read the page content below

Dunedin Income Growth
Investment Trust PLC
Selecting a diverse portfolio of high-quality UK and overseas companies to
deliver a resilient quarterly income and long-term capital growth potential

Annual Report
31 January 2019

View of Aberdeen Standard Investments’ office from Bow Churchyard, London

Contents

Company Overview
Financial Highlights                       2
Chairman’s Statement                       4

Strategic Report
Overview of Strategy                        9
Results                                    15
Performance                                17
Investment Manager’s Review                19

Portfolio
Ten Largest Investments                    23
Other Investments                          24
Portfolio Sector Breakdown                 26
Sector Analysis                            27

Governance
Your Board of Directors                    30
Directors’ Report                          33
Directors’ Remuneration Report             39
Audit Committee’s Report                   42

Financial Statements
Statement of Directors’ Responsibilities   46
Independent Auditor’s Report               47
Statement of Comprehensive Income          55   Visit our Website
Statement of Financial Position            56   To find out more about Dunedin Income Growth
Statement of Changes in Equity             57   Investment Trust PLC, please visit
Statement of Cash Flows                    58   dunedinincomegrowth.co.uk
Notes to the Financial Statements          59
                                                THIS DOCUMENT IS IMPORTANT AND REQUIRES YOUR
                                                IMMEDIATE ATTENTION. If you are in any doubt about the
Corporate Information
                                                action you should take, you are recommended to seek
Information about the Investment Manager   79
                                                your own independent financial advice from your
Investor Information                       81
                                                stockbroker, bank manager, solicitor, accountant or other
Glossary of Terms and Definitions          84
                                                financial adviser authorised under the Financial Services
Your Company’s History                     86
                                                and Markets Act 2000 if you are in the United Kingdom or,
Share Capital History                      87
                                                if not, from another appropriately authorised financial
AIFMD Disclosures (Unaudited)              88
                                                adviser.
Alternative Performance Measures           89

                                                If you have sold or otherwise transferred all your
Notice                                          Ordinary shares in Dunedin Income Growth Investment
Notice of Annual General Meeting           91   Trust PLC, please forward this document, together with
                                                the accompanying documents immediately to the
                                                purchaser or transferee, or to the stockbroker, bank or
General                                         agent through whom the sale or transfer was effected for
Contact Addresses                          97   transmission to the purchaser or transferee.

                                                                    Dunedin Income Growth Investment Trust PLC 1
Company Overview
 Financial Highlights For the year ended 31 January 2019

 Dunedin Income Growth Investment Trust PLC (the                                The Company is governed by a board of directors, all of
 “Company” or “DIGIT”) is an investment trust with its                          whom are independent, and has no employees. Like most
 Ordinary shares listed on the premium segment of the                           other investment companies, the Company outsources its
 London Stock Exchange. The Company aims to attract long                        investment management and administration to an
 term private and institutional investors who seek growth                       investment management company, the Standard Life
 of income and capital from a portfolio invested mainly in                      Aberdeen Group, and other third party providers. The
 companies listed or quoted in the United Kingdom.                              Company does not have a fixed life.

  Net asset value total returnAB                                                 Earnings per share (revenue)

  (3.86)%
  2018                                                        +11.98%
                                                                                 12.68p
                                                                                 2018                                                12.64p
  Share price total return       A
                                                                                 Ongoing charges A

  (0.83)%
  2018                                                        +11.74%
                                                                                 0.63%
                                                                                 2018                                                0.61%
  Discount to net asset value         AC
                                                                                 Dividends per Ordinary share

  6.96%
  2018                                                             8.14%
                                                                                 12.45p
                                                                                 2018
                                                                                                                                   (+2.89%)
                                                                                                                                     12.10p
  A
    Alternative Performance Measure (see pages 89 and 90).
  B
    With debt at fair value, dividends reinvested (see page 89).
  C
    With debt at fair value. See definition on page 69.

 Net asset value per share*                          Dividends per share                         Mid-market price per share
 At 31 January – pence                               Year ended 31 January - pence               At 31 January – pence

                                                                                 12.10 12.45
                                 290.6                           11.70                               266.0
   279.7                                             11.25 11.40                                                             260.0
                       270.3               266.8                                                                     243.5           242.0
             237.5                                                                                           220.0

    15        16         17        18       19         15          16      17      18    19           15      16      17      18       19
* With debt at fair value (see note 16).

 2 Annual Report 2019
Investment Objective                                            Benchmark
The Company’s objective is to achieve growth of income          The Company’s benchmark is the FTSE All-Share Index
and capital from a portfolio invested mainly in companies       (total return). Performance is measured on a net asset
listed or quoted in the United Kingdom.                         value total return basis over the long-term.

Investment Policy                                               Management
In pursuit of its objective, the Company's investment policy    The Company’s Manager is Aberdeen Standard Fund
is to invest in high quality companies with strong income       Managers Limited (“ASFML”, the “AIFM” or the “Manager”)
potential and providing an above-average portfolio yield.       which has delegated the investment management of the
                                                                Company to Aberdeen Asset Managers Limited (“AAML” or
Details of the Company’s policies in relation to risk           the “Investment Manager”). Both companies are wholly
diversification and gearing are contained on page 9.            owned subsidiaries of Standard Life Aberdeen plc, which
                                                                was formed by the merger of Aberdeen Asset
                                                                Management PLC and Standard Life plc in August 2017.
                                                                Aberdeen Standard Investments is a brand of the
                                                                investment business of the merged entity.

Financial Calendar

 23 May 2019                      Annual General Meeting in Dundee (12 noon)

 29 May 2019                      Final dividend payable for year ended 31 January 2019

 31 July 2019                     Half year end

 30 August 2019                   Expected payment of first interim dividend

 September 2019                   Expected announcement of half-yearly results for six months ending 31 July 2019

 29 November 2019                 Expected payment of second interim dividend

 31 January 2020                  Year end

 28 February 2020                 Expected payment of third interim dividend

 March 2020                       Expected announcement of annual results for the year ending 31 January 2020

                                                                                   Dunedin Income Growth Investment Trust PLC 3
Company Overview
Chairman’s Statement

David Barron
Chairman

Against a weak market backdrop, your company’s net           The quality characteristics of the portfolio were much
asset value (“NAV”) declined by 3.86% on a total return      enhanced over the year, with the companies held
basis for the year ended 31 January 2019. This               having significantly higher margins and lower debt than
compares with a total return of -3.83% from the FTSE         the wider market. From a positioning perspective, the
All-Share Index. The share price total return for the year   active share of the portfolio increased over the year by
was -0.83% reflecting a modest narrowing of the              nearly 10% to more than 70%, while the Company’s
discount to NAV from 8.14% at the start of the year to       exposure to mid cap and smaller companies is now well
6.96% as at year end (on an ex-income basis with             over 30% having increased by around 5% over the
borrowings stated at fair value). As explained in more       period. At the same time, the average dividend growth
detail below, the equity portfolio performed well relative   rate of the companies within the portfolio has
to the benchmark but this was offset by the impact of        increased.
gearing in a falling market and ongoing charges.
                                                             The Board believes that these changes position your
It is disappointing to report on a year when the NAV         Company to deliver both faster dividend growth and
total return was negative, albeit in line with the           better capital performance over the medium term.
benchmark. However there are a number of factors that
were more positive.                                          Earnings and Dividends
                                                             Income from investments was in line with the previous
Throughout the year, the portfolio continued to evolve       year, resulting in earnings per share of 12.68p (2018:
in line with our strategy to create a more active, better    12.64p).
quality and higher growth investment proposition that
can deliver reliable and growing dividends to our
                                                             During the year the Board considered all aspects of the
shareholders. The Board is encouraged with the
                                                             Company’s strategy for revenue generation. We
progress made so far and the year under review was
                                                             continue to believe that the use of option strategies to
one of solid progress, with record earnings, a dividend
                                                             deliver revenue is a useful and helpful element of our
increased ahead of inflation and continuing
                                                             strategy. Income from writing options contributed some
improvement in performance relative to the Company’s
                                                             7% of the Company’s total revenue. This level of income
peers.
                                                             is helpful but not vital and, whilst option strategies
                                                             continue to make a contribution to revenue without
There were positive contributions from stock selection       detracting from the overall performance of the
and whilst gearing detracted from performance, the           Company, we shall continue to keep the flexibility, whilst
Board believes the long-term impact of gearing will be       carefully monitoring the implementation of the strategy.
positive. In addition, our overseas holdings, which are
principally in Europe, did not benefit from a weaker
                                                             Three interim dividends of 3.0p per share (2018: 2.575p)
pound. Thus, overall stock selection was positive and
                                                             were paid in respect of the year, on 24 August 2018, 23
the impact of gearing was negative in a market that fell
                                                             November 2018 and 22 February 2019.
over the year.

Over one and three years the NAV total return is             Having been unchanged since 2013, the rates of interim
broadly in line with the benchmark, and over the longer      dividends were increased during the year as the Board
three year period the Company now ranks in the top           had been mindful that the increases in the overall
quartile of all 25 investment trusts in the AIC UK Equity    annual rate of dividend since then had caused the final
Income Sector (source: AIC).                                 dividend to become a growing percentage of the total
                                                             annual payment. During the year, the Board therefore
                                                             announced its intention to increase the rate of each

4 Annual Report 2019
interim dividend this year to 3.0p per share so as to       Despite the recent recovery in equity markets the global
create a more even balance between the rates of the         economic picture deteriorated over the course of 2018.
interim and final dividends. At the same time, the Board    In particular, China slowed quite significantly due to the
stated that, as a result of this rebalancing, it expected   impact of both domestic policies and the uncertainty
that the final dividend would be lower than last year but   caused by ongoing trade disputes. This in turn has had a
that it remained our intention to continue a policy of      knock on effect on the European economy with export-
growing total annual dividends in real terms over the       related growth declining sharply. While the US economy
medium term.                                                has remained relatively strong, even there the signs are
                                                            that growth is cooling as the impact of tax cuts fades
Accordingly, the Board is proposing a final dividend of     and interest rates rise.
3.45p per share (2018: 4.375p), payable on 29 May 2019
to shareholders on the register on 3 May 2019. This will    Meanwhile, the UK economy has so far proven
make a total dividend of 12.45p per share for the year,     surprisingly resilient despite ongoing political travails
an increase of 2.9% on last year and slightly ahead of      and the uncertainty posed by the withdrawal from the
the rate of inflation which was 1.8% as measured by the     EU. Employment data has remained strong and we have
Consumer Price Index. This will be the 35th year out of     started to see signs of higher rates of income growth.
the past 39 that the Company has grown its dividend,        However, in recent months there has been more
with the level of distribution maintained in the other      evidence of a weakening environment for business
four years. As can be seen in greater detail on page 16     investment given low levels of visibility on future trading
the importance of dividends to the overall return from      arrangements for companies. That uncertainty over the
the Company, and indeed the index, is highly significant.   shape of the UK’s trading relationship with both the EU
                                                            and the rest of the world, as a result of Brexit, and any
Following payment of the final dividend, we will be able    consequent impact upon the Company’s portfolio is
to add a further 0.38p per share to the Company’s           likely to persist for some considerable time.
revenue reserves, meaning that 11.54p per share will be
available to support future distributions, representing     Performance
93% of the current annual dividend cost, a further          As noted above, the Company’s NAV total return for the
strengthening of your company’s financial position.         year was -3.86%. The total return from the equity
                                                            portfolio was -2.67%, an outperformance of 1.16%
Our strategy is to reduce the Company’s dependence on       compared to the total return of -3.83% from the FTSE
higher yielding, lower growth companies. The income         All-Share Index. Within the equity portfolio it is positive
performance has been somewhat stronger than                 to note that the Company benefitted from a strong
expected and we have not experienced a drop in              performance from precisely the kind of companies to
earnings. However, as we look forward into the year         which the Investment Manager has been seeking to
ahead, it is likely that we will see a decline in the       expand our exposure. Namely, high quality businesses
earnings per share. Our strategy, however, should           with cash flows and balance sheets capable of providing
enhance the Company’s longer term potential for both        reasonable levels of dividend yield but, critically,
faster dividend growth and better capital performance.      combined with good long-term growth prospects.
As stated above, our distribution policy remains to grow
the dividend faster than inflation over the medium term     The Company also benefitted from a strong
and, with the Company’s robust revenue reserves and         performance from a number of our overseas holdings,
the healthy underlying dividend growth of the               which, once again, have added value while further
companies within the portfolio, that policy remains well    broadening the opportunity set for your Investment
supported.                                                  Manager to pick from and diversifying our income
                                                            stream. A number of the new smaller market cap
Market Background                                           investments have made a useful contribution to
The year under review was very much one of contrasts.       performance.
The first half proved reasonably strong for equities with
the FTSE All-Share Index reaching an all-time high in       Gearing
May 2018 and consensus extremely optimistic around          As shareholders will recall, in December 2015 the
the prospects for global growth. However, over the          Company borrowed £30 million through the issue of
course of the latter part of the year, concerns around      loan notes bearing an interest rate of 3.99% with a
the Chinese economy, the pace of monetary tightening        maturity date of 2045, recognising that the debenture
in the United States and trade policy tensions resulted     was repayable in 2019. The proceeds of the loan note
in a sharp sell-off from the end of September. Since the    issuance remain invested in a portfolio of corporate
end of 2018, equities have rallied and recovered some       bonds which, taking into account the call features or
of their earlier losses given signs that some of these      prepayment options on several of the bonds, broadly
risks may have eased, in particular following a more        matches the duration of the debenture and the income
dovish message from the Federal Reserve.

                                                                             Dunedin Income Growth Investment Trust PLC 5
Company Overview
Chairman’s Statement continued

from which largely offsets the interest cost of the issue.    As stated above, the Board believes that the successful
These bonds will be sold at the most appropriate time         implementation by the Investment Manager of the
and the proceeds deployed to meet the repayment of            investment strategy should enhance the Company’s
the debenture.                                                longer term potential for improved performance. We
                                                              believe that this, in turn, should lead to a re-rating of the
With debt valued at par, the Company’s net gearing            Company’s shares relative to its peers.
increased from 14.47% to 16.21% during the year.
However, on a pure equity basis, after netting off cash       We will again seek shareholders’ permission at the
and bonds, gearing rose from 7.83% to 8.81%. It is this       forthcoming Annual General Meeting to buy back
latter figure that represents more accurately the true        shares and are prepared to continue to use this
extent to which the movement in the NAV could differ          measure in the light of both the Company’s absolute
from the return on an ungeared portfolio in the future.       level of discount and that relative to those of its peer
The Board believes this remains a relatively                  group.
conservative level of equity gearing and, with part of the
revolving credit facility undrawn, this provides the          Annual General Meeting
Company with financial flexibility should opportunities
                                                              The Annual General Meeting will be held at Discovery
to deploy additional capital arise.
                                                              Point, Discovery Quay, Dundee DD1 4XA on Thursday 23
                                                              May 2019 at 12 noon. This will be a good opportunity
In April this year the Company will repay the £28.6           for shareholders to meet the Board and Manager and
million debenture and exit from its bond holdings. This       we would encourage you to attend. Shareholders who
will significantly reduce the headline level of gearing and   are unable to attend are encouraged to complete and
simplify the Company’s capital structure. The Board           return their Proxy Forms to the Company’s Registrar so
believes that, despite a low level of equity gearing,         that their votes are represented at the meeting.
investors’ perception of the Company’s level of leverage
is influenced by the headline level of gearing; that is the
                                                              The notice of Annual General Meeting is contained on
total borrowings without taking into account the bond
                                                              pages 91 to 94.
portfolio. The repayment of the debenture, and disposal
of the bond holdings, will therefore mark an important
step in simplifying and clarifying the strength of the        Summary
Company’s balance sheet.                                      During the year a history of the Company was published
                                                              as we approach the 150th anniversary of the Company’s
After the repayment of the debenture, the Company will        establishment. I commend this to shareholders. It is an
employ two sources of gearing, the £30 million loan           interesting and at times colourful story which highlights
notes maturing in 2045 and a £15 million multi-currency       the long-term nature of investing and the durability of
revolving credit facility that expires in July 2021. Under    investment trusts as a vehicle for a wide range of
the terms of the revolving credit facility the Company        investors, and in particular private investors. The book
has the option to increase the level of the commitment        is available on the Company’s website.
from £15 million to £30 million at any time, subject to
the lender’s credit approval. A Sterling equivalent of        Looking back over the longer-term it is clear that in
£11.4 million was drawn down at the year end.                 times of economic stress, corporate pay-outs can come
                                                              under pressure, sometimes severe pressure. The most
Discount                                                      recent instance of this was in 2008 when dividend
                                                              payments fell significantly as corporates cut or were
The discount at which the price of the Company’s shares       forced to cut their distributions.
trade relative to the NAV narrowed from 8.14% at the
beginning of the year to 6.96% as at 31 January 2019 (on
an ex-income basis with borrowings stated at fair value).     Our strategy of broadening the base of companies we
                                                              can invest in by building revenue reserves and reducing
                                                              our reliance on the few major dividend paying
The Company’s shares continued to trade at a relatively       companies that account for a significant proportion of
wide discount for the first eight months of the financial     income from the UK stockmarket, is designed to ensure
year. During this time the Company purchased                  that we can grow our dividend and deliver capital
1,387,018 shares to hold in treasury, at a cost of £3.6       growth over the longer-term. The portfolio is
million, providing a small accretion to the NAV per           increasingly different from the broader market, as
share.                                                        evidenced by our higher active share. As a result,
                                                              investors should expect there will be periods, perhaps
                                                              extended, when performance will diverge from the
                                                              benchmark index.

6 Annual Report 2019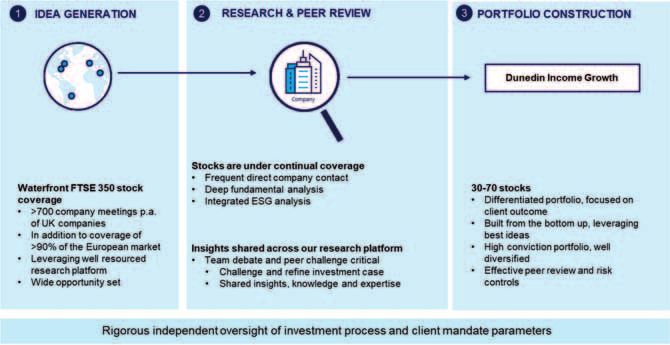
There is some encouragement that the implementation
of the strategy is beginning to deliver better results. Our
relative performance has improved, particularly against
similar funds from which investors might choose an
equity income strategy.

The Board believes that the repositioning of the
Company’s portfolio leaves it relatively well placed
amidst an uncertain economic and political
environment, for which the outlook is finely balanced. In
such market conditions your Investment Manager’s
focus will remain on identifying companies that can
continue to prosper, even in more difficult conditions,
and sustain and grow their distributions to
shareholders.

The dividend has increased ahead of inflation over five
years, the Company’s shares currently yield 4.9% based
on the dividends declared or paid for the year under
review and, as stated above, our revenue reserves
represent 93% of the annual dividend cost. The Board is
focused on the Company continuing to deliver relative
total return outperformance, particularly against
comparable vehicles which, we believe, combined with a
demonstration of the portfolio’s income growth
potential and the forthcoming simplification of the
balance sheet, should result in the share price more
closely reflecting the underlying asset value of the
Company.

David Barron
Chairman
27 March 2019

                                                              Dunedin Income Growth Investment Trust PLC 7
Strategic Report
  The Company is an investment trust with a premium listing
  on the London Stock Exchange.

  The Company’s objective is to achieve growth of income
  and capital from a portfolio invested mainly in companies
  listed or quoted in the United Kingdom.

  The Company maintains a diversified portfolio consisting,
  substantially, of equity or equity-related securities, and it
  can invest in other financial instruments. The Company is
  invested mainly in companies listed or quoted in the United
  Kingdom and can invest up to 20% of its gross assets
  overseas.

  1873
  Dunedin Income Growth Investment Trust PLC was
  launched in Dundee in 1873; investment trusts are the
  oldest form of collective investment in the world.

V&A Dundee
Strategic Report
Overview of Strategy

Business Model                                                  Benchmark
The Company is an investment trust with a premium               The Company’s benchmark is the FTSE All-Share Index
listing on the London Stock Exchange.                           (total return). Performance is measured on a net asset
                                                                value total return basis over the long-term.
Investment Objective
The Company’s objective is to achieve growth of income          Key Performance Indicators (“KPIs”)
and capital from a portfolio invested mainly in companies       The Board uses a number of financial performance
listed or quoted in the United Kingdom.                         measures to assess the Company’s success in achieving its
                                                                objective and determining the progress of the Company in
Investment Policy                                               pursuing its investment policy. The main KPIs are shown
In pursuit of its objective, the Company's investment policy    in the table on the following page:
is to invest in high quality companies with strong income
potential and providing an above-average portfolio yield.

Risk Diversification
The Company maintains a diversified portfolio consisting,
substantially, of equity or equity-related securities, and it
can invest in other financial instruments. The Company is
invested mainly in companies listed or quoted in the
United Kingdom and can invest up to 20% of its gross
assets overseas.

It is the policy of the Company to invest no more than 15%
of its gross assets in other listed investment companies
and no more than 15% of its gross assets in any one
company.

Gearing
The Board is responsible for determining the gearing
strategy for the Company, with day-to-day gearing
decisions being made by the Manager within the remit set
by the Board. The Board has set its gearing limit at a
maximum of 30% of the net asset value at the time of
draw down. Gearing is used selectively to leverage the
Company's portfolio in order to enhance returns where
and to the extent considered appropriate.

Delivering the Investment Objective
The Directors are responsible for determining the
Company’s investment objective and investment policy.
Day-to-day management of the Company’s assets has
been delegated, via the AIFM, to the Investment Manager.

Investment Process
The Investment Manager believes that company
fundamentals ultimately drive stock prices but are often
priced inefficiently. They believe that in-depth company
research delivers insights that can be used to exploit these
market inefficiencies.

Further information on the investment process and risk
controls employed by the Investment Manager is
contained on pages 79 to 80.

                                                                                  Dunedin Income Growth Investment Trust PLC 9
Strategic Report
Overview of Strategy continued
KPI Description
Performance The Board considers the Company’s NAV total return figures to be the best single indicator
of performance over time. The figures for each of the past 10 years are set out on page 17.
Performance of NAV The Board measures the Company’s NAV total return performance against the total return
against benchmark of the benchmark index – the FTSE All-Share Index. The figures for this year and for the past
index and comparable three and five years, and a graph showing performance against the benchmark index over
investment trusts the past five years are shown on page 16. The Board also monitors performance relative to
a peer group of investment trusts which have similar objectives, policies and yield
characteristics.
Revenue return per The Board monitors the Company’s net revenue return. The revenue returns per Ordinary
Ordinary share share for each of the past 10 years are set out on page 17.
Dividend per Ordinary The Board monitors the Company’s annual dividends per Ordinary share. The dividends per
share share for each of the past 10 years are set out on page 17.
Share price The Board monitors the performance of the Company’s share price on a total return basis.
performance The returns for this year and for the past three and five years, and a graph showing the
share price total return performance against the benchmark index over the past five years
are shown on page 16.
Discount/premium to The discount/premium of the share price relative to the NAV per share is monitored by the
NAV Board. The discounts at the year end and at the end of the previous year are disclosed on
page 15.
Ongoing charges The Board monitors the Company’s operating costs carefully. Ongoing charges for the year
and the previous year are disclosed on page 15.
Principal Risks and Uncertainties mitigating actions the Board has taken, are set out in the
There are a number of risks which, if realised, could have a table below. The Board has carried out a robust
material adverse effect on the Company and its financial assessment of these risks, which include those that would
condition, performance and prospects. The risks and threaten its business model, future performance, solvency
uncertainties faced by the Company are reviewed by the or liquidity. The principal risks associated with an
Audit Committee in the form of a risk matrix and the investment in the Company’s shares are published
assessment of risks and their mitigation continues to be monthly in the Company’s factsheet and they can be
an area of significant focus for the Audit Committee. The found in the pre-investment disclosure document (“PIDD”)
principal risks and uncertainties facing the Company at the published by the Manager, both of which are available on
current time, together with a description of the the Company’s website.
Risk Mitigating Action
Investment objectives - a lack of Board review. The Board formally reviews the Company’s objectives and
demand for the Company’s shares due to strategies for achieving them on an annual basis, or more regularly if
its objectives becoming unattractive to appropriate.
investors could result in a widening of
the discount of the share price to its Shareholder communication.The Board is cognisant of the importance
underlying net asset value and a fall in of regular communication with shareholders. Directors attend meetings with
the value of its shares. the Company’s largest shareholders and meet other shareholders at the
10 Annual Report 2019Annual General Meeting. The Board reviews shareholder correspondence
and investor relations reports and also receives feedback from the
Company’s broker.
Discount monitoring. The Board, through the Manager, keeps the level of
discount under constant review. The Board is responsible for the Company’s
share buy back policy and is prepared to authorise the use of share buy
backs to provide liquidity to the market and try to limit any widening of the
discount.
Investment strategies - the Company Adherence to investment guidelines͘The Board sets investment
adopts inappropriate investment guidelines and restrictions which the Manager follows, covering matters such
strategies in pursuit of its objectives as asset allocation, diversification, gearing, currency exposure, use of
which could result in investors avoiding derivatives etc. These guidelines are reviewed regularly and the Manager
the Company’s shares, leading to a reports on compliance with them at Board meetings.
widening of the discount and poor
investment performance. In order to ensure adequate diversification, the Board has set absolute limits
on maximum holdings and exposures in the portfolio at the time of
investment, which are in addition to the limits contained in the Company’s
investment policy, including the following:
Ͳ No more than 10% of gross assets to be invested in any single stock; and
Ͳ The top five holdings should not account for more than 40% of gross
assets.
Regular shareholder communication and discount monitoring, as above.
Investment performance- the Monitoring of performance.The Board meets the Manager on a regular
appointment or continuing appointment basis and keeps under close review (inter alia) its resources, adherence to
of an investment manager with investment processes, the adequacy of risk controls, and investment
inadequate resources, skills or expertise performance.
or which makes poor investment
decisions. This could result in poor Management Engagement Committee.A detailed formal appraisal of
investment performance, a loss of value the Manager is carried out annually by the Management Engagement
for shareholders and a widening Committee.
discount.
Income/dividends- the Company Revenue forecasting and monitoring.The Manager presents detailed
adopts an unsustainable dividend policy forecasts of income and expenditure covering both the current and
resulting in cuts to or suspension of subsequent financial years at Board meetings. Dividend income received is
dividends to shareholders, or one which compared to forecasts and variances analysed.
fails to meet investor demands.
Use of reserves͘The Company has built up significant revenue reserves
which are available to smooth dividend distributions to shareholders should
there be a shortfall in revenue returns.
Financial/market - insufficient Management controls.The Manager has a range of procedures and
oversight or controls over financial risks, controls relating to the Company’s financial instruments, including a review
including market risk, foreign currency of investment risk parameters by its Investment Risk department and a
risk, liquidity risk and credit risk could review of credit worthiness of counterparties by its Counterparty Credit Risk
result in losses to the Company. team.
Dunedin Income Growth Investment Trust PLC 11Strategic Report
Overview of Strategy continued
Foreign currency hedging.It is not the Company’s policy to hedge foreign
currency exposure but the Company may, from time to time, partially
mitigate it by drawing down borrowings in foreign currencies.
Board review.As stated above, the Board sets investment guidelines and
restrictions which are reviewed regularly and the Manager reports on
compliance with them at Board meetings.
Further details of the Company’s financial instruments and risk management
are included in note 17 to the financial statements.
Gearing - gearing accentuates the effect Gearing restrictions͘The Board sets gearing limits within which the
of rises or falls in the market value of the Manager can operate.
Company’s investment portfolio on its
net asset value. An inappropriate level of Monitoring.Both the limits and actual levels of gearing are monitored on
gearing at a time of falling values could an ongoing basis by the Manager and at regular Board meetings. In the event
result in a significant fall in the value of of a possible impending covenant breach, appropriate action would be taken
the Company’s net asset value and to reduce borrowing levels.
shares. Such a fall in the value of the
Company’s net assets could result in a Scrutiny of loan agreements.The Board takes advice from the Manager
breach of loan covenants and trigger and the Company’s lawyers before approving details of loan agreements.
demands for early repayment or require Care is taken to ensure that covenants are appropriate and unlikely to be
investments to be sold to meet any breached.
shortfall. This could result in further
losses. Limits on derivative exposure.The Board has set limits on derivative
exposures and positions are monitored at regular Board meetings.
Regulatory Ͳchanges to, or failure to Board awareness.The Directors have an awareness of the more important
comply with, relevant regulations regulations and are provided with information on changes by the Association
(including the Companies Act, The of Investment Companies. In terms of day to day compliance with
Financial Services and Markets Act, The regulations, the Board is reliant on the knowledge and expertise of the
Alternative Investment Fund Managers Manager. However, where necessary, the Board engages the service of
Directive, accounting standards, external advisers.
investment trust regulations, the Listing
Rules, Disclosure Guidance and Management controls.The Manager’s company secretariat and
Transparency Rules and Prospectus accounting teams use checklists to aid compliance and these are backed by
Rules) could result in fines, loss of the Manager’s compliance monitoring programme and risk based internal
reputation, reduced demand for the audit investigations.
Company’s shares and potentially loss of
an advantageous tax regime.
Operational -the Company is reliant on Agreements.Written agreements are in place defining the roles and
services provided by third parties (in responsibilities of all third party service providers.
particular those of the Manager and the
Depositary) and any control gaps and Internal control systems of the Manager.The Board receives reports
failures in their operations could expose on the operation and efficacy of the Manager’s IT and control systems,
the Company to loss or damage. including those relating to cyber crime, and its internal audit and compliance
functions.
Safekeeping of assets͘The Depositary is ultimately responsible for the
safekeeping of the Company’s assets and its records are reconciled to those
of the Manager on a regular basis. Through a delegation by the Depositary,
the Company’s investments and cash balances are held in segregated
accounts by the Custodian.
12 Annual Report 2019Monitoring of other third party service providers. The Manager
monitors closely the control environments and quality of services provided
by third parties, including those of the Depositary. This includes controls
relating to cyber crime and is conducted through service level agreements,
regular meetings and key performance indicators. The Directors review
reports on the Manager’s monitoring of third party service providers on a
periodic basis.
Promoting the Company Environmental, Social and Human Rights Issues
The Board recognises the importance of promoting the The Company has no employees as the Board has
Company to existing and prospective investors. The Board delegated the day to day management and administrative
believes an effective way to achieve this is through functions to the Manager. There are therefore no
subscription to and participation in the promotional disclosures to be made in respect of employees. The
programme run by the Manager on behalf of a number of Company’s socially responsible investment policy is set out
investment trusts under its management. The Company’s below.
financial contribution to the programme is matched by the
Manager. The Manager’s marketing and investor relations Socially Responsible Investment Policy
teams report to the Board giving analysis of the The Directors, through the Manager, encourage
promotional activities as well as updates on the companies in which investments are made to adhere to
shareholder register and any changes in the make up of best practice in the area of corporate governance and
that register. socially responsible business. The Manager believes that
this can best be achieved by entering into a dialogue with
The purpose of the programme is both to communicate company management to encourage them, where
effectively with existing shareholders and to gain new necessary, to improve their policies in both areas. The
shareholders with the aim of improving liquidity and Manager’s ultimate objective, however, is to deliver
enhancing the value and rating of the Company’s shares. superior investment returns for its clients. Accordingly,
Communicating the long-term attractions of the Company whilst the Manager will seek to favour companies which
is key and therefore the Company also supports the pursue best practice in these areas, this must not be to
Manager’s investor relations programme which involves the detriment of the return on the investment portfolio.
regional roadshows, promotional and public relations
campaigns.
UK Stewardship Code and Proxy Voting as an
Institutional Shareholder
Board Diversity Policy
Responsibility for actively monitoring the activities of
The Board recognises the importance of having a range of
portfolio companies has been delegated by the Board to
skilled, experienced individuals with the right knowledge
the Manager which has sub-delegated that authority to
represented on the Board in order to allow it to fulfil its
the Investment Manager.
obligations. The Board also recognises the benefits and is
supportive of the principle of diversity in its recruitment of
The full text of the Company’s response to the
new Board members. The Board will not display any bias
Stewardship Code may be found on its website.
for age, gender, race, sexual orientation, religion, ethnic or
national origins, or disability in considering the
Modern Slavery Act
appointment of its Directors. In view of its size, the Board
will continue to ensure that all appointments are made on Due to the nature of its business, being a company that
does not offer goods and services to customers, the Board
the basis of merit against the specification prepared for
considers that the Company is not within the scope of the
each appointment and the Board does not therefore
Modern Slavery Act 2015 because it has no turnover. The
consider it appropriate to set measurable objectives in Company is therefore not required to make a slavery and
relation to its diversity. human trafficking statement. In any event, the Board
considers the Company’s supply chains, dealing
At 31 January 2019, there were three male and two female predominantly with professional advisers and service
Directors on the Board. providers in the financial services industry, to be low risk
in relation to this matter.
Dunedin Income Growth Investment Trust PLC 13Strategic Report
Overview of Strategy continued
Viability Statement Outlook
The Board considers that the Company, which does not The Board’s view on the general outlook for the Company
have a fixed life, is a long term investment vehicle and, for can be found in the Chairman’s Statement on pages 4 to 7
the purposes of this statement, has decided that five years whilst the Investment Manager’s views on the outlook for
is an appropriate period over which to consider its the portfolio are included on pages 19 to 21.
viability. The Board considers that this period reflects a
balance between looking out over a long term horizon and On behalf of the Board
the inherent uncertainties of looking out further than five David Barron
years. Chairman
27 March 2019
Taking into account the Company’s current position and
the potential impact of its principal risks and uncertainties,
the Directors have a reasonable expectation that the
Company will be able to continue in operation and meet
its liabilities as they fall due for a period of five years from
the date of this Report.
In assessing the viability of the Company over the review
period, the Directors have focused upon the following
factors:
ͼThe principal risks and uncertainties detailed on pages
10 to 13 and the steps taken to mitigate these risks.
ͼThe relevance of the Company’s investment objective,
especially in the current low yield environment.
ͼThe Company is invested in readily-realisable listed
securities.
ͼShare buy backs carried out in the past have not resulted
in significant reductions to the capital of the Company.
ͼAlthough the Company’s stated investment policy
contains a gearing limit of 30% of the net asset value at
the time of draw down, the Board’s policy is to have a
relatively modest level of equity gearing and the financial
covenants attached to the Company’s borrowings
provide for significant headroom.
ͼThe repayment of the Company’s £28.6 million 7 7/8%
Debenture Stock on 30 April 2019 has been pre-financed
through the issue of £30 million 3.99% Loan Notes which
are repayable in December 2045, the proceeds of which
are invested in a portfolio of fixed interest securities
which broadly match the duration of the Debenture.
In making its assessment, the Board is also aware that
there are other matters that could have an impact on the
Company’s prospects or viability in the future, including a
large economic shock or significant stock market volatility,
and changes in regulation or investor sentiment.
14 Annual Report 2019Strategic Report
Results
Financial Highlights
31 January 2019 31 January 2018 % change
Total assets (see page 85 for definition) £471,480,000 £512,159,000 (7.94)
Equity shareholders’ funds £401,731,000 £442,384,000 (9.19)
Market capitalisation £358,868,000 £389,167,000 (7.79)
Net asset value per Ordinary share 270.90p 295.55p (8.34)
Net asset value per Ordinary share with debt at fair valueAF 260.11p 283.04p (8.10)
Share price (mid) 242.00p 260.00p (6.92)
FTSE All-Share Index 3,825.62 4,137.66 (7.54)
Discount (difference between share price and net asset value)
Discount where borrowings are deducted at fair valueF (6.96)% (8.14)%
Gearing (see page 84 for definitions)
Net gearingBF 16.21% 14.47%
Equity gearing CF
8.81% 7.83%
Dividends and earnings
Total return per share (11.95)p 30.83p
Revenue return per share 12.68p 12.64p +0.32
Total dividend per share for the year 12.45p 12.10p +2.89
Dividend cover (see page 84 for definition)
F
1.02 1.04
Revenue reserves
Prior to payment of third interim dividend declared and 17.99p 18.11p
proposed final dividendD
After payment of third interim dividend declared and proposed 11.54p 11.16p
final dividendDE
Operating costs
Ongoing chargesF 0.63% 0.61%
A
Based on capital only net asset values (see note 16 on pages 68 and 69 for disclosure on net asset values).
B
Calculated by dividing total borrowings less cash and cash equivalents by shareholders’ funds, expressed as a percentage.
C
Calculated as the amount by which the total value of equity securities held exceeds shareholders’ funds, expressed as a percentage of
shareholders’ funds.
D
Calculated by dividing the revenue reserve per the Statement of Financial Position on page 56 by the number of shares in issue at the reporting
date per note 14 on page 67.
E
Third interim dividend for the year ended 31 January 2019 of 3.000p per share (2018 – 2.575p). Proposed final dividend for the year ended 31
January 2019 of 3.450p (2018 – 4.375p).
F
Considered to be an Alternative Performance Measure as defined on pages 89 and 90.
Dunedin Income Growth Investment Trust PLC 15Strategic Report
Results continued
Performance (total return)
1 year 3 year 5 year
% return % return % return
Total return (Capital return plus net dividends reinvested)
Net asset valueAB (3.86)% +28.36% +26.19%
FTSE All-Share Index (3.83)% +28.49% +31.24%
Share priceB (0.83)% +29.05% +19.18%
Capital return
Net asset valueA (9.20)% +11.10% +0.57%
FTSE All-Share Index (7.54)% +14.68% +9.41%
Share price (6.92)% +10.00% (6.83)%
A
Cum-income NAV with debt at fair value, adjusted to exclude the third interim dividend for the year ended 31 January 2019 which went ex-
dividend on 31 January 2019 but was not paid until 22 February 2019 due to the difference in recognition of dividends payable on an ex-dividend
date basis under AIC reporting guidelines and upon payment under accounting standards.
B
Considered to be an Alternative Performance Measure (see page 89)
Source: Standard Life Aberdeen, Factset & Morningstar
Comparison of NAV and Share Price Total Return Performance of DIGIT to FTSE All-Share Index (figures
rebased to 100) – Five years ended 31 January 2019
140 FTSE All-
Share total
130 return
120 NAV total
return with
110
debt at fair
100 value
Share price
90 total return
80
31/01/14 31/01/15 31/01/16 31/01/17 31/01/18 31/01/19
Source: Standard Life Aberdeen, Morningstar & Lipper
Comparison of NAV Total Return Performance of DIGIT to FTSE All-Share Index Total Return for 5 years
31.24%
26.19%
NAV total
return
19.23% 20.06%
with debt
11.08% 11.98% 11.28% at fair
value
7.11%
-4.63% -3.86% -3.83% FTSE All-
Share
-11.49% total
Year to Year to Year to Year to Year to 5 year total return
31/01/15 31/01/16 31/01/17 31/01/18 31/01/19 return
(cumulative)
Source: Standard Life Aberdeen, Morningstar & Lipper
16 Annual Report 2019Strategic Report
Performance
Analysis of Total Return Performance
%
Gross assets total return (2.47)
Total NAV return per shareA (3.86)
Total return on FTSE All-Share Index (3.83)
Relative performance (0.03)
A
With debt at market value.
Analysis of Performance for the year Relative to the FTSE All-Share Index
Listed equities 1.00
- Stock selection^ 2.28
- Sector allocation^ (1.28)
Borrowings and cash (0.36)
Bid pricing adjustment (0.07)
Fees and expenses (0.60)
^ Further analysis of performance attributable to listed equities.
Ten Year Financial Record
Year ended 31 2010 2011 2012 2013 2014 2015 2016 2017 2018 2019
January
Total revenue (£’000) 14,251 16,904 19,173 18,866 20,750 20,994 20,359 21,963 22,317 22,263
Per share (p)
Revenue return 7.99 10.15 11.00 10.77 11.89 11.90 12.11 12.55 12.64 12.68
Dividends 10.25 10.25 10.65 10.75 11.10 11.25 11.40 11.70 12.10 12.45
paid/proposed
Revenue reserveA 7.16 7.06 7.42 7.45 8.22 8.89 9.63 10.51 11.16 11.54
Net asset valueB 198.80 226.81 222.88 251.48 262.34 279.66 237.48 270.34 290.57 266.83
Total return 51.15 39.00 6.50 41.30 22.24 27.76 (28.94) 43.83 30.83 (11.95)
Shareholders’ funds 303,603 346,927 341,280 385,605 403,526 428,702 368,041 415,810 442,384 401,731
(£’000)
A
After payment of third interim and final dividends.
B
With debt at fair value.
Dunedin Income Growth Investment Trust PLC 17Strategic Report
Performance continued
Comparison of Dividend Growth of DIGIT to Inflation (figures rebased to 100)
– Five years ended 31 January 2019
DIGIT
dividend
growth
Retail
Price
Index
Consumer
Price
Index
31/01/14 31/01/15 31/01/16 31/01/17 31/01/18 31/01/19
Source: Standard Life Aberdeen , ONS & Facstet
Dividends per Share - Pence
Year to 31 January
1 2 .1 0 1 2 .4 5
1 1 .4 0 1 1 .7 0
1 1 .1 0 1 1 .2 5
1 0 .6 5 1 0 .7 5
1 0 .2 5 1 0 .2 5
2 01 0 2 01 1 2 01 2 2 01 3 2 01 4 2 01 5 2 01 6 2 01 7 2 01 8 2 01 9
Dividends
Dividend per share Rate xd date Record date Payment date
Proposed final dividend 2019 3.450p 2 May 2019 3 May 2019 29 May 2019
Third interim dividend 2019 3.000p 31 January 2019 1 February 2019 22 February 2019
Second interim dividend 2019 3.000p 1 November 2018 2 November 2018 23 November 2018
First interim dividend 2019 3.000p 2 August 2018 3 August 2018 24 August 2018
Total dividend 2019 12.45p
Dividend per share Rate xd date Record date Payment date
Final dividend 2018 4.375p 3 May 2018 4 May 2018 30 May 2018
Third interim dividend 2018 2.575p 1 February 2018 2 February 2018 23 February 2018
Second interim dividend 2018 2.575p 2 November 2017 3 November 2017 24 November 2017
First interim dividend 2018 2.575p 3 August 2017 4 August 2017 25 August 2017
Total dividend 2018 12.10p
18 Annual Report 2019Strategic Report
Investment Manager’s Review
Introduction this was offset by the impact of costs and gearing. At the
The year ended 31 January 2019 has been one of further company level notable outperformers included Edenred,
progress. Since our appointment as lead managers nearly which benefitted from a recovery in its operations in Brazil
three years ago we have looked to increase the focus on as well as continued strong growth in its payments and
growth of both capital and income and differentiate the expense management units. Aveva, which specialises in
Company in what is a highly competitive sector. It has design software for large capital projects, saw improved
been another active year in terms of executing this. We demand from its customers in oil & gas and the first
are encouraged that our strategy is producing tangible synergies being delivered from the merger with Schneider.
results, with positive relative performance for the equity Pleasingly, Telecom Plus, one of our newer holdings,
portfolio whilst also improving both the underlying quality performed well during the second half of the year as
of the portfolio and its income growth potential. Since market conditions within the UK utility supply market
September 2016 we have nearly doubled the amount of continued to shift in its favour. Once again the portfolio
income coming from faster growing companies and benefited from its overseas holdings which made a further
meaningfully increased the average underlying dividend useful contribution to performance.
growth rate of the holdings within the portfolio whilst the
amount of income we deem at risk in the financial year One of the main headwinds to performance came from
ahead has fallen sharply. During this financial year the the underweight position in the oil and gas sector which
particular focus has been on improving the underlying performed relatively robustly for much of the year. Our
quality of the holdings and this is reflected in meaningfully positioning here is driven by the lack of dividend growth
higher returns and stronger balance sheets in aggregate from the companies and the relatively capital intensive
for the portfolio compared to where it stood twelve and cyclical nature of the industry. Given high yields, we
months ago. This has in part involved increasing exposure retain some exposure to both Total and Royal Dutch Shell
to small and mid-cap companies that have greater but, given our strategy, this area is likely to remain a
opportunity for long term growth and which now make up modest weighting relative to the large benchmark
more than 30% of the equity portfolio. It has also required exposure. The holding in British American Tobacco was
us to be increasingly selective and continue to focus the also hit following a series of potential regulatory changes
portfolio’s capital towards the very best businesses that within the key US tobacco market that dented investor
we can find. confidence following the company’s acquisition of
Reynolds American in 2017. We retain the holding,
believing the impact of such changes to be overly
Performance
discounted in the current share price. Relative to the
In terms of income performance it was a solid year given benchmark, we also missed out by not owning BSKYB or
the reorientation of the portfolio. Total income was more Shire Pharmaceutical which were both taken over during
or less flat year on year with an increase of 1.2% from the the year and together provided a near 1% impact on
equity holdings offset by declining fixed income revenue relative returns.
as the duration of the portfolio was reduced to closer
match the maturing 2019 debenture. It is once again
important to stress that maximisation of income in the
Portfolio Activity
near term has not been a priority and we have reduced It was another busy year as we continued to evolve the
holdings in higher yielding businesses, cutting near term portfolio towards companies with superior capital and
earnings, in order to increase investments in lower dividend growth prospects and higher quality
yielding but faster growing companies. Option writing characteristics. We would highlight that as long term, buy
contributed 6.7% of the total income for the year. The and hold investors we do not expect to be making this
Company benefited from special distributions from both number of portfolio changes on an ongoing basis,
Direct Line Insurance and Aveva and, in general, however we believe this has been the best course of
company dividend performance was ahead of our action for positioning the Company in the optimal way to
expectations with particularly notable increases from deliver the desired outcome.
mining holdings BHP Billiton and Rio Tinto as well as
French employee benefit manager Edenred. Only We introduced a number of new holdings into the
Inmarsat cut its dividend during the period and this was portfolio. In line with our strategy, these companies are
both expected and a precursor to a bid situation that predominantly towards the small and mid-cap end of the
allowed us to exit. Overall this has allowed us to make a market, where companies have a combination of
further addition to revenue reserves that will support our established positions in their respective industries
strategy of focusing on greater income growth. together with significant opportunity to grow from a low
base. This translates into the ability to sustain a higher
From a relative return perspective the equity portfolio dividend or to grow the dividend at a faster pace. In
outperformed the FTSE All-Share Index by 1.16% falling by addition, these companies sit well with our investment
2.67% in total return terms against a return of -3.83% for process where we have a well-resourced team investing
the benchmark. This outperformance was driven by the the time to uncover and research companies that often go
stock selection within the portfolio. At the net asset level unnoticed by others.
Dunedin Income Growth Investment Trust PLC 19Strategic Report
Investment Manager’s Review continued
We gave details in the Half Yearly Report of a number of higher yielding but the total return opportunity is lower
such new introductions, including Abcam, Dechra than we can find elsewhere. Examples here being BP,
Pharmaceuticals, Genus, Just Eat and London Stock HSBC, Imperial Brands and Zurich Insurance. In addition
Exchange. In the second half of the year we introduced there were some holdings with average to low yields
Ashmore, a specialist emerging market debt asset where we believed likely dividend progression insufficient
manager; Rightmove, the leading online real estate to warrant a position, such as AstraZeneca, Nestlé, Roche,
advertiser; Rentokil, the facilities management business Rolls Royce and RPC.
with a focus on pest control and hygiene; and engineer
Spirax Sarco which sells critical steam control products to We exited some holdings where we saw the quality of the
a wide range of end markets, most of which are defensive. franchises deteriorating below the high bar that we aim
These are a diverse range of businesses but common for. Essentra, GIMA TT, Inmarsat, RPC, Sage and Wood
factors include structural drivers that enable them to grow Group fall into this category. GIMA TT, an Italian listed
their revenues independently of GDP, plus sustainable maker of packaging machines for the tobacco industry,
competitive advantages that should allow them to was an unusually short term holding for us having
maintain their growth rate which in turn translates into subscribed to the IPO only last year. However, following
strong long term expansion in cash flow and dividends. meetings with other industry participants it seemed clear
that their market was developing less quickly than we had
We also initiated positions in some higher yielding anticipated and the investment thesis was not playing out.
companies to add diversity to the mix of income. The As a result we decided to sell and move on, as whilst we
companies we selected have sound business models and aim to invest with a long term horizon we have the ability
well underpinned dividends. Examples here are Rio Tinto, to be nimble and move quickly should we see good
Direct Line Insurance and Telecom Plus. reason. Finally, there were holdings we sold on valuation
grounds following relative outperformance such as
In the latter part of the year we took the opportunity to Temenos and Rotork.
increase the Company’s exposure to domestic earnings.
This may seem a contrarian move given the elevated Corporate Engagement
uncertainty over Brexit but, given the unclear outcome
A key part of the responsibility of share ownership is
and the Company’s significant exposure to overseas
corporate stewardship and engagement. Addressing the
revenues, it seemed judicious to us to reduce this
governance and risk controls of the companies we hold is
exposure and add to UK focused businesses where we can
an aspect of investing that we embrace at Aberdeen
find those of appropriate quality.
Standard Investments and it aligns well with our long term
investment horizon. The investment team takes full
To this end we introduced Countryside Properties, a well- responsibility with dedicated on-desk resource and helped
run UK housebuilder with a balanced business model that by expert advisors within the company. In addition to the
provides a degree of protection from the cyclicality of the hundreds of visits each year with executive teams, we
new-build housing market. It runs with no debt on the frequently engage with non-executive board members,
balance sheet and from an income perspective we expect risk officers and other relevant personnel from the
mid to high single digit dividend growth with the potential companies in which we invest.
for additional capital returns over time. In addition we
introduced Marshalls, the leading manufacturer of hard
Environmental and Social analysis is entrenched in our day
landscaping solutions in the UK. It has consistently
to day investment process and is the responsibility of the
progressed ahead of the market due to a combination of
investment team as opposed to sitting in a separate unit.
exposure to structural trends, market share gains and
This has been the case for over a year now and is proving
bolt-on acquisitions, with earnings further enhanced by
an effective initiative, adding an equivalent focus on these
ongoing cost efficiencies. The company manages a
issues to that which we have long applied to governance.
conservative balance sheet and as a result we see good
How the companies we invest in identify environmental
potential for dividend growth over the medium term.
and social risks is something we analyse closely and we
are increasingly finding that companies which manage
While it has been an active year for new holdings we also these risks well and place high importance on responsible
added capital selectively to existing positions, with market business practices are those that are setting themselves
volatility providing us with the opportunity to do so at up best to produce positive long term financial results.
attractive valuations. For example we topped up the
holdings of Aveva, British American Tobacco, Croda, Outlook
Diageo and RELX. In addition, we participated in equity
Our approach remains consistent and we continue to
raises for Weir Group and Genus. focus on improving the medium term income and capital
growth potential of the portfolio while maintaining
To fund these purchases we exited a number of holdings. appropriate diversity and balancing the near term
In line with our strategy, a number of these positions are requirements of the dividend. We are pleased with our
20 Annual Report 2019You can also read