Flowers of Invention: Patent Protection and Productivity Growth in US Agriculture
←
→
Page content transcription
If your browser does not render page correctly, please read the page content below
Flowers of Invention:
            Patent Protection and Productivity Growth in US Agriculture∗

                                                   Jacob Moscona†

                                                 September 1, 2021

                                                        Abstract

Patent protection was introduced for plant biotechnology in the United States in 1985, and it affected
crops differentially depending on their reproductive structures. Exploiting this unique feature of plant
physiology and a new dataset of crop-specific technology development, I find that the introduction
of patent rights increased the development of novel plant varieties in affected crops. Technology de-
velopment was driven by a rapid increase in private sector investment, was accompanied by positive
spillover effects on innovation in certain non-biological agricultural technologies, and led to an in-
crease in crop yields. Patent rights, however, could come with potentially significant costs to the con-
sumers of technology and distortions to downstream production. Nevertheless, I document that in US
counties that were more exposed to the change in patent law because of their crop composition, land
values and profits increased. Taken together, the results suggest that the prospect of patent protection
spurred technological progress and increased downstream productivity and profits.

JEL Classification: O31, O34, O43

  ∗I  am grateful to Josh Lerner for his discussion of the paper at the 2021 NBER Summer Institute. I thank Daron Ace-
moglu, Pierre Azoulay, Abhijit Banerjee, Pedro Bessone Tepedino, Kent Bradford, Dave Donaldson, Amy Finkelstein, Isadora
Frankenthal, Keith Fuglie, Claudia Goldin, Petra Moser, Nathan Nunn, Ben Olken, James A. Robinson, Karthik Sastry, Heidi
Williams, and Samuel Young for advice and comments. I thank workshop participants at MIT, Harvard, HBS, and the NBER
Summer Institute (Innovation) for helpful feedback. I am grateful to Laurie Fortis at USDA NIFA for help accessing the CRIS
data and to Jewell Little, JoAnna Gorsage, and Stephen Malone at USDA AMS for assistance compiling the Variety Name
List in compliance with the FOIA. Marina Zhang provided outstanding research assistance.
   † Harvard University and J-PAL, email: moscona@fas.harvard.edu; website: https://scholar.harvard.edu/moscona
1 Introduction
Patent protection is often listed among a set of institutions that drive long run development, and the
ability to profit from new ideas is at the heart of modern models of economic growth (e.g. Romer, 1990;
Acemoglu and Robinson, 2012). Nevertheless, our understanding of the impact of the patent system
on technological progress and productivity growth remains limited and the subject of intense debate
(e.g. Lerner, 2009; Boldrin and Levine, 2013; Williams, 2017).1 Moreover, even if the prospect of patent
protection spurs innovation, patent rights come with potential costs to the consumers of technology;
this trade off between ex ante incentives for innovators and ex post costs and distortions to downstream
production is the key determinant of the economic impact of patent rights (Nordhaus, 1969). Thus,
evaluating the economic effects of patent protection—one of the primary policy levers used to encour-
age technological progress—requires understanding its effect on innovation, on productivity, and on
the downstream consumers of technology.
This paper investigates the impact of patent rights on technology development and downstream
production by analyzing the introduction of patent rights for plant biotechnology in the United States.
While patent protection for most innovations has existed since the U.S.’s founding, protection for crop
varieties (e.g. seeds) was not permitted because living organisms and genetic material were not consid-
ered patentable subject matter (Kloppenburg, 2005, p. 262). Certain crops, however—those for which
it was feasible to produce hybrid varieties—had de facto patent protection prior to the introduction
of formal patent rights (e.g. Butler and Marion, 1985; Fernandez-Cornejo, 2004). Hybrid varieties are
generated by combining the genetic material of multiple “parent” plants and can only be produced
accurately by the developer with access to both parents. Offspring of the first generation hybrid do
not match the traits of the original variety; thus, hybrids cannot be reproduced by farmers or com-
peting inventors. This feature of hybridization afforded innovators of hybrid varieties with “the same
commercial right that an inventor receives from a patented article” (Kloppenburg, 2005, p. 102). Non-
hybrid varieties, however, once sold, are easily reproducible, and formal contracting is important to
prevent them from being saved or sold.
In one fell swoop, the legal regime changed in 1985 and inventors could for the first time claim
patent-level protection for non-hybrid varieties.2 In Ex Parte Hibberd, the US Patent and Trademark
Office ruled that seeds, plants, and plant tissue were patentable subject matter under the utility patent
statute. The ruling was a shock; in the words of William Lesser (1987):
[V]irtually overnight, and to the great surprise of many, seeds became patentable.
After the decision, Nature magazine reported: “At long last, ‘everything under the sun made by man’
[...] is potentially patentable [since the PTO] reversed its 50-year stance, and ruled that plants can be
patented under the general patent statute” (Van Brunt, 1985). This narrative forms the basis of this pa-
1 Williams (2017, p. 443) writes that there is “remarkably little empirical research” on whether stronger patent protection
induces R&D investment. Boldrin and Levine (2013, p. 3) argue that there is “no empirical evidence that [patents] serve to
increase innovation and productivity, unless productivity is identified with the number of patents awarded.”
2 Weaker forms of protection existed for some crops prior to 1985, but these, anecdotally, had little impact and were of
limited import to inventors. The history of intellectual property protection for varieties is discussed in Section 2.1 and the
relative strength of different forms of intellectual property investigated empirically in Section 4.3.
1per’s empirical design: a difference-in-differences framework that compares crops that received formal
patent protection in 1985 with a control group that had “built-in” protection prior to the introduction
of patent rights (Gupta, 1998).
In order to analyze the consequences of the introduction of patent protection, I first determine
the set of crops that are “hybrid-compatible” and therefore had de facto protection prior to 1985. The
key determinant of whether hybrid varieties can be generated for a given crop is its flower structure
(Wright, 1980; Butler and Marion, 1985; Fajardo-Vizcayno et al., 2014; Bradford, 2017). If a crop has
“perfect flowers”—flowers that contain both the male and female reproductive parts—generating a
hybrid is technologically infeasible or prohibitively costly. When the male and female flowers are sep-
arate and on different parts of the plant, generating hybrid varieties is more straightforward (Wright,
1980; Whitford et al., 2013).3 I ascertain the flower structure of all crops grown in the U.S. in order to
determine their “hybrid compatibility” and hence whether they are part of the treatment or control
group. Using this fixed characteristic of flower structure to measure hybrid-compatibility furthermore
circumvents the empirical issue that the actual development of hybrid varieties is potentially endoge-
nous to, for example, research effort. Throughout, I refer to “perfect flower” or “hybrid incompatible”
crops as treatment crops, and “imperfect flower” or “hybrid compatible” as control crops.
I empirically validate each component of this proposed identification strategy. First, I document
the sharp and substantial rise of biotechnology patenting following Ex Parte Hibberd. Second, I show
that in the biotechnology patent data that there is a strong, positive correlation between being related
to a crop with imperfect flowers and being a hybrid variety. Consistent with the agronomic literature,
flower structure is a strong proxy for the ease and prevalence of hybrid development. Third, using a
stock market event study design around patent issue dates for all plant biotechnology patents issued
to publicly traded firms, I show that being issued a patent leads to positive abnormal returns; however,
the effect is substantially lower for hybrid varieties. This result indicates that formal patent protection
is indeed substantially more valuable to innovating firms for non-hybrid technologies compared to
hybrid technologies, which have built-in protection with or without a patent grant. Finally, I show
that treatment and control crops are balanced across a range of other characteristics that determine the
location, structure, and demands of variety development. Together, these results indicate that crops
with imperfect flowers are an appropriate control group for studying the strong increase in effective
intellectual property protection for crops with perfect flowers.
In order to compare technological progress in treatment and control crops over time, I compile a
novel data set of crop-specific technology development. A common measure of innovation is patenting
activity; however, since this paper investigates the impact of the introduction of patent rights, patents
are not a useful dependent variable. Therefore, a key empirical challenge was the construction of other
measures of innovation that are observable both before and after the introduction of patent rights. I
overcome this challenge using the United States Department of Agriculture’s (USDA) Variety Name List.
3 Corn is an example of a crop without perfect flowers; nearly all corn production relies on hybrid varieties and corn
hybrids have existed since the early 20th century. Other examples are buckwheat, spinach, squashes, and cucumbers. Wheat,
on the other hand, has perfect flowers and hybrid varieties are not used. Flower structure is not the only determinant of
hybrid development, and Section 2.3 describes hybrid development in greater depth while Section 4.2 documents empirically
that flower structure is a strong predictor of hybrid technology development across crops.
2The List, which I obtained via a Freedom of Information Act request, is designed to be a comprehensive
list of all crop varieties released in each year; it is maintained in order to prevent fraud in the seed
market.4 This data set makes it possible to track crop-level innovation in new plant varieties—precisely
the technology that became patentable in 1985—before and after the introduction of patent rights.
I supplement the Variety Name List with three additional crop-level measures of research investment
and its impacts. First, I compile data on research investment by crop from the USDA Current Research
Information System (CRIS).5 The CRIS data contain both public research investment and all private
research investment directed toward research projects that received any public funding; thus, while
the measure of private investment is incomplete, I am able to (imperfectly) compare the response of
private and public investment to the availability of patent protection. Second, I compile data on crop-
specific patent grants in non-biological technologies, which were patentable during the entire sample
period. I assign patents within relevant patent classes to individual crops if the crop name appears in
the patent title, abstract, or keywords. With these data, I estimate spillover effects of patent rights for
varieties on innovation in non-biological agricultural technologies. Third, I compile measures of crop
yields in order to estimate the impact of patent rights on one component of downstream productivity.
The first main result is that the introduction of patent protection led to a dramatic increase in the
development of new crop varieties. While variety development in treatment and control crops were on
similar trends prior to 1985, treatment crops experienced a dramatic, 119% relative increase in variety
development during the ten years following the introduction of patent rights, which corresponds to
about 11 additional varieties per year for the mean crop in the sample. The effect is driven by non-
perennial crops—crops that must be re-planted every one or two years—for which profit opportunities
from recurrent variety sale were plausibly largest and patent protection is most profitable to the inven-
tor. Consistent with the historical narrative, the positive effect of patent rights on treatment compared
to control crops was driven by the fact that prior to 1985, hybrid compatible crops had a major advan-
tage in variety development which was brought to zero in the ten years after Ex Parte Hibberd, as variety
development for hybrid-incompatible crops increased substantially. The introduction of patent rights
thus induced a major shift in technology development.
The prospect of patent protection substantially increased private research investment and did not
have a significant effect on public research investment. Thus, the shift in technology development
toward newly-protectable inventions seems to have been driven by private investment, consistent with
private sector firms being more responsive to profit and patent incentives.
The impact of patent rights for a particular type of technology could be amplified or reduced by
spillover effects on innovation in technologies for which the level of protection did not change; in the
present context, for example, non-biological agricultural technology was fully patentable throughout
the sample period but still might have been affected by the change in incentives for developing crop
varieties. Spillover effects could be positive if, for example, improved varieties were complementary to
other inputs in production (e.g. a new crop variety makes it possible to improve harvester technology)
4 In the words of the USDA, the List is compiled ”from sources such as variety release notices, official journals, seed
catalogs, and seed trade publications, as well as names cleared for use by seed companies.”
5 To calculate research investment allocated to each crop in each year, I aggregate the research project-level data reported
by CRIS to the crop-by-year level using the commodity (i.e. crop) information associated with each project.
3or negative, if improved varieties became substitutes for other inputs that performed related functions
(e.g. insect resistant seeds may substitute for insecticide). I find that introduction of patent protection
for biotechnology led to an increase in patent grants for some non-biological technologies; the effect is
concentrated in mechanical technologies that, anecdotally, had complementarities in production with
improved varieties.
While the extension of patent protection increased technology development, the marginal innova-
tion induced by the patent law change may or may not have translated into changes in crop yield. This
could be for purely technological reasons or because the ability to enforce intellectual property led to
business stealing inventions that did not truly expand the technological frontier. I find, however, that
the introduction of patent protection had a discernible positive effect on crop-level agricultural yields
measured from nationally representative production data; treatment crops experienced an 11% relative
increase in crop yields during the ten years following the introduction of patent rights.
This first set of findings demonstrates that patent protection for plant varieties had a positive im-
pact on innovation. However, the fact that the prospect of patent protection encouraged technology
development—which itself could not have been taken for granted—is a necessary but insufficient con-
dition for it to have benefitted the users and consumers of agricultural biotechnology (i.e. farmers).
First, patent protection allows for monopoly pricing, which may have distorted farmers’ input choices
and increased the cost of technologies that would have been developed in the absence of patent rights
(Nordhaus, 1969; Budish et al., 2016). Critics of patent protection often argue not that patent rights fail
to encourage innovation, but rather that their distortionary effects and costs to the consumers of tech-
nology outweigh the benefits of induced innovation.6 Second, the use of improved technologies could
have led to input and land use adjustment, as well as general equilibrium price effects, that together
could dampen or amplify the impact of patent protection on downstream profits.7
Determining the impact of patent rights on downstream growth requires an analysis that captures
its impact on both technological progress and consumer costs and distortions. To do this, I focus on
fixed geographic units—U.S. counties—and estimate the impact of county-level exposure to the change
in patent law on agricultural land values. For each U.S. county, using models of maximum potential
crop yield from the Food and Agriculture Organization’s (FAO) Global Agro-Ecological Zones (GAEZ)
database, I predict the optimal crop mix and estimate the share of county land on which the model
predicts treatment crops are grown.8 If the ecological and geographic features of a county make it
more suitable for control crops, then the county was relatively less exposed to the change in patent
law. If, on the other hand, a county is more suitable for treatment crops, the county was relatively
more exposed to the change in patent law. I combine the county-level exposure measure with the
1969–2002 rounds of the US Census of Agriculture in order to estimate the impact of the patent law
6 For example, see Keteyian (2008). There are myriad news stories of biotechnology companies suing farmers for saving
patented seeds; farmers alleged they were unable to compete on the market with old cultivars and unable to afford yearly re-
purchase of modern seeds. Monsanto, however, argues that its “continuous innovative cycle” is “fueled in part by patents”
(see here: https://monsanto.com/company/media/statements/food-inc-documentary/).
7 For example, national productivity growth might have precipitated a decline in producer prices, thus eroding the impact
of more productive varieties on farm profits.
8 See Costinot and Donaldson (2012), who introduce a related methodology. I validate the GAEZ-derived exposure esti-
mates with data on the distribution of production across crops from the 1982 Census of Agriculture. All results are also very
similar using crop shares measured from the Census rather than crop shares estimated from the GAEZ-derived model.
4change on agricultural land values, capturing the net present value of agricultural profits.
The main county-level result is that exposure to the introduction of patent protection had a large
positive effect on the value of land. This result is robust to the inclusion of state specific trends as well
as to controlling flexibly for trends in pre-period land values, land devoted to agriculture, agricultural
revenues, farm size, and geographic location. According to the most conservative estimates, the in-
troduction of patent protection increased the total value of US agricultural land in 2002 by 7.5%, or
roughly $80 billion ($117 billion in 2020 USD).9 Thus, patent rights were capitalized into a substan-
tially higher value of agricultural land, consistent with the explosion in biotechnology research being
a major driving force behind recent decades’ productivity growth. (Kloppenburg, 2005).
What mechanisms drove the positive effect on agricultural land values? As might be predicted by
a Nordhaus (1969)-style model, more-exposed counties increased input spending on crop varieties.10
However, the share of land area devoted to crop production and agricultural profits both increased
in these counties, while variability in agricultural profits across years declined, suggesting that new
technology increased both productivity and resilience in the face of shocks. The impact of patent rights
on profits was driven by counties with the largest average farm size, and the introduction of patent
rights also led the number of large farms and their share of total agricultural revenue to increase.
These findings suggest that new technology disproportionately benefitted large farms, which grew to
encompass an increasing share of agricultural revenue during the sample period.11
This paper’s first set of findings contributes to a better understanding of the impact of patent incen-
tives on technology development. Intellectual property protection is central to theories of economic
growth and development; yet, because patent rights and enforcement are endogenously determined,
estimates of the impact of patent protection on technological progress are limited (Williams, 2017).
Branstetter and Sakakibara (2002) argue that Japan’s 1998 expansion of patent scope had a limited im-
pact on firms’ R&D, while Budish et al. (2015) document that private cancer research is directed away
from long-term projects and argue this distortion is driven by shorter expected patent length. Other
studies investigate cross-country changes in patent law and find little evidence of an effect (Lerner,
2002; Qian, 2007), or turn to historical periods to investigate the impact of patent protection on the
direction of innovation (Moser, 2005, 2012, 2013, 2016).12 Moreover, signing the overall relationship
between patent rights and innovation is further complicated by evidence that awarding patent protec-
tion hinders follow-on research (e.g. Murray and Stern, 2007; Williams, 2013).13
9 For reference, the total value of agricultural output in the US in 2002 was $230.6 billion.
10 This finding is consistent with producers paying higher prices for patented inputs, but could also be driven by a larger
quantity of seed purchases. The Census of Agriculture does not collect data on input quantities; nevertheless, a range of
evidence discussed in Section 6.3 suggests that finding is driven by higher prices.
11 This finding is consistent with the hypothesis that new technology had complementarities with scale, and hence dispro-
portionately benefitted large farms (Willingham and Green, 2019). Small farms were less likely to adopt improved varieties,
which often were complementary with scale and non-variety input investment; thus, small farmers of treatment crops may
have benefitted less from the productivity potential of new varieties while facing lower output prices as aggregate productiv-
ity increased. See the 2005 report by the Center for Food Safety, “Monsanto vs. U.S. Farmers,” as well as Liptak (2003). Section
C.1 investigates raw trends in profits and concentration in the US agricultural sector over the sample period in greater depth.
12 Also relevant is a growing body of work on copyright protection (Biasi and Moser, 2016; Giorcelli and Moser, 2020)
13 See also Murray et al. (2016), which implies potentially large costs of intellectual property restrictions in biomedical
research. Sampat and Williams (2019), however, find no evidence that patent protection reduces follow on research in an
analysis of patents on human genes. The present study is also linked to a related literature that suggests that receiving patent
5The second part of this paper’s analysis, which documents the relationship between patent rights
and downstream profits, builds on theoretical work arguing that the value of patent policy is deter-
mined by the extent of both induced innovation and ex post losses in the form of production distortions
and higher costs (e.g. Nordhaus, 1969; Budish et al., 2016). The county-level analysis, moving beyond
a sole focus on incentives for innovation, captures both sides of this trade-off.
This paper also deepens our understanding of the growth of agricultural biotechnology, and the
role of patent rights in recent decades’ explosion of technological progress and productivity growth.14
Intellectual property protection for plant varieties in the U.S. and other countries has been proposed
as an explanation for dramatic productivity growth during the second half of the 20th century, both
in the US and around the world (e.g. Evenson and Gollin, 2003, on variety protection and the “Green
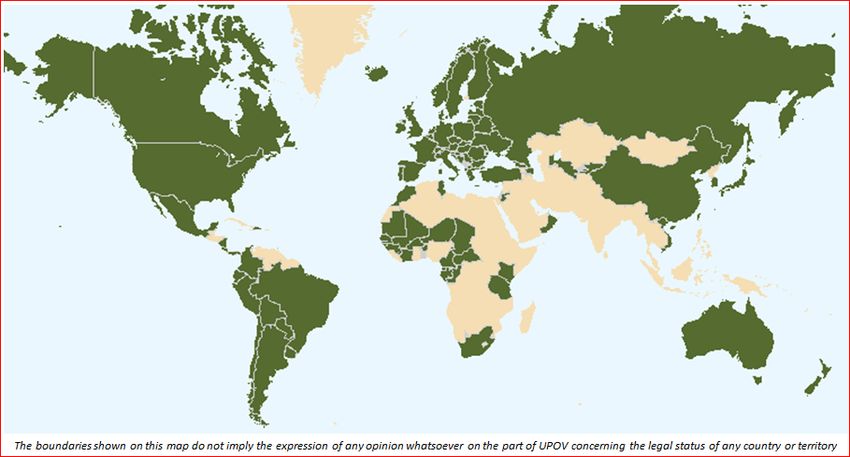
Revolution”). Since 1960, 74 countries have adopted intellectual property protection for plant varieties;
these countries are displayed on the map in Figure A1. Several more are debating whether to introduce
it; unsurprisingly, the extension of intellectual property protection is often politically contentious and
controversial (e.g. Straub, 2005). The introduction of patent protection in the US has been blamed for
declining farm profits, particularly for small farmers, as well as concentration of landholdings and
agricultural research investment (e.g. Howard, 2015; Bonny, 2017).15 This paper directly estimates the
impact of patent protection for biotechnology on US agricultural productivity and documents that they
explain part of the late-20th century growth of US agricultural biotechnology.
Finally, this paper builds on broad literature investigating endogenous technological progress and
the extent to which research investment is re-directed in response to profit opportunities. There is a
long and storied history of asking how innovation responds to incentives in the agricultural sector (e.g.
Griliches, 1957; Hayami and Ruttan, 1971; Ruttan and Hayami, 1984; Olmstead and Rhode, 1993, 2008).
I find that policy induced changes in profit opportunities had a large impact on the direction of tech-
nology development and translated into productivity growth; private research investment and novel
variety development were narrowly targeted to the crops for which profit opportunities increased the
most. This study thus also builds on the relatively small set of empirical studies that investigate the im-
pact of changing profit incentives on the direction of technological change (e.g. Popp, 2002; Finkelstein,
2004; Acemoglu and Linn, 2004; Hanlon, 2015).
The paper is organized as follows. The next section (Section 2) provides information on the history
of patent protection for plant varieties and a discussion of the features of plant breeding and biology
required for the empirical analysis. Section 3 discusses the data and Section 4 empirically investigates
the paper’s main identifying assumptions. Section 5 presents the empirical strategy and results for the
crop-level analysis while Section 6 does the same for the county-level analysis. Section 7 concludes.
protection is beneficial to firms and technology developers (e.g. Gans et al., 2008; Farre-Mensa et al., 2016; Gaule, 2018).
14 A handful of case studies focusing on individual crops have investigated the impact of historical changes in intellectual
property protection in agriculture (Alston and Venner, 2002; Naseem et al., 2005; Moser and Rhode, 2011).
15 Other work suggests that in more recent years, the rise of venture capital funding and “agtech” start-ups has pushed the
industry away from concentration (Graff et al., 2020). The relationship between patent law and research funding structure is
beyond the scope of this paper but a potentially exciting area for future work.
62 Background
2.1 Intellectual Property Protection for Plant Varieties
While most inventions have been considered patentable subject matter since the U.S.’s founding, this
was not the case for inventions that are classified as living organisms. Agricultural inventions like
new fertilizers, tractors, harvesters, etc. have been patentable since the 18th century; however, utility
patent protection for new plant varieties—for example, seeds and runners—was not available until
the legal regime changed in 1985 with the USPTO’s Ex Parte Hibberd decision. This meant that, prior
to 1985, farmers were permitted to save seeds from one season to the next, effectively “re-making”
the invention and substantially limiting the extent to which inventors could profit from technology
development and sale (Kloppenburg, 2005, p. 265-6)
Before Ex Parte Hibberd, only certain weaker forms of intellectual property existed for seeds. The
Plant Patent Act of 1930 introduced some limited protections for vegetatively propagated plant vari-
eties (i.e. plants that can reproduce asexually).16 The Plant Variety Protection Act (PVPA) was passed
by the US Congress in 1970, and introduced seed certificates that afforded breeders with some limited
protections. However, neither law prevented farmers from saving and re-using seeds, or limited the
extent to which other researchers could use and build on the protected variety in their breeding.17
Consistent with the limited extent of protection, neither the 1930 nor the 1970 law was the subject of
substantial infringement litigation (Kershen, 2003). Still in 1982, most non-hybrid varieties were saved
from one season to the next, preventing innovators from profiting from selling their inventions; for
example, over 90% of planted wheat was saved from the previous year (McMullen, 1987, pp. 86-7).
The legal regime changed in 1985 with the Ex Parte Hibberd decision by the Patent and Trademark
Office Board of Appeals. In 1980, the Supreme Court had ruled in Diamond v. Chakrabarty (5-4 deci-
sion) that a genetically modified bacterium that was useful for breaking down crude oil was patentable
subject matter because “the patentee has produced a new bacterium with markedly different charac-
teristics from any found in nature and one having the potential for significant utility [...] His discovery
is not nature’s handiwork, but his own.” However, the USPTO was still not open to patent protection
for plants or plant parts; the few applicants seeking protection for seeds or plant parts were soundly
rejected (Kloppenburg, 2005, p. 263). In 1985, a patent examiner rejected a patent application for a
maize variety; however, the breeder argued that the variety was patentable subject matter following
the Chakrabarty decision. The developer appealed the decision, and the US Patent and Trademark
Office (USPTO) Board of Appeals and Interferences reversed the rejection in Ex Parte Hibberd.
Following the decision, the USPTO released a notice stating that “the Patent and Trademark Office
is now examining applications including claims to plant life–e.g., plants per se, seeds, plant parts”
(Hodgins, 1987, p. 88). The change in intellectual property regime was a shock and major break
from long-standing precedent (Van Brunt, 1985), and was almost immediately taken advantage of by
breeders and breeding companies (Lesser, 1987). In 1986, there was a surge of patent applications
16 See,
for example, Moser and Rhode (2011), who discuss the introduction of plant patents and argue that they had a
limited impact on innovation and technological progress.
17 Section 4.3 empirically investigates the value to innovating firms of PVP certificates compared to patents.
7due to the Ex Parte Hibberd ruling, followed by a surge in patent grants in the years that followed
(see Hodgins, 1987, and Figure 2 below). Seed patents were actively enforced by seed companies
themselves (Weiss, 1999), both through licensing agreements with third parties and through direct
monitoring and investigation of farmers who purchased or leased patented technology (Blair, 1999,
pp. 326-7).18 Section A.2 discusses Ex Parte Hibberd and its impact in greater depth.
2.2 Hybridization and De Facto Protection
Even in the absence of formal patent rights, hybrid plant varieties have de facto intellectual property
protection (e.g. Butler and Marion, 1985; Fernandez-Cornejo, 2004; Fajardo-Vizcayno et al., 2014; Brad-
ford, 2017). In the words of Fernandez-Cornejo (2004), hybrid seeds “provided the private sector a
natural method of protecting plant breeding investments” since the saved offspring of hybrid seeds
“produc[e] substantially lower yields, encouraging farmers to repurchase seeds every year.”19 The re-
lationship between this feature of hybrids and intellectual property protection is explicit. Fernandez-
Cornejo et al. (1999) juxtapose protection for non-hybrid and hybrid varieties: “[A]ccording to the
Patent Act of 1790, seeds were considered ‘products of nature’ and could not be patented. Hybrid
seed technology, however, required farmers to repurchase seeds each year,” allowing breeders and
inventors to circumvent the absence of formal protection (p. 19).
As a result, according to Kloppenburg (2005, p. 102), hybrid varieties have “the same commercial
right that an inventor receives from a patented article.” Gupta (1998, p. 1320) refers to this as “built-in”
patent protection that is available for some crops but not others. He notes that in self-pollinated crops
“like wheat, rice, barley, beans, etc [...] the commercially grown cultivars are actually ‘pure lines’ so
that the yield does not decline and harvested seeds can be used for sowing the next crop.” Prior to
the introduction of formal intellectual property, breeders of certain crops could reap the rewards of
their innovation by making use of hybrids’ “built-in” patent protection. Developers of other crops for
which hybrid varieties were not feasible to produce, however, had little if any recourse.
Therefore, when formal patent protection was introduced, it affected non-hybrid varieties and
crops for which hybrid varieties were scarce or difficult to generate (Lesser, 1987). Agricultural firms
and researchers are keenly aware of this distinction. Facing criticism for enforcing patent protection
by suing farmers who saved its patented seeds under the new regime, Monsanto Company responded
that farmers had not been saving hybrid seeds for decades and that patent protection was merely an
extension of the protection that hybrid varieties had always received.
Why do hybrid varieties have de facto protection? Hybrid varieties are produced by crossing two
parent plants to produce the first generation hybrid (F1). Seeds produced by the F1 hybrid—those that
could be collected by the farmer—do not retain the beneficial characteristics of the first generation, and
thus are often of no use. Therefore, farmers are forced to return to the breeder every time they want
18 Kloppenburg (2005, p. 266) discusses the several enforcement strategies available to seed companies after Ex Parte Hib-
berd, including monitoring of farmers, collecting information from dealer networks or neighbors, and selective prosecutions
to demonstrate the potential cost of being found in violation. He concludes, “Enforcement of property rights in patented
seed is a practical proposition and even at modest level may provide substantial returns to seed firms.”
19 This is still relevant for farming today. According to the University of Illinois Extension program, for example, hybrid
seeds are “sterile or [do] not reproduce true to the parent plant” (Bhalsod, 2021). As a result, hybrids are “bad for seed saving
and you will need to buy new seeds every year.”
8a new seed and cannot save, sell, or replicate the improved variety. Moreover, without direct access
to the inbred parent varieties used to generate the F1 hybrid, it is not possible for other breeders, seed
marketing firms, or researchers to reproduce or sell the F1 variety. When farmers use non-hybrid
varieties, on the other hand, they can save seeds for many seasons without sacrificing the beneficial
characteristics of the purchased seed and need not re-purchase the seed from the developer. Moreover,
other breeders can use non-hybrid varieties directly in the breeding process and build on the varieties’
favorable characteristics.
The genetic reasoning behind this difference can be illustrated by a simple example. Suppose a
breeder produces a hybrid variety by combining the male and female gametes of parent plants, Parent
1 and Parent 2. Further suppose that at a particular allele Parent 1 is homozygous dominant and Parent
2 is homozygous recessive. That is, Parent 1 has two copies of the dominant gene (AA) and Parent 2 has
two copies of the recessive gene (aa). At that allele, the hybrid variety will be heterozygous (Aa) with
probability 1. However, the offspring of the hybrid will be heterozygous at that allele with probability
0.5—with probability 0.25 it will be AA and with probability 0.25 it will be aa. Thus, the probability
that offspring produced by the farmer matches the improved variety at this allele is 0.5.
In reality, the beneficial properties of a variety are not stored on a single allele since “hybrid vigor”
results from the combination of many alleles and their interactions; indeed, the F2 hybrid can even
have worse performance than either of the original parent varieties (e.g. McMullen, 1987; Fajardo-
Vizcayno et al., 2014). Even if there were only alleles A through Z, the probability that the farmer
reproduces the improved variety with any given offspring would be: (0.5)26 = 0.0000000149. While
quite stylized, this example illustrates that the probability that a farmer reproduces the desired charac-
teristics of the hybrid variety are vanishingly small. Non-hybrid varieties, however, can be reproduced
exactly generation after generation and do not need to be re-purchased from the developer.
Moreover, even if by random chance the second generation plant were comparably productive to
the original hybrid, the farmer would have no way to re-produce or breed it. As the stylized example
illustrates, hybrids can only be uniformly produced because the parent strains are highly inbred (that
is, they are homozygous at all alleles); when two highly inbred strains are hybridized, the offspring
will be uniform and identical. In the case of the example, the F1 hybrid will always carry Aa. However,
subsequent breeding of non-inbred strains which are heterozygous at many alleles will not generate
uniform, predictable, or necessarily productive offspring (McMullen, 1987).20
2.3 Hybrids and Flower Structure
The key characteristic that determined whether or not a hybrid variety could be developed is the
crop’s flower structure, and in particular, whether the crop has “perfect” or “imperfect” flowers (e.g.
20 Early seed companies often marketed F2 hybrids, which were the offspring of two specifically chosen F1 hybrid varieties,
each of which was generated from two highly in-bred parents. The reason that F2 hybrids were commercialized was not
because they were as productive as their F1 counterparts, but because it was easier to breed them at scale. Since the F2
hybrid is the cross between two hybrid varieties, the parent plants of the F2 are themselves productive hybrids and can
be produced in large quantities; the parent plants of the F1 hybrids, which are in-bred, are more challenging to produce at
scale. Thus, while F2 hybrids have been marketed, they are the offspring of very specifically targeted and chosen F1 hybrids
parents, and are themselves not as productive as the F1 generation (McMullen, 1987, p. 47).
9(a) Perfect Flower (b) Imperfect Flower (Pistillate) (c) Imperfect Flower (Staminate)
Figure 1: Perfect vs. Imperfect Flowers. This figure shows the distinction between perfect flowers, which
contain both reproductive organs (Figure 1a), and imperfect flowers, which have either only the “female” (Figure
1b) or only the “male” (Figure 1c) reproductive organ.
Wright, 1980; Butler and Marion, 1985; Fajardo-Vizcayno et al., 2014; Bradford, 2017).21 The distinction
between perfect and imperfect flowers is displayed in the image in Figure 1. Perfect flowers have both
the male and female parts of the plant in the center of the same flower; this is illustrated by Figure 1a,
in which the pistil (i.e. “female” reproductive organ) and stamen (i.e. “male” reproductive organ) are
on the same flower. Crops with imperfect flowers have the male and female reproductive material on
different parts of the plant; this is illustrated by Figures 1b and 1c, both of which would be on the same
plant but which contain either only the pistil or only the stamen.
When a crop has perfect flowers, it is often painstakingly difficult or impossible to generate new hy-
brids by combining genetic material from multiple plants (Whitford et al., 2013; Bradford, 2017). Sep-
arating and re-combining the male and female reproductive material (e.g. preventing self-pollination,
separately isolating the genetic material, etc.) is often technologically infeasible or extremely costly in
crops with perfect flowers. Wheat is a crop with perfect flowers, and the penetration of hybrid va-
rieties is very limited; as a result, in 1982 over 90% of land area devoted to wheat was planted with
saved (as opposed to purchased) seeds, making it challenging for breeders to profit from wheat variety
innovation. This is strikingly different from the case of corn, a staple crop with imperfect flowers; just
5% of land area devoted to corn was planted with saved seeds and breeders of hybrid corn varieties
could profit from selling their invention to farmers each season (McMullen, 1987, pp. 86-7).22 Other
examples of crops with perfect flowers are barley, beans, carrots, and turnips, while examples of crops
with imperfect flowers include corn, squashes, cucumber, and spinach.
21 See also McMullen (1987, pp. 43-45) on hybrid development in the 1980s and its largely exclusive focus on crops with
imperfect flowers (referred to as “monoecious” crops in the text).
22 The shares for cotton and soybeans, which have perfect flowers, were somewhat smaller than wheat, at 50% and 45%
respectively; however, the land planted with saved seed corresponded to the overwhelming majority of market value, at
97.6% for cotton and 82.8% for soybeans. To my knowledge, McMullen (1987) is the only source with data on the prevalence
of seed saving in the US in any year; it is a fortunate coincidence that these data are from just prior to Ex Parte Hibberd.
10Flower structure is not the only determinant of hybrid development. Hybrid varieties have been
developed for some crops with perfect flowers, most prominently using a technique referred to as cy-
toplasmic male sterility (CMS), which prevents open pollination (Havey, 2004). However, hybrids for
crops with perfect flowers were mostly developed recently and have far more limited penetration in
production.23 Section 4.2 documents empirically that this simple feature of flower structure—having
imperfect flowers—is a strong predictor of hybrid variety development. Moreover, since flower struc-
ture is fixed, it is not biased by endogenous investment in crop-specific technology and efforts to de-
velop advanced breeding techniques; this makes it an ideal pre-determined measure of the potential
impact of patent rights. Consistent with this, I show in Section 4.4 that perfect flower structure is not
correlated with a broad range of crop-specific characteristics that might otherwise affect breeding. Fi-
nally, I document below that the main results are robust to categorizing crops for which CMS systems
have been developed as control-group crops, or excluding these perfect-flower crops for which hybrids
have been developed from the analysis entirely.
Throughout the paper when I refer to a crop as “hybrid compatible” or in the “control group,” this
means that the crop has imperfect flowers. When I refer to a crop as “hybrid incompatible” or in the
“treatment group,” this means that the crop has perfect flowers.24
3 Data
3.1 Crop Treatment Status and Other Biological Characteristics
In order to identify which crops were affected by the introduction of patent protection, I constructed
a data set of the structure and reproductive process of all crops produced in the United States. The
main independent variable is an indicator variable that equals one if a crop is not hybrid compatible.
To measure this, for all crops grown in the United States I determined whether or not the plant has
perfect flowers. This is used throughout the empirical analysis as a reduced form measure of hybrid
compatibility. In total, this information was compiled from 339 separate sources. This information is
used to construct the key independent variables in the analysis.25
In order to investigate whether crop-level treatment is correlated with other crop-level character-
istics that affect crop breeding, I compile crop-level covariates from the ECOCROP Database, which
contains information about plant-specific characteristics and growing conditions for over 2,500 species.
The database, discussed at greater length in Moscona and Sastry (2021a), was compiled from a sweep-
ing set of agronomist and expert surveys conducted during the early 1990s and contains a range of
23 The first hybrid soybean, for example, was bred in 2003 by a team of Chinese scientists who claimed that the key
challenge that had faced global efforts to develop a soybean hybrid was the “difficulty involved in changing the plant’s
trait of self-pollination” (See the news release here: http://en.people.cn/200301/17/eng20030117_110279.shtml). The
first hybrid variety for barley, despite being a globally important crop, did not occur until it was released, following
years of research investment, by Syngenta in 2003, which is after this paper’s main sample period (See here: https:
//www.cabi.org/agbiotechnet/news/2886). Even still, the penetration of hybrid varieties for barley remains limited.
24 Because vegetatively (i.e. asexually) reproducing crops can also be re-produced by the farmer, I also categorize all crops
that can reproduce vegetatively in the treatment group, but show throughout that the results are robust to controlling for
vegetative reproduction.
25 Table B1 reports treatment status of all seed crops in the Variety Name List, discussed below, along with a series of crop-
level characteristics.
11plant characteristics, in addition to upper and lower “cut-off” values for a range of environmental
characteristics (e.g. temperature, rainfall) beyond which crop productivity declines.
3.2 Crop-Level Innovation
I combine multiple sources to compile a consistent data set of crop-specific measures of technology
development, research investment, and productivity. First, to estimate the number of new varieties
developed in each year for each crop, I rely on the USDA Variety Name List. The Variety Name List,
obtained through a Freedom of Information Act (FOIA) request for this paper, is a list of all released
crop varieties known to the USDA. The USDA collects data on all released varieties in order to prevent
fraud in the seed market; while the list likely has omissions, it is designed to be as comprehensive
as possible and uses a broad range of sources in order to identify crop varieties.26 Breeders have an
incentive to report new varieties to the USDA for inclusion in the list because farmers frequently check
the List to make sure that varieties they purchase were cleared. The List is structured as a series of
PDF files with separate columns for the crop name (e.g. alfalfa, sorghum), variety name (e.g. 13R
Supreme, Robinson H-400 B), and the year when the variety was released.27 I digitized the full list and
use it to compute the number of varieties released for each crop in each year. This data set is essential,
because it makes it possible to track biotechnology development for each crop, both before and after
the introduction of patent rights.
Second, to measure crop-specific research investment, I rely on data on project-level R&D spend-
ing from the USDA Current Research Information System (CRIS).28 CRIS began reporting research
investment data in 1970, at the request of the US Secretary of Agriculture, in order to better document
research funding in agriculture and how it changes over time. Crucially, the CRIS data also report the
commodity or commodities that are the focus of each research project. For each project focusing on
plants or crops (as opposed to livestock, machinery, etc.), funding is broken down by crop; if the project
covers multiple crops, then the share of funding devoted to each crop is also reported. I aggregate the
project level data to compute a crop-level measure of R&D investment for each crop over time.29 CRIS
compiles project-level data on R&D expenditure for all research projects that received any public sup-
port; for all projects that received funding from any public source, the CRIS data also asks researchers
to report private funding received for the project.30 Therefore, for the set of projects in the data, it is
possible to investigate the impact of patent rights on both private and public investment. A caveat
is that the data set does not contain all private R&D, only private R&D for projects that received any
public funding; this makes directly comparing the level of public and private investment impossible,
and I am not aware of any other data set measuring crop-level private research funding.
26 According to the USDA, it is compiled ”from sources such as variety release notices, official journals, seed catalogs, and
seed trade publications, as well as names cleared for use by seed companies.”
27 While sometimes the day and month are listed, in most cases during the sample period, only the year is included. While
in later years, the List often reports the company or breeder name for each variety, unfortunately this did not begin until after
the period under investigation. For recent years, the names of varieties in the List are publicly available; however, the release
years and all the data for the earlier part of the sample period required the FOIA request.
28 For a description of the raw data, see here: https://cris.nifa.usda.gov/aboutus.html
29 When a single project covers multiple crops, I assign each crop its corresponding share of the project’s total funding.
30 Sources of public investment include the USDA and its research agencies, the National Institute of Food and Agriculture
(NIFA), state agricultural experiment stations, land grant universities, and other state and local institutions
12Third, to measure crop-level innovation for all technologies other than crop varieties (i.e. non-
biological technologies), as well as investigate trends in biotechnology patenting itself, I use patent
data. Using the patent database PatSnap, I computed the number of patents in Cooperative Patent
Classification (CPC) classes that correspond to agriculture, excluding husbandry.31 To match patents
to crops, I searched for the name of each crop in the Variety Name List in all patent titles, abstracts, and
keyword lists. Thus, for each crop, CPC class, and year in the sample period, I estimate the number of
patented technologies.
Finally, I measure the average yield of each crop in the US using data from the Food and Agriculture
Organization (FAO) and the USDA. These crop-level production data sets are both standard.
3.3 County-Level Data
I construct a county-level panel from the 1969-2002 rounds of the US Census of Agriculture (Haines,
2005).32 The Census of Agriculture contains a range of information about the US agricultural sector
and agricultural production, including county-level land value, agricultural revenue, expenditures on
a series of inputs, farm size, and the area under cultivation for a broad set of crops. It also reports the
number of farms in each county within a series of size and revenue bins.
In order to construct the county-level treatment variable, I used data on the predicted maximum
potential yield for all crops available from the Food and Agriculture Organization (FAO) Global Agro-
Ecological Zones (GAEZ) database. These data are reported by the FAO as a (roughly) 9.25km ×
9.25km raster grid, with each grid cell containing the maximum attainable yield for a given crop in
that grid cell based on ecological and topographical characteristics of the cell and characteristics of the
crop in question.33 The potential yield model is constructed using parameters derived from controlled
experiments, and not from data on actual agricultural inputs and output (Costinot et al., 2016, p. 18).
In Section 6.1, I use these crop-specific maximum potential yield data in concert with the crop-level
treatment variable to construct a county-level measure of exposure to the introduction of patent rights.
4 Descriptive Evidence and Validation of the Empirical Strategy
This section empirically investigates the historical narrative and features of innovation in plant biotech-
nology that underpin the paper’s empirical framework. I document that the rise of biotechnology
patenting after 1985, and differences across crops in the characteristics of patent grants, are both con-
sistent with the time-series and cross-crop variation described in Section 2.
31 This includes CPC classes A01B, A01C, A01D, A01F, A01G, A01H, and A01N, i.e. all CPC classes that relate to non-
livestock agriculture.
32 The census years included in the analysis are 1969, 1974, 1978, 1982, 1987, 1992, 1997, and 2002.
33 The FAO GAEZ maximum potential yield data “...reflect yield potentials with regard to temperature, radiation and
moisture regimes prevailing in the respective grid-cells. The model requires the following crop characteristics: Length of
growth cycle (days from emergence to full maturity); length of yield formation period; maximum rate of photosynthesis at
prevailing temperatures, leaf area index at maximum growth rate; harvest index; crop adaptability group; sensitivity of crop
growth cycle length to heat provision; development stage specific crop water requirements, and coefficients of crop yield
response to water stress” (FAO GAEZ)
13600 3000
Number of Non-Biological Patents
Number of Patents in A01H5/6
2500
400 2000
1500
200 1000
500
0 0
1975 1980 1985 1990 1995 1975 1980 1985 1990 1995
Year Year
Patent Applications Patent Applications
Patents Issued Patents Issued
(a) All Angiosperm Patents (CPC A01H.5 & A01H.6) (b) Non-Biological Patents (A01B & C & D & F & N)
Figure 2: Patents: Time Trend. Figure 2a displays the count of patent applications and patents issued
in CPC classes A01H.5 and A01H.6 (novel plant varieties) while Figure 2b displays the count of patent
applications and patents issued in non-biological CPC classes related to crop agriculture (CPC A01B,
A01C, A01D, A01F, and A01N) over the same sample period.
4.1 Biotechnology patenting burgeoned after Ex Parte Hibberd
Figure 2a displays the time series trends in Cooperative Patent Classification (CPC) classes most closely
linked to new plant varieties (see Section A.3 for a more detailed description).34,35 There is no evidence
of patents being issued prior to 1985; patent applications increase in the year following Ex Parte Hibberd
and the surge in patent issuing occurs shortly thereafter, following an appropriate lag. Figure 2b
documents the time series trend in patenting for CPC classes related to non-biological agricultural
technologies; Figure A2 shows the same for each non-biological patent class individually. No marked
change after 1985 is apparent and the trend is relatively flat throughout the sample period, suggesting
the pattern in Figure 2a is not related to any aggregate trend in technological progress.
The sharp change in patent protection policy was mirrored by a marked trend break in crop-specific
research investment. Figure 3a displays the trend in research investment relative to 1985, averaged
across crops in the USDA CRIS data. The dotted red line extends the linear trend estimated from
the pre-period (1975-1984) time series. While private research investment increased throughout the
34 Some other work attempts to identify all patents related to plant biotechnology using a combination of restrictions based
on patent class and the identity of the applicant, after combing through patent texts. These analyses also do not identify any
utility patents issued for plant biotechnology in the US until 1985 (Graff et al., 2003). An alternative strategy pursued by
Kloppenburg (2005) is more subjective, and relies on a range of sources and readings of individual patent grants; this process
identified 12 relevant patent grants issued from 1980-1984, all of which were related to process innovations and none of which
protected an individual variety or plant part (p. 264). Ex Parte Hibberd represented a clean break from pre-existing policy.
35 While Figure 2a focuses on a sample of all patents related to novel angiosperms (CPC classes A01H.5 and A01H.6),
Figure A3a documents a similar pattern for the entire A01H CPC class, which is reassuring because it confirms that the
pattern documented in Figure 2a is not driven by any detail of patent classification or the failure to re-classify patents related
to plants and plant parts into the correct CPC class after the fact. Figure A3b shows a similar pattern on a sample of patents
categorized only as angiosperm seeds (CPC class A01H.5.10). This definition of affected patents is certainly too restrictive,
since (as noted in the USPTO CPC scheme handbook), many seed patents have been re-classified under a series of different
sub-classes. However, the pattern of virtually zero patents prior to 1985 and a large surge thereafter is very similar.
14You can also read