GRAINS RESEARCH UPDATE - DRIVING PROFIT THROUGH RESEARCH ALLORA QUEENSLAND - GRDC
←
→
Page content transcription
If your browser does not render page correctly, please read the page content below
ALLORA
                                   QUEENSLAND
                                   THURSDAY 8TH MARCH, 2018

GRAINS RESEARCH
UPDATE
DRIVING PROFIT THROUGH RESEARCH

                     grdc.com.au
GRDC Welcome

Welcome to the 2018 GRDC Grains Research Updates
Ensuring growers, advisors and industry stakeholders are informed about the latest research and
development outcomes in their quest to improve on-farm profitability is a key role of the annual
Grains Research and Development Corporation (GRDC) Updates.
As an industry we face new challenges in terms of climate variability, technology and market
conditions, so it is important for all of us to have up-to-date knowledge to make informed decisions
and drive practice change.
Last season, New South Wales and Queensland grain growers experienced everything from
moisture stress, to heat stress, frosts and waterlogged paddocks. This highlights the importance
of robust and rigorous research to help underpin profitability across a range of climatic and
environmental conditions.
It also emphasises the value of GRDC investments into regional extension to equip growers and
advisors with the information and support they need to make key farm management decisions.
For 25 years, the GRDC has been driving grains research capability and capacity with the
understanding that the future of Australian grain growers’ hinges on relevant, rigorous, innovative
research that delivers genuine profitability gains.
Despite the challenges the grains industry remains confident about the future, willing to embrace
new concepts, and keen to learn more about innovations and technology that bring cost
efficiencies, promote sustainability and grow productivity.
The GRDC Updates deliver research direct to growers, agronomists and industry. This year the
Updates will offer information from the latest research and development from short- and medium-
term investments that address on-farm priority issues from farming systems, agronomy, soils,
weeds to pests and diseases.
So I hope you enjoy the Updates and that the events provide a valuable opportunity for learning,
knowledge sharing and networking. I encourage you to use these events to interact with GRDC
staff and GRDC Northern Panel members, who are committed and passionate about your success
and the future of the northern grains industry.

Jan Edwards
GRDC Senior Regional Manager North
Allora GRDC
                                      Grains Research Update
                                     Thursday 8th March, 2018

Time       Topic                                                    Speaker(s)
9:00 AM    Welcome
           Setting the farm up for automation; options for
           establishing broadband connectivity; sensors;            David Lamb
9:10 AM
           telemetry; data capture and management ‐ experience      (UNE )
           from the UNE SMART Farm and elsewhere
           Chickpea: temperature and other factors affect           Andrew Verrell
9:35 AM
           flowering, pod set and yield                             (NSW DPI)
           Chickpea water use efficiency. Neutron probes, where
                                                                    Kerry McKenzie
9:55 AM    and when chickpeas draw water from and
                                                                    (DAF Qld)
           manipulating biomass
           How much N is fixed by different pulse crops and how     Nikki Seymour
10:25 AM
           does agronomy and season impact the amount fixed?        (DAF Qld)
10:45 AM   Morning tea
           Calculating how much N is needed in pulse‐cereal         Howard Cox
11:15 AM
           rotations                                                (DAF Qld)
           Panel discussion ‐ implications for decision making in
11:35 AM
           2018
                                                                    Peter Hayman
11:50 AM   Understanding and managing frost risk
                                                                    (SARDI)
           Farming systems impact on nitrogen and water use         Lindsay Bell
12:25 PM
           efficiency, soil borne disease and profit                (CSIRO)
12:55 PM   Lunch
                                                                    Ross Kingwell
                                                                    (AEGIC Senior Economist)
           Analysis of Australia’s competitive position in global
1:45 PM                                                             & Peter White
           grain markets and relative supply chain costs
                                                                    (AEGIC Senior Projects
                                                                    Manager)
                                                                    Michael Widderick
           Treat your weeds badly ‐ deprive them of sunlight and
                                                                    (DAF Qld) and
2:25 PM    space ‐ crop competition research in the northern
                                                                    Bhagirath Chauhan
           grains region
                                                                    (QAAFI)
           The P story thus far – how much, when, how and with      Mike Bell
2:55 PM
           what expected benefit?                                   (QAAFI)
3:25 PM    Close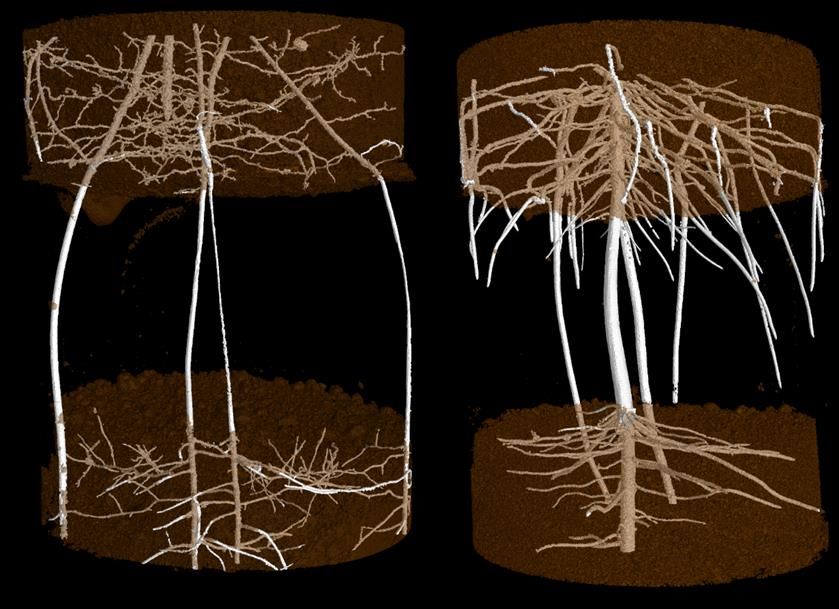
3

                                                                                                                                                Allora GRDC Grains Research Update 2018
                                                               Contents

Connecting to our farming future ......................................................................................... 4
  David Lamb

The impact of wheat residue on air temperature in the canopy & phenology of chickpea in
2017 ...................................................................................................................................... 7
  Andrew Verrell, Kathi Hertel, Brooke McAlister and Matthew Grinter

Preliminary data on phenology of Australian chickpea cultivars in the northern grain belt
and prebreeding for heat avoidance traits ......................................................................... 14
  Angela L. Pattison, Helen Bramle and Richard Trethowan

Chickpea agronomy and water use with neutron moisture meters ................................... 22
  Kerry McKenzie, RCN Rachaputi, Doug Sands

How much nitrogen is fixed by pulse crops and what factors affect fixation? ................... 27
  Nikki Seymour, Kerry McKenzie, Steve Krosch

Calculating how much N is needed in pulse‐cereal rotations ............................................. 32
  Howard Cox

Panel discussion on nitrogen & pulse crops‐ implications for decision making in 2018 ..... 40

Spring frost damage in northern GRDC region in 2017 – a long term risk management
perspective ......................................................................................................................... 41
  Peter Hayman, James Risbey and Dane Thomas

Farming system impact on nitrogen & water use efficiency, soil-borne disease and profit 50
  Lindsay Bell, Kaara Klepper, Jack Mairs, John Lawrence, Andrew Zull

Are Australian supply chains getting cheaper? ................................................................... 60
  Peter White, Ross Kingwell, Chris Carter

Deprive weeds of sunlight and space ‐ crop competition research in the northern grains
region. ................................................................................................................................ 68
  Michael Widderick, Adam McKiernan, Greg Harvey, Linda Heuke, Michael Walsh and
  Bhagirath Chauhan

The P story so far – an update on deep P research findings ............................................... 82
  Mike Bell, David Lester, Doug Sands, Rick Graham and Graeme Schwenke
Connecting to our farming future
                                                  David Lamb, Precision Agriculture Research Group, University of New England

                                          Key words
                                          SMART farm, sensors, telecommunications, technology, future

                                          Call to action/take home messages
                                          The progression of telecommunications and technology must be accompanied by education and
                                          extension. A recent survey identified that more that 60% of Australian farmers did not know of on-
                                          farm connectivity options or who to talk to about getting connected. And ‘connectivity is king’. Lack
                                          of connectivity is identified as one of THE constraints to adopting tools that improve productivity,
                                          safety and workflow. There are many challenges and opportunities of getting connected into a
                                          SMART farming future that, in 5-10 years, will just be farming. Farmers need to understand the
                                          basics of how connectivity works to be able to make informed decisions when getting connected.
                                          Government, policy makers and telco providers need to understand what farmers need and why.

                                          Introduction
                                          The role of the internet in agriculture is fast approaching a ‘third wave.’ The first wave was
                                          connecting people to data via the World Wide Web (1990s); the second wave was about connecting
                                          people to people e.g. through Facebook and Twitter (2000s). The third wave will connect people to
                                          ‘things’ (2010 onwards). These waves are not specific to agriculture. Developments in the
                                          agricultural field are contained within and mirror wider technological progressions that have led us
                                          to a place where every part of our lives relies on an internet connection.
                                          In terms of on-farm developments, advances in wireless sensor networks coupled with in-situ, low-
                                          cost machine, crop, animal and asset sensors; the so-called ‘internet of things’ means our farms and
                                          fields will become sources of high-quality, real-time management data. Big data is really made up of
                                          lots of small data, and will become increasingly useful in day-to-day and long-term management
                                          decisions. Some of this data will be utilised alongside intelligent and autonomous systems operating
                                          both on ground and in the air.

        4                                 The SMART farm
                                          I lead the University of New England’s SMART Farm project (Sustainable Manageable Accessible
                                          Rural Technologies Farm). UNE has transformed a 2,900 ha, predominantly sheep farm into a SMART
Allora GRDC Grains Research Update 2018

                                          Farm which showcases the latest technologies aimed at improving productivity, environmental
                                          sustainability, safety, workflow and social/business support networks on Australian farms
                                          (www.une.edu.au/smartfarm, 2018). Buts is a CONNECTED farm; linked via AARNet and the national
                                          broadband network (fibre, terrestrial wireless AND satellite) because the predominantly grazing
                                          SMART Farm is a national demonstrator site.
                                          Examples of the types of sensors we use include 100 soil moisture probes, which create a living map
                                          of soil moisture. The farm also has another telemetry network that allows devices to be ‘plug-and-
                                          played’ ranging from monitoring water use in trees, pasture growth through to honey accumulation
                                          in beehives.
                                          We are also working with livestock tracking and are investigating opportunities around developing
                                          fingerprints of animal behaviour ranging from when they’re attacked, if they’re calving, whether
                                          they have internal parasites and also how much pasture is left behind from grazing.
                                          Live satellite derived pasture data is available through the Pastures from SpaceTM program. This
                                          provides estimates of pasture production during the growing season by means of remote sensing.
5
Satellite data is used to accurately and quantitatively estimate pasture biomass or feed on offer, or

                                                                                                            Allora GRDC Grains Research Update 2018
combined with climate and soil data is used to produce estimates of pasture growth rate
(https://pfs.landgate.wa.gov.au/).
The SMART Farm is just an example of what the future of farming will look like- buts it’s connected
to the hilt. In order for that future to be realised across 137,000 Australian farms, action is required
in the telecommunications sector.

Telecommunications
As well as sensor technology and big data, telecommunications is a key enabling part of the SMART
Farming future. In 2016, the Commonwealth Department on Agriculture and Water Resources
initiated a Rural R&D for Profit Research Project entitled ‘Accelerating Precision Agriculture to
Decision Agriculture’ or ‘P2D’. One of the aims the project was to deliver ‘recommendations for data
communications to improve decision making - or decision agriculture’; effectively to undertake a
‘telecommunications review’ for agriculture. During the period of August 2016 – June 2017, a series
of eight workshops, numerous phone interviews and site visitations around Australia sought to
understand the current status of on-farm telecommunications at the farm level in support of a big
data future for agriculture. This review sought a ‘producer-eye’ view, seeking to understand the
dimensions of key enabling telecommunications utilised by producers, factors constraining the
uptake or adoption of available enabling technologies, as well as investigating the future
telecommunications needs and opportunities. Information was solicited from not only producers,
but also developers and providers of technologies and data services, as well as looking at the
developments ‘top-down’ such as the ACCC Inquiry into Domestic Mobile Roaming and the
Productivity Commission Review of the Universal Services Obligation (USO).
In the last couple of years the notion of telecommunications as a ‘critical infrastructure’ for rural and
regional Australia, and in particular in agriculture, has at last well and truly taken root. Over this
period there has also been a significant increase in the development of end-to-end
telecommunications technologies and services offered to producers. These so-called ‘second-tier’
telecommunications providers (as distinct from the ‘big telcos’), also offer their own transmission
backhaul capability and in some cases associated cloud based services. Moreover they seek to
‘guarantee’ speeds. Second tier providers will help extend the value and potential of existing NBN
and mobile telecommunication networks. The role of telecommunications in supporting a big data
future in agriculture is not necessarily technology constrained; if a farm has access to the mobile
network somewhere on the farm, or NBN into the farm house then there is invariably technology
available to beam it to where it is needed. But the external connectivity MUST be stable 24/7. There
is little value having high speed internet for only short periods of the day. If this is the case, as it
often is, then at least we should be able to know IN ADVANCE when that will be so we can work to
get the best out of it. Reliability is as important as absolute speed, and speed is different from signal
‘strength’ or ‘reception’. The other real constraint is around service and price. Entirely new
innovative methods of extending connectivity over remote regions are in the R&D pipeline; some are
even surfacing now. Others have been around for some time and overlooked. It is time to visit or
revisit them. Business models are evolving, and need to evolve further to support the types of
connectivity functionality that farmers need.
The on-farm telecommunications market is rapidly evolving but like with all things in precision
agriculture, education is one of the biggest challenges faced by both those looking for solutions and
those offering solutions. Industry needs well-curated case studies and education/educators must
target not only consumers of telecommunications services but also technology developers and
service providers seeking to put something in the market place.
Conclusion
                                          The progression of telecommunications and technology must be accompanied by education and
                                          extension. A recent survey identified that more that 60% of Australian farmers did not know of on-
                                          farm connectivity options or who to talk to about getting connected. There are many challenges and
                                          opportunities of getting connected into the SMART farming future that, in 5-10 years, will just be
                                          farming.

                                          Acknowledgements
                                          The project that delivered the ‘telecommunications review’ referred to in this presentation was led
                                          by Cotton Research and Development Corporation (CRDC). The ‘P2D’ project was jointly funded by
                                          the Department of Agriculture and Water Resources Rural Research and Development (R&D) for
                                          Profit Program and all 15 rural Research and Development Corporations including the Grains
                                          Research and Development Corporation (GRDC). A copy of the full report “A review of on-farm
                                          telecommunications challenges and opportunities in supporting a digital agriculture future for
                                          Australia” (ISBN 978-921597-75-6 Electronic) is available for free download on the Australian Farm
                                          Institute website (http://www.farminstitute.org.au/p2dproject).

                                          Contact details
                                          David Lamb
                                          Precision Agriculture Research Group, University of New England
                                          Armidale, NSW, 2351
                                          Email: dlamb@une.edu.au

        6
Allora GRDC Grains Research Update 2018
7
The impact of wheat residue on air temperature in the canopy and
Allora GRDC Grains Research Update 2018
phenology of chickpea in 2017
Andrew Verrell1, Kathi Hertel2, Brooke McAlister2 and Matthew Grinter1
1
NSW Department of Primary Industries, Tamworth
2
NSW Department of Primary Industries, Narrabri
Key words
stubble, frost, temperature, radiant, phenology
GRDC code
DAN00965 - Thermal responses of winter pulses
Call to action/take home message
Surface wheat residue increases the incidence and severity of radiant frosts.
The average minimum surface temperature declines by -0.100C/ tonne of residue.
High residue loads can change the thermal profile of the crop and lead to delays in the onset of
flowering, podding and maturity in chickpeas.
Inter-row sowing into standing residue (>30cm) led to less frosts and higher minimum
temperatures in chickpeas.
Some chilling tolerant chickpea lines flowered 3 to 11 days earlier than PBA HatTrick but this
did not translate into earlier 1st pod dates.
Introduction
Chickpea productivity in the northern grains region (NGR) is constrained by several abiotic stresses
(Whish et al. 2007) and temperature is one of the most important determinants of crop growth over
a range of environments (Summerfield et al. 1980) and may limit chickpea yield (Basu et al. 2009).
The potential evaporative demand for water usually exceeds the water available to the crop and
represents the greatest limitation to crop production in the northern grains region (NGR). Low-
disturbance direct seeding into standing or flattened cereal stubble is the most effective practice to
reduce the impact of water stress on chickpea crops. However, surface residues can cause an
increase in radiant frost risk and may also affect the micro-climate of the crop canopy, with impact
on floral initiation, pod set and seed development.
The impact of surface residue on air temperature in the canopy, phenology, biomass and grain yield
of chickpea was explored in a series of experiments across the NGR in 2017.
Stubble effects on soil and air temperature
During the day, stubble reflects solar radiation. A bare, darker soil absorbs more solar radiation than
a stubble-covered soil and warms up more readily. The stubble also acts as insulation as it contains a
lot of air which is a poor conductor of heat. Finally, the stubble affects the moisture content of the
soil. It takes more heat to warm up moist, stubble covered soil than dry, bare soil.
This causes soil temperature of a bare soil to be higher than stubble covered soil during the day
(especially in the afternoon). At night, however, the bare soil loses more heat than stubble covered
soil due to the lack of insulation (the air-filled stubble being a poorer heat conductor). This is
especially noticeable when skies are clear. The air above the bare soil is therefore warmer during the
night than the stubble covered soil, while the soil temperature differences become negligible.
                                          Therefore stubble cover may lead to a higher incidence of frost than bare soil.

                                          Methods
                                          A range of experiments were conducted at Rowena and Tamworth in 2017 (Table 1).
                                                                 Table 1. Experiments, treatments and locations for 2017
                                                    Experiment         Tamworth                         Rowena
                                                    Row orientation    North - South                    East - West
                                                    Stubble loading    0, 3, 6, 12, 24 t/ha residue     0, 3, 6, 9, 12 t/ha residue
                                                                       Chickpea, faba bean, field pea   4 x chickpea genotypes
                                                    Stubble height     0, 10, 30, 50 cm                 0, 5, 10, 17 cm
                                                                       Chickpea, faba bean, field pea   4 x chickpea genotypes
                                                    Chilling           Plus and minus residue           Plus and minus residue
                                                    tolerance          16 chilling tolerant chickpeas   16 chilling tolerant chickpeas
                                                    Genotype           Plus and minus residue
                                                    screening          20 selected chickpea lines
                                          In all of the stubble experiments, treatments were not invoked until just prior to sowing. This
                                          ensured there was no treatment effect on soil stored water at sowing. In the stubble loading
                                          experiments, residue was removed, bulked and weighed into treatment amounts and re-applied to
                                          the plots immediately post-sowing. In the stubble height experiments, treatments were cut using a
                                          small plot header the day before sowing. Stubble was stripped and captured at the back of the
                                          header for removal.
                                          In all experiments, tiny tag temperature data loggers were used in selected treatments and plots.
                                          Sensors were placed at 0cm and 50cm above ground in-crop. Temperature was logged at 15minute
                                          intervals. Another Tiny Tag sensor was placed outside the crop area at 150cm above the ground to
                                          record ambient temperature at similar time intervals.
                                          Detailed phenology was recorded on a daily basis. At physiological maturity, whole plant samples
                                          were taken for detailed plant component analysis and whole plots were harvested for grain yield.
        8
                                          Results

                                          The 2017 growing season
Allora GRDC Grains Research Update 2018

                                          The 2017 growing season has been one of the most difficult and extreme on record equivalent to the
                                          1994 and 1982 seasons with record frost events and below average in-crop rain.
                                          The Rowena site failed due to lack of soil moisture exacerbated by the high frost incidence. Nothing
                                          was recoverable. Table 2 shows the long term average (LTA) monthly rainfall and minimum screen
                                          temperatures and the monthly rainfall and average minimum temperature for Tamworth in 2016
                                          and 2017.
9
      Table 2. Long term average (LTA) monthly rainfall and minimum temperature and monthly

                                                                                                           Allora GRDC Grains Research Update 2018
      rainfall and mean minimum temperature for 2016 and 2017 at Tamworth
Statistic       Jan     Feb    Mar     Apr     May    Jun     Jul    Aug     Sep     Oct    Nov     Dec
Rainfall 2017   125     19     124     22      61     49      20     21      10      90     64      39
mm
Rainfall 2016   100     1      22      5       61     169     29     83      133     76     12      97
mm
LTA rainfall    85      67     49      42      44     49      46     46      48      58     66      72
mm
Mean Min        19.6    18.5   15.3    9.2     6.3    3.5     -0.1   1.2     4.5     11.4   11.9    16.5
2017 (°C)
Mean Min        17.0    16.1   15.7    12.2    6.6    6.1     3.7    3.2     7.2     7.1    10.1    16.9
2016 (°C)
LTA min         17.4    17.1   14.8    10.6    6.7    4.1     2.9    3.7     6.1     9.9    13.1    16.0
temp (°C)
      Rainfall leading into the 2017 growing season was on par for the LTA, but July-September was below
      the cumulative LTA by 88mm. Rainfall in October saved these crops and resulted in average yields
      (Table 2).
      The mean minimum temperatures started to dip below the LTA from April right through to
      September, with mean minimums for July, August and September being, -3.05, -2.52 and -1.580C
      colder than the LTA, respectively. The frost incidence at Tamworth in 2017 was unprecedented, with
      49 screen frosts compared to 22 in 2016. Rowena experienced 26 screen frosts up to the 1st week in
      September when the crop failed.
      At Tamworth, the extreme weather events led to complete death of ALL field pea blocks. This was
      through frost events followed by a wipe out due to bacterial blight infection.

      Elevation and air temperature
      Figure 1 shows the effect of slope on average minimum air temperature at ground level at the
      Tamworth site. Minimum temperature declined by - 0.220C per m drop in elevation measured on
      bare soil.

        Figure 1. Effect of slope on average minimum temperature (7/7 – 8/8/2017) at ground level at the
                                        Tamworth Agricultural Institute (TAI)
Stubble loading effects on in-crop temperature
The effect of different amounts of wheat residue, flat on the ground, and its impact on the
temperature profile of different pulse species was examined.
Table 3 shows the effect of residue loading on minimum temperature at the residue surface in
chickpea at TAI.
The bare soil surface was on average, -1.00C colder than the minimum screen temperature. Both the
average minimum and absolute minimum declined as the amount of surface residue increased, with
the high residue loading (24 t/ha) -1.40C colder on average than bare soil. Frost incidence was similar
across all residue level loadings, but there were 5 more ground frosts recorded compared to the
screen temperature. The absolute minimum decreased with increasing residue load, with the high
residue treatment reaching -7.50C compared to -6.40C on bare soil (see Table 3).
Table 3. The average minimum, absolute minimum and number of frosts (11
Allora GRDC Grains Research Update 2018
Figure 2. The effect of surface residue loading on average minimum temperature at the residue
surface at Rowena (●) and TAI (■) in the chickpea crop
Both responses are linear but the steeper slope at Rowena would suggest that residue amount had a
more significant impact on minimum temperature and frosting in 2017 than at TAI. Minimum
temperature declined by -0.10 and -0.05 0C, per tonne of residue at Rowena and TAI, respectively.
Stubble height effects on in-crop temperature
Table 5 shows the effect of stubble height on temperature parameters at the soil surface on inter-
row sown chickpea at TAI.
Table 5. The effect of residue height on absolute and average maximum and minimum temperature
and number of frosts in chickpea at the soil surface at TAI (7th July to 20th September)
Parameter Bare soil 10cm 30cm 50cm
Abs. Max 37.1 37.0 36.7 35.0
Av Max 25.5 25.3 24.9 23.5
Av Min -0.8 -0.7 0.2 0.0
Abs. Min -5.6 -5.4 -4.3 -4.9
No. frosts 51 51 41 42
There was no change in temperature parameters between the bare soil and 10cm high residue.
Changes started occurring once residue reached 30cm high, with the average and absolute
minimums rising 0.40C and 1.30C, respectively. There were 10 less frosts in the 30 and 50cm high
residue treatments compared to bare soil. Average and absolute maximums were 2.00C cooler in the
tall 50cm stubble treatment compared to bare soil (see table 5).
Stubble loading effects on phenology
The effect of surface residue loading on the time taken, recorded as days after sowing (DAS), to
reach 20% flower, 1st pod, 50% pod and flowering cessation are shown in figure 3.Figure 3. The effect of surface residue loading on the time taken (days after sowing) to reach
20% flower (■), 1st pod (●), 50% pod (○) and flowering cessation (∆).
Across all parameters the time taken to reach these increased with increasing residue load on the
surface. This effect was even more pronounced for 50% pod set and development and flowering
cessation (Figure 3).
Assessment of chilling tolerant lines
Table 6 contains phenology data for selected lines from the chilling tolerance experiment at TAI.
Table 6. The effect of surface residue treatment on the time taken (days after sowing) to reach 1 st
flower, 50% flower and 1st pod for selected genotypes
Days after sowing
Stubble Variety 1st Flower 50% Flower 1st Pod
Bare CICA-1521 101 124 132
12
Flat residue CICA-1521 104 126 132
Bare PBA HatTrick 110 126 132
Allora GRDC Grains Research Update 2018
Flat residue PBA HatTrick 115 126 137
Bare CT-3 97 126 132
Flat residue CT-3 118 129 137
In the bare soil treatment, genotypes reached 1st flower 3 to 11 days earlier than in the flat residue
treatments. The residue treatments delayed 50% flowering in the numbered lines, but not in PBA
HatTrick , while the bare soil treatments led to earlier 1st podding. CICA1521, a fixed line, is
substantially earlier at flowering than PBA HatTrick , but similar in time to 1st pod set. CT-3 is a new
line with enhanced chilling tolerance which is evident from its earlier time to 1st flowering, but this
didn’t translate into earlier pod set when compared to PBA HatTrick .
Conclusion
The 2017 season was unprecedented with record frost events coupled with below average in crop
rainfall. The severe weather conditions led to the complete death of the field pea blocks at TAI, due
to frost and bacterial blight. Terminal drought led to the eventual loss of the Rowena site.13
The slope of cropping country can contribute to spatial variability in soil surface temperatures, with
Allora GRDC Grains Research Update 2018
minimum temperatures declining by - 0.220C per m drop in elevation measured on bare soil.
Surface residue loading increased the severity of radiant frosts which impacted on all species. Field
peas are the most susceptible, while faba bean and chickpea can tolerate some vegetative frosting.
The number of frosts increased with residue loading, while the average minimum surface
temperature declined by -0.10 0C, per tonne of residue.
Standing stubble led to changes in air temperature at the inter-row soil surface. There was no
difference in temperature parameters between bare soil and 10cm high residue. Once residue was
above 30cm average, absolute minimums rose by 0.4 to 1.30C and there were fewer frosts.
Maximum temperatures were cooler by up to 2.00C.
Numbered lines assessed for chilling tolerance showed that they could flower 3 to 11 days earlier
than PBA HatTrick , but this did not translate into earlier pod set. Post-harvest assessment will
determine whether earlier flowering has led to more viable flowering and podding sites compared to
PBA HatTrick .
In all cases, sowing chickpeas between standing wheat residue gave equivalent grain yield outcomes
to the bare soil treatment.
This remains the preferred strategy to maximise fallow efficiency and grain yield.
Acknowledgements
The research undertaken as part of project DAN00965 is made possible by the significant
contributions of growers through both trial cooperation and the support of the GRDC, the author
would like to thank them for their continued support. Thanks to Michael Nowland and Peter Sanson,
(NSW DPI) for their assistance in the experimental program.
References
Basu PS, Ali M, Chaturvedi SK (2009) Terminal heat stress adversely affects chickpea productivity in
Northern India – Strategies to improve thermotolerance in the crop under climate change. In ‘ISPRS
Archives XXXVIII-8/W3 Workshop Proceedings: Impact of Climate Change on Agriculture’. 23–25
February, New Delhi, India. (Eds S Panigrahy, SR Shankar, JS Parihar) pp. 189–193. (International
society for Photogrammetry and Remote Sensing, India)
Summerfield RJ, Minchin FR, Roberts EH, Hadley P (1980) The effects of photoperiod and air
temperature on growth and yield of chickpea (Cicer arietinum L.). In ‘Proceedings of International
Workshop on Chickpea Improvement’. 28 Feb. –2 March 1979, The International Crops Research
Institute for the Semi-Arid Tropics, Patancheru, AP, India. (EdsJMGreen, YLNene, JB Smithson) pp.
121 –149. (ICRISAT Publishing: Hyderabad, India)
Whish JPM, Castor P, Carberry PS (2007) Managing production constraints to the reliability of
chickpea (Cicer arietinum L.) within marginal areas of the northern grains region of Australia. AJAR,
2007, 58, 396-405.
Contact details
Dr Andrew Verrell
NSW Department Primary Industries
Mb: 0429 422 150
Email: andrew.verrell@dpi.nsw.gov.au
Varieties displaying this symbol beside them are protected under the Plant Breeders Rights Act
1994Preliminary data on phenology of Australian chickpea cultivars in the
northern grain belt and prebreeding for heat avoidance traits
Angela L. Pattison, Helen Bramle and Richard Trethowan, University of Sydney
Key words
chickpea, phenology, heat, chilling, prebreeding
GRDC code
US00083
Call to action/take home messages
This research aims to identify chickpea traits and germplasm with superior tolerance to high
temperatures and produce pre-breeding lines with improved productivity for the northern
region. Results from this project will be published over the next few years.
Results from contrasting 2016 and 2017 seasons in delayed sowing experiments were used to
benchmark the phenological response of current and older cultivars to temperatures during
flowering and podset.
Approximately 1250 internationally-sourced lines (including both Cicer arientinum and wild
relatives) are being screened for performance in the northern grain belt to select appropriate
parents for pre-breeding for high yield under terminal heat stress. Earlier podding is one of
several traits being targeted.
Introduction
Chickpea is rapidly growing in its importance as a winter legume crop in Australia. Research and pre-
breeding in Australia is expanding in the areas of abiotic stress tolerance to build on gains in disease
control over the past 40 years.
Terminal heat stress is one of the most widespread abiotic stressors in Australian cropping regions.
There are several ways in which heat can reduce yield, which include death/sterility of reproductive
14 tissues (Devasirvatham et al. 2013), reduced pod set, a reduction in the duration of developmental
stages (Devasirvatham et al. 2012) and investment in heat-shock proteins (Jha et al. 2014). These
factors are controlled by different genes and require different breeding strategies, but relevant traits
could potentially be ‘pyramided’ into new pre-breeding lines to enhance the performance of
Allora GRDC Grains Research Update 2018
chickpea in hot and dry seasons.
Compared to most other winter legumes, chickpea has a reputation as relatively tolerant to hot, dry
conditions (Sadras et al. 2015). The temperatures required to sterilise flowers are relatively high
(sustained >33oC daytime temperatures in sensitive genotypes – Devasirvatham et al. 2013) and are
not usually persistent during the key weeks of pollination in September and October in the
Australian grain belt. Conversely, temperatures which delay the onset of podding (average daily
temperature of 15oC, termed “chilling temperatures” – Croser et al. 2003) are quite common, and
delays in the commencement of podding of up to 35 days post flowering have been recorded in
Mediteranean-type climates in Australia due to long periods of chilling temperatures (Berger et al
2004). Reduced pod set has been observed in mean temperatures up to 21oC (Berger et al. 2011).
This has been attributed to a reduced ability of the pollen to grow through the style and fertilise the
ovule under low temperatures, despite both pollen and ovule being fertile (Srinivasan et al. 1999;
Clarke and Siddique 2004).15
It has been argued that greater yield gains for Australian growers are possible by bringing the
Allora GRDC Grains Research Update 2018
podding period earlier by a week in September (heat avoidance) rather than extending the podding
period a week into November (heat tolerance), when moisture availability is usually also a significant
constraint (Clarke et al. 2004). Several approaches to breeding for improved chilling tolerance have
been attempted in Australia, including pollen screening utilising internationally-sourced Cicer
arientinum germplasm, which resulted in early-podding cultivars Sonali and Rupali (Clarke et al.
2004), and screening wild relatives for chilling tolerance (Berger et al. 2011). It has been suggested
that little genetic variation exists amongst domesticated chickpea to breed for chilling tolerance
(Berger et al. 2011), however a difference of a few days in the onset of podding, though scientifically
small when compared to wild Cicer species or other crops, can be economically large to a grower,
particularly in seasons of terminal heat or drought stress (Berger et al. 2004).
The aim of this research is to investigate mechanisms for heat tolerance and avoidance, screen
Australian and international germplasm for genetic sources of relevant traits, and incorporate these
traits into pre-breeding lines which can be used for development of future Australian cultivars by
breeders. The data presented in this paper are preliminary phenological results from a subset of
lines to illustrate the potential to breed for chilling tolerance as a mechanism to increase the time
available for podding in seasons/environments which experience terminal heat and drought stress.
Methods for preliminary results
A field experiment was conducted at the I. A. Watson Grains Research Institute, Narrabri (30.34oS;
149.76oE) in 2016 and 2017. Up to 76 chickpea genotypes were planted in two replicated plots (each
plot 1.8 x 4 m). Data presented here is from a subset of lines representing released cultivars or
publically available genotypes.
The experiment consisted of two sowing dates - a sowing date typical for the northern region and a
later sowing when plants would be exposed to higher temperatures. Planting dates were 14 June
and 29 July in 2016, and 31 May and 25 July in 2017. The experimental years provided two
contrasting seasons: 2016 was dominated by high rainfall (529 mm Jun – Oct) and relatively cool
September daytime temperatures, with large amounts of cloud associated with precipitation in the
first few months of growth. In contrast, 2017 started with good stored moisture, but had less in-crop
rainfall (135 mm Jun-Nov), with concurrent warmer days and cooler nights. Temperature profiles for
the period before and during the reproductive phase are given in Figure 1.
Plots damaged by severe ascochyta infection in 2016 were excluded from the analysis and hence,
the results for some cultivars represent data from single plots.
Phenology for the time of sowing (TOS) trial was recorded as the days after planting (DAP) that 50%
of plants in the plot had produced its first flower or first pod. Growing degree days (GDD) was
calculated by
[(Tmax + TMin) / 2] - Tbase
Where Tmax is the daily max temperature and TMin is the daily minimum, unless the minimum
dropped below Tbase in which case Tbase was used. A Tbase of 0oC was assumed (Soltani et al. 2006).
Daily temperatures were measured by an on-site weather station.Figure 1. Temperature profiles for the two experimental seasons before and during the reproductive
phase. Dotted lines = 2016 daily minimum and maximum temperatures; solid lines = 2017 daily
minimum and maximum temperatures.
In addition, over 1000 genetically-diverse chickpea genotypes were obtained from the Australian
Grains Genebank (AGG), plus a subset of 241 lines from the ICRISAT reference set were obtained via
the Australian Centre for Plant Functional Genomics (Adelaide, South Australia). These sets included
wild relatives of domesticated chickpea, wild-collected accessions of Cicer arientinum, and breeding
lines/cultivars from a diverse range of growing environments around the world. All genotypes were
sown in single 1.5m rows in 2016 in a netted bird-exclusion cage at Narrabri between the 18th and
27th July, with the late and long sowing period being due to high rainfall, which continued for most of
the growing season. PBA HatTrick and PBA Slasher were included as comparators. Phenology was
determined for plants within each 1.5m row as per TOS trial.
16 The data were analysed using the REML function I Genstat (version 17). Years, sowing dates and
genotypes were considered fixed effects and row-column coordinates within sowing dates and
seasons as random effects.
Allora GRDC Grains Research Update 2018
Preliminary results and discussion
The contrasting seasons provided interesting study years for the influence of temperature on
phenology. DAP for flowering, podding and the flower-pod interval exhibited a significant interaction
between genotype, year and TOS (P=0.036, P17
Cultivars which had a flower-pod interval which was more than 2 weeks greater in TOS1 compared
Allora GRDC Grains Research Update 2018
with TOS2 were Genesis 079, PBA Monarch , PBA Pistol , PBA Slasher , PBA Striker and Sonali.
These cultivars tended to have both earlier flowering and earlier podding times than other cultivars,
and were the earliest in both TOS1 and TOS2.
Figure 2. Correlations between the flowering and podding dates of genotypes in
two contrasting seasons
The thermal time requirements to the commencement of the flowering and podding periods are
given in Table 2. Earlier commencement of podding in 2017 cannot be explained by faster
accumulation in thermal time. Commencement of podding in TOS1 was 207 GDD later in 2016 than
2017. This trend was also evident in TOS2, albeit to a lesser extent. Whilst the average daily
temperatures (essentially what is used to calculate GDD where Tbase = 0oC) in both seasons were
similar during the commencement and early reproductive stage (Figure 1), the daily maximums and
minimums were quite different, and the amount of cloud was much higher in 2016 due to the large
number of rainy days. It is possible that lower light intensity due to cloud cover had a significant
influence on chickpea development. Note that irrigation was used to top up stored soil moisture in
2017 such that there was minimal to zero water stress during flowering and podding (no irrigation
was required in 2016).
The shorter intervals between flowering and podding in TOS2 compared to TOS1 are also not
explained by differences in GDD alone, with podding commencing 330 GDD earlier in TOS2 than
TOS1 in 2016 and 246 GDD earlier in 2017. This lends support to the importance of considering
daylength as well as temperature in delayed sowing trials (Sadras et al. 2015).Table 1. Number of days between flowering and podding in heat stress trials at
Narrabri in 2016 and 2017
Flower-pod
Flowering Podding interval
TOS1 TOS2 TOS1 TOS2 TOS1 TOS2
2016
Amethyst 102 79 121 89 20 11
Flipper 105 77 121 89 16 12
Genesis 079 89 71 120 82 31 11
Genesis 090 101 76 120 84 19 8
Genesis Kalkee 107 77 121 87 15 10
Howzat 99 77 120 84 21 8
ICCV 05112 101 74 121 85 21 12
ICCV 05301 109 81 122 90 13 9
ICCV 05314 110 78 124 90 14 12
ICCV 06109 98 78 120 91 22 14
ICCV 98818 97 76 117 89 20 13
Jimbour 109 84 124 91 13 9
Kyabra 110 84 126 92 16 12
PBA HatTrick 98 75 120 86 22 11
PBA Monarch 93 72 120 82 27 11
PBA Pistol 93 74 114 79 21 5
PBA Slasher 91 72 117 80 27 8
PBA Striker 89 74 120 82 31 8
Sonali 86 70 113 80 28 10
Tyson 103 78 121 93 19 15
Yorker 101 78 122 92 21 15
Range 25 14 13 14 18 10
Mean 99 76 120 86 21 10
18
2017
Ambar 84 64 103 75 19 11
Allora GRDC Grains Research Update 2018
Amethyst 89 64 105 73 17 9
Genesis 079 82 62 103 73 21 11
Genesis 090 91 65 107 76 16 11
Genesis Kalkee 92 66 107 76 15 10
ICCV 05112 97 71 109 79 12 8
ICCV 05301 89 71 105 78 16 7
ICCV 05314 91 70 106 77 15 7
ICCV 06109 97 71 109 80 12 9
ICCV 98818 97 71 109 80 12 9
Jimbour 86 62 104 74 18 12
Kimberly Large 82 63 109 71 27 8
Kyabra 86 63 106 74 20 11
Neelam 91 63 107 73 17 10
PBA Boundary 94 62 107 71 13 1019
PBA HatTrick 86 63 105 72 19 10
Allora GRDC Grains Research Update 2018
PBA Monarch 82 64 105 74 23 11
PBA Pistol 82 60 103 70 21 10
PBA Seamer 82 62 103 71 21 9
PBA Slasher 82 62 105 71 23 10
PBA Striker 82 60 103 70 21 11
Sonali 82 61 105 71 23 10
Range 15 12 6 11 15 5
Mean 87 64 106 74 18 10
s.e. 4.384 2.079 2.880
Podding for all genotypes in TOS2 began between 80 and 92 DAP in 2016 and 71 and 76 DAP in 2017.
The mean flower-pod interval was 10 days in both 2016 and 2017 for this treatment, which was
between 9 and 14 days shorter than TOS1. Given that it is not GDD alone which causes shorter
flower-pod intervals in TOS2, two possible factors are proposed: longer daylength/greater incidence
of solar radiation (Soltani and Sinclair, 2011), and/or a critical minimum temperature under which
sporogenesis or pollenation cannot occur (Clarke and Siddique 2004). The large number of cloudy
days in 2016 likely played a role in alteration of phenology.
Further field trials over the next few years will quantify the influence of these various factors, as well
as growth rate, changes in canopy temperature using aerial remote sensing, model phenology
relative to canopy temperature rather than weather station data, and quantify photothermal time
rather than simply GDD. Another factor that warrants further research is that average daily
temperature is not the best measure of chilling but rather temperatures after dawn (when pollen is
released).
Table 2. Accumulated GDD up to the commencement of flowering and podding for the
earliest genotypes in each treatment
Flowering Podding
TOS1 TOS2 TOS1 TOS2
2016 999 892 1374 1044
2017 940 729 1167 921
Of most value to prebreeding is that differences existed between genotypes, even amongst the fairly
narrow genetic diversity found in current Australian cultivars. To expand this genetic range and seek
lines with earlier podding capacity (and suitability to other climatic features of the Northern Grain
Belt), the phenology and yield potential of a diverse range of chickpea genotypes were quantified at
Narrabri (Figure 3). Heavy rains in June and July caused significant planting delays, such that the
planting date was closer to TOS2 in 2016 and thus the discrimination between podding dates was
anticipated to be small. Nevertheless, up to 6 days difference in podding date between PBA
HatTrick and the earliest podding lines, and 7 days difference in the flower-pod interval, were
observed. Podding dates of PBA Slasher and PBA HatTrick standards were 91 DAP and 85 DAP
respectively, and flower-pod intervals were 15 days and 12 days respectively. This placed these lines
(and by deduction most Australian cultivars) well within, but slightly earlier than average, the range
of podding dates found in the diverse lines. It is anticipated that when sown within the optimum
sowing window for chickpea there would be greater variation in podding dates and flower-pod
interval, as experienced in the TOS1 trials.Figure 3. Histograms showing distribution of podding and flower-pod intervals amongst a range of
>1000 diverse genotypes including closely related Cicer species and wild lines.
A subset of approximately 200 of the diverse lines from 2016 were increased in 2017 and will
undergo field-based screening in 2018. Selection amongst diverse genotypes will be made for earlier
podset as well as a host of other traits likely to lead to yield gains in the northern grain belt. The
most promising lines will be crossed with high-yielding Australian cultivars and sent to the PBA
chickpea breeding program at Tamworth for incorporation into future chickpea cultivars.
Acknowledgements
This research is part of theme 1A of the Legumes for Sustainable Agriculture, which is funded
through Australian Research Council Industrial Transformation Hub (IH140100013) and growers via
the GRDC, and the authors would like to thank them for their continued support. The authors also
thank Tim Sutton of ACPFG for provision of the ICRISAT reference set.
References
Berger, J.D., Kumar, S., Nayyar, H., Street, K.A., Sandu, J.S., Henzell, J.M., Kaur, J., Clarke, H.C., 2011.
Temperature-stratified screening of chickpea (Cicer arietinum L.) genetic resource collections reveals
very limited reproductive chilling tolerance compared to its annual wild relatives. Field Crops Res.
126, 119-129.
20 Berger, J.D., Turner, N.C., Siddique, K.H.M., Knights, E.J., Brinsmead, R.B., Mock, I., Edmondson, C.,
Khan, T.N., 2004. Genotype by environment studies across Australia reveal the importance of
phenology for chickpea (Cicer arietinum L.) improvement. Aust. J. Agric. Res. 55, 1071–1084.
Clarke, H.J., Khan, T.N., Siddique, K.H.M., 2004. Pollen selection for chilling tolerance at hybridisation
Allora GRDC Grains Research Update 2018
leads to improved chickpea cultivars. Euphytica 139, 65–74.
Clarke, H.J., Siddique, K.H.M., 2004. Response of chickpea genotypes to low temperature stress
during reproductive development. Field Crops Res. 90, 323–334.
Croser , J.S., Clarke, H.J., Siddique, K.H.M, Khan, T. N., 2003. Low temperature Stress: Implications for
Chickpea (Cicer arietinum L.) Improvement. Crit Rev in Plant Sci 22, 185-219.
Devasirvatham, V., Tan, D. K. Y., Gaur, P. M., Raju, T. N., Trethowan, R. M., 2012. High temperature
tolerance in chickpea and its implications for plant improvement. Crop Pasture Sci 63, 419–428.
Devasirvatham, V., Gaur, P. M., Mallikarjuna, N., Raju, T. N., Trethowan, R. M., Tan, D. K. Y., 2013.
Reproductive biology of chickpea response to heat stress in the field is associated with the
performance in controlled environments. Field Crops Res. 142, 9-19.
Jha, U.C., Bohra, A., Singh, N.P. 2014. Heat stress in crop plants: its nature, impacts and integrated
breeding strategies to improve heat tolerance. Plant Breeding 133, 679-701.21
Sadras, V. O., Vadez, V., Purushothaman, R., Lake, L., Marrou, H., 2015. Unscrambling confounded
Allora GRDC Grains Research Update 2018
effects of sowing date trials to screen for crop adaptation to high temperature. Field Crops Res. 177,
1-8.
Soltani, A., Hammer, G.L., Torabi, B., Robertson, M.J., Zeinali, E., 2006. Modeling chickpea growth
and development: Phenological development. Field Crops Res. 99, 1-13.
Soltani, A., Sinclair, T. R., 2011. A simple model for chickpea development, growth and yield. Field
Crops Res. 124, 252-260.
Srinivasan, A., Saxena, N.P., Johansen, C., 1999. Cold tolerance during early reproductive growth of
chickpea (Cicer arietinum L.): genetic variation in gamete development and function. Field Crops Res.
60, 209–222.
Contact details
Angela Pattison
The University of Sydney
12656 Newell Hwy, Narrabri, NSW
Ph: 02 6799 2253
Email: angela.pattison@sydney.edu.au
Varieties displaying this symbol beside them are protected under the Plant Breeders Rights Act
1994Chickpea agronomy and water use with neutron moisture meters
Kerry McKenzie1, RCN Rachaputi2, Doug Sands3
1
Queensland Department of Agriculture and Fisheries, Tor St Toowoomba
2
Queensland Alliance for Agriculture and Food Innovation, University of Queensland Gatton
3
Queensland Department of Agriculture and Fisheries, Emerald
Key words
chickpea, agronomy, row spacing, harvest index, water use
GRDC code
UQ00067
Call to action/take home messages
Chickpea yields are maximised when planted on narrow rows (50cm and below).
Avoid planting early and excessive biomass production.
Aim to establish 20-30 plants/m2 .
Chickpeas will extract water from soils to 1.2m and below.
Water Use Efficiency is improved by narrow rows; more water extracted and higher yields.
Background
The Queensland Pulse Agronomy Initiative planted its first chickpea trial in the 2013 winter, and with
the next 2 years of trials our understanding of what drives yield improved, but also left many
unanswered questions regarding crop physiology and how to best manage the crop to maximise
yield.
The initial trials across southern Queensland confirmed that the latest release varieties such as PBA
HatTrick , PBA Boundary and the now released PBA Seamer (formerly CICA 0912) responded
similarly to several agronomic factors:
22
All maximised yields when planted at narrow row spacings with peak yields obtained when
planted at row spacing of 25cm, however across several sites and years yields at 50cm were
statistically the same as 25cm; yields then dropped when planted at wider spacings of 75cm
Allora GRDC Grains Research Update 2018
and 100cm. This was observed in both low and high yielding environments (Figure).
Plant population had less effect than did row spacing on final yields, with a flat response
curve across 20, 30 and 40 plants/m2, with a slight drop in yield at 10 plants/m2. Hence it is
recommended that planting rates remain at the current recommended rate of 20-30 plants
established/m2 for dryland plantings.
There were no interactions that suggest any variety be planted at different populations for
different row spacings. Planting early in the planting window had no grain yield benefit,
however early plantings generated more biomass.
Later plantings have mixed results for yield and biomass. It has been observed that harvest
index (HI) improves with later plantings due to lower dry matter production (Figure 2) &
(Table 1).23
Allora GRDC Grains Research Update 2018
(a) (b)
Figure 1. Summary of 12 chickpea sites from 2014 and 2015 [diamond marker indicates average
across all sites and the trend line for the 3 row spacings]. (a) shows the effect of row spacing on dry
matter production and (b) final grain yield. Row spacing has a larger effect on dry matter production
than grain yield, however both trend lower as row spacing increases.
(a) (b)
Figure 2. Time of Sowing (TOS) trials in 2015 at 3 sites; Hermitage [HRS], Kingaroy [KY] and Emerald
[EAC]. All sites had a decreasing trend for dry matter production when planted later in the season
(a). Harvest Index (HI) improves with later sowing dates as dry matter is reduced (b).
Table 1. Dry matter production and grain yield at Hermitage 2015 (relates to Figure 2).
Hermitage TOS 1 20/5 TOS 2 12/6 TOS 3 3/7
Dry matter (t/ha) 9.250a 7.825b 7.492b
Grain Yield (t/ha) 3.3d 3.3d 3.3d
* Note that grain production in this trial was the same for all TOS even with high biomass in the early sowing
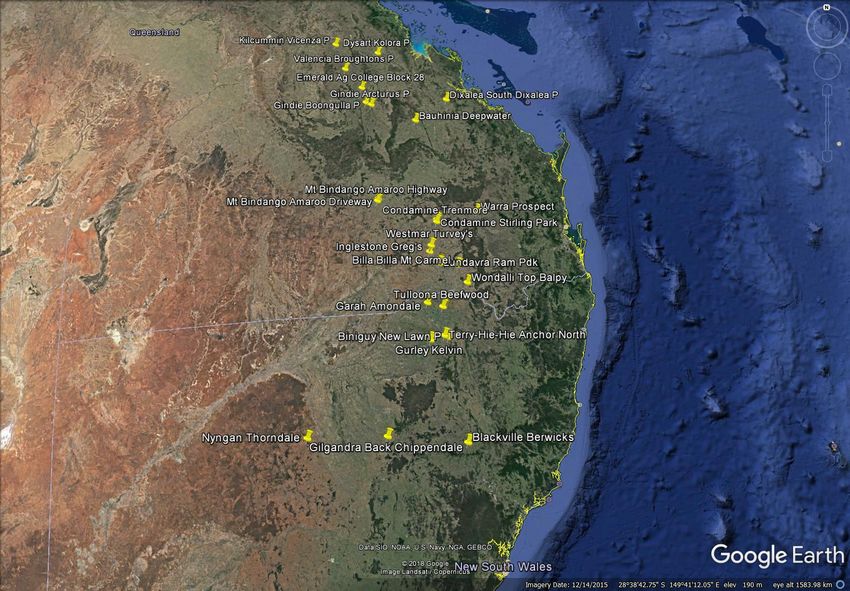
Combining dry matter and yield data across 10 sites over 3 years which includes trials sites at
Emerald, Kingaroy, Warra, Dalby, Goondiwindi and Hermitage in Figure 3, indicates that chickpeas
do not convert biomass to grain with the same efficiency as the production of dry matter increases.
There is a very good straight line relationship up to 8t/ha dry matter and it plateaus after this, i.e.
the highest yield potential crops do not fully meet their grain production potential. There could be
many reasons for this including terminal droughts as a consequence of growing large biomass crops.Figure 3. The relationship ship between dry matter production and grain for chickpea trials at 10
sites over 3 years
New directions
These findings have directed subsequent research questions in the Queensland Pulse Agronomy
Initiative. The questions to be answered include; can harvest index be manipulated in chickpeas?
How best to manage high biomass crops? Can early biomass production be reduced to conserve soil
moisture for later in the season?
Trials with many plant growth regulators (PGRs) and other chemicals were conducted in 2016. While
there were some products that did have a minimal effect on harvest index (HI), no products
improved yields. Work with PGR’s has many seasonal, rate and timing variabilities that make
consistent results difficult to obtain. Due to this and that currently there are no PGR products
24 registered for use on chickpeas, this aspect of the research was not pursued further.
In other trials, the water use of chickpeas was monitored with neutron moisture meters (NMM) to
determine when and where the crop was accessing soil water and to explain why narrower row
Allora GRDC Grains Research Update 2018
spacings were able to access more water and convert it more efficiently to grain.
Water use
To monitor soil moisture and where chickpeas are drawing moisture from using the neutron
moisture meter (NMM), plots were planted at 2 different row spacings of 50 and 75 cm. Within the
plot 2 access tubes were installed, one in the planted row and the other between the 2 rows. In
2016 the variety was PBA HatTrick planted at 30 plants/m2. Access tubes were in all 3 replicated
plots and measurements averaged.
This chickpea trial at Hermitage in 2016, had an unusually wet late winter and spring with close to
500 mm of in-crop rain for the main season planting time and 350mm for the later sowing. This led
to a very late January harvest and a badly lodged crop. Grain yield results from this trial had no
statistical differences across variety and row spacing, with a trend for higher yields at the later
sowing time.25
For the earlier sowing time, flowering commenced by mid-September. The critical 15°C average
Allora GRDC Grains Research Update 2018
temperature for pod retention was not consistent until well into October, with below 5°C minimum
temperatures recorded on the 25th of October.
Due to the very wet season, NMM data shows that the crop grew from August to mid-October on
rainfall, with soil moisture depletion only starting to occur after this time. This soil draw down
coincided with the warmer temperatures and pod retention of the crop. The NMM data shows that
even with the high rainfall, soil moisture was removed from the profile to the deepest measuring
point of 125 cm (Figure 4). We can only assume the chickpea crop was the cause of this as roots
were not assessed.
Figure 4. Soil water use as measured by neutron moisture meter at Hermitage Qld. at 3 times during
the growing season. Access tube was in the middle of 2 rows planted 50 cm apart.
A further point of interest was from where water was extracted in the different row spacings of 50
cm and 75 cm. In the 50 cm, plots water extraction patterns were virtually the same where
measured in the planted row or between the row. In the wider spaced rows at 75 cm, as the season
progressed, more water was extracted in the between row space and this occurred in the top 65 cm
of the profile. The difference over the season was 30 mm of additional PAWC removed in the inter
row space as compared to the on row readings. If you averaged the 2 tubes it would mean an
additional 15mm of water extracted in 75cm plot for no additional yield benefit.
In previous trials within the Pulse Agronomy project where starting and ending gravimetric
assessments of soil water were taken, the results show that crops planted on narrow row spacing
access up to 20mm more of the stored soil water, and due to higher yields convert this moisture
more efficiently to grain.
The trial data for chickpeas grown in 2017 which will provide additional NMM data were unavailable
at the time of publishing.Discussion
Chickpeas have the potential for yields approaching 5 t/ha given the right environment/season (this
project’s best small plot yield 4.7 t/ha dryland). Dry matter production of above 10t/ha and up to 13
t/ha have been produced, and results have seen harvest index of 0.45, however the crop seems
unable to maintain a constant harvest index above 8 t/ha dry matter and it is difficult to get the
combination of high dry matter and HI.
The results suggest several management options to give the crop the greatest potential; starting
with narrow rows. The farming system also needs to be considered, as well as any associated risk
with disease for the coming season. Improved yields from narrow rows are evidenced in high and
low yield scenarios, with disease pressure high 1 in 7 – 10 years.
Planting early produces large biomass that has a higher disease risk potential. The bigger risk
however, is using up stored soil moisture and adding to the possibility of terminal drought and being
unable to maintain this yield potential through pod fill.
Chickpeas should be sown into paddocks with good soil depth and minimal soil constraints. It has
long been known that chickpeas are very adept at chasing deep moisture and NMM suggests
extraction to 125 cm in a soft year. Choosing paddocks with the biggest bucket is highly adventitious
for high yields.
Continue with best management crop scouting for pests and diseases and utilise preventative
fungicide applications as appropriate.
Management options once the crop is growing, apart from the usual crop protection/good
agronomy, have been elusive and work will continue to manipulate the crop to improve harvest
index particularly for high biomass crops but also for lower biomass situations.
Current farming systems aim to store rainfall and fill the soil profile between crops. Good
management enable the crop to withdraw more from this bank of stored soil water.
Acknowledgements
The research undertaken as part of this project is made possible by the significant contributions of
growers through both trial cooperation and the support of the GRDC, the author would like to thank
them for their continued support.
26 The project team is supported by DAF and QAAFI and would like to thank the staff that have
contributed to these results: Stephen Krosch, John Lehane, Rod O’Connor, Peter Agius, Kerry Bell,
Grant Cutler, Nadia Lambert and the Research Infrastructure team.
Allora GRDC Grains Research Update 2018
A special thanks to the generous farmer co-operators who have hosted field trials.
Contact details
Kerry McKenzie
Queensland Department of Agriculture and Fisheries
204 Tor St Toowoomba QLD 4350
Mb: 0477 723 713
Email: kerry.mckenzie@daf.qld.gov.au
Twitter: @onthepulseAUS
Varieties displaying this symbol beside them are protected under the Plant Breeders Rights Act
1994.You can also read