268 FloodWarnTech Synthesis Report: Flood Warning Technologies for Ireland - Authors: Michael Bruen and Mawuli Dzakpasu - EPA
←
→
Page content transcription
If your browser does not render page correctly, please read the page content below
Report No. 268

             FloodWarnTech Synthesis Report:
        Flood Warning Technologies for Ireland
              Authors: Michael Bruen and Mawuli Dzakpasu

www.epa.ie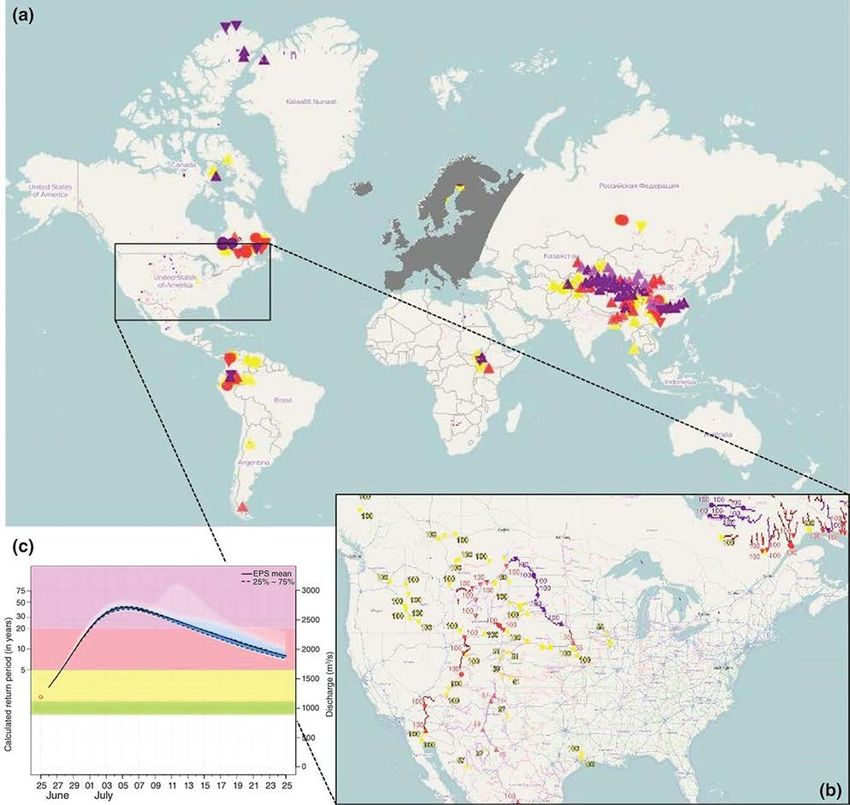
ENVIRONMENTAL PROTECTION AGENCY                                     Monitoring, Analysing and Reporting on the
The Environmental Protection Agency (EPA) is responsible for        Environment
protecting and improving the environment as a valuable asset        • Monitoring air quality and implementing the EU Clean Air for
for the people of Ireland. We are committed to protecting people      Europe (CAFÉ) Directive.
and the environment from the harmful effects of radiation and
                                                                    • Independent reporting to inform decision making by national
pollution.
                                                                      and local government (e.g. periodic reporting on the State of
                                                                      Ireland’s Environment and Indicator Reports).
The work of the EPA can be
divided into three main areas:                                      Regulating Ireland’s Greenhouse Gas Emissions
                                                                    • Preparing Ireland’s greenhouse gas inventories and projections.
Regulation: We implement effective regulation and environmental     • Implementing the Emissions Trading Directive, for over 100 of
compliance systems to deliver good environmental outcomes and         the largest producers of carbon dioxide in Ireland.
target those who don’t comply.

Knowledge: We provide high quality, targeted and timely             Environmental Research and Development
environmental data, information and assessment to inform            • Funding environmental research to identify pressures, inform
decision making at all levels.                                        policy and provide solutions in the areas of climate, water and
                                                                      sustainability.
Advocacy: We work with others to advocate for a clean,
productive and well protected environment and for sustainable       Strategic Environmental Assessment
environmental behaviour.                                            • Assessing the impact of proposed plans and programmes on the
                                                                      Irish environment (e.g. major development plans).
Our Responsibilities
                                                                    Radiological Protection
Licensing                                                           • Monitoring radiation levels, assessing exposure of people in
We regulate the following activities so that they do not endanger     Ireland to ionising radiation.
human health or harm the environment:                               • Assisting in developing national plans for emergencies arising
• waste facilities (e.g. landfills, incinerators, waste transfer      from nuclear accidents.
  stations);                                                        • Monitoring developments abroad relating to nuclear
• large scale industrial activities (e.g. pharmaceutical, cement      installations and radiological safety.
  manufacturing, power plants);                                     • Providing, or overseeing the provision of, specialist radiation
• intensive agriculture (e.g. pigs, poultry);                         protection services.
• the contained use and controlled release of Genetically
  Modified Organisms (GMOs);                                        Guidance, Accessible Information and Education
• sources of ionising radiation (e.g. x-ray and radiotherapy        • Providing advice and guidance to industry and the public on
  equipment, industrial sources);                                     environmental and radiological protection topics.
• large petrol storage facilities;                                  • Providing timely and easily accessible environmental
• waste water discharges;                                             information to encourage public participation in environmental
• dumping at sea activities.                                          decision-making (e.g. My Local Environment, Radon Maps).
                                                                    • Advising Government on matters relating to radiological safety
National Environmental Enforcement                                    and emergency response.
• Conducting an annual programme of audits and inspections of       • Developing a National Hazardous Waste Management Plan to
  EPA licensed facilities.                                            prevent and manage hazardous waste.
• Overseeing local authorities’ environmental protection
  responsibilities.                                                 Awareness Raising and Behavioural Change
• Supervising the supply of drinking water by public water          • Generating greater environmental awareness and influencing
  suppliers.                                                          positive behavioural change by supporting businesses,
• Working with local authorities and other agencies to tackle         communities and householders to become more resource
  environmental crime by co-ordinating a national enforcement         efficient.
  network, targeting offenders and overseeing remediation.          • Promoting radon testing in homes and workplaces and
• Enforcing Regulations such as Waste Electrical and Electronic       encouraging remediation where necessary.
  Equipment (WEEE), Restriction of Hazardous Substances
  (RoHS) and substances that deplete the ozone layer.               Management and structure of the EPA
• Prosecuting those who flout environmental law and damage the      The EPA is managed by a full time Board, consisting of a Director
  environment.                                                      General and five Directors. The work is carried out across five
                                                                    Offices:
                                                                    • Office of Environmental Sustainability
Water Management
• Monitoring and reporting on the quality of rivers, lakes,         • Office of Environmental Enforcement
  transitional and coastal waters of Ireland and groundwaters;      • Office of Evidence and Assessment
  measuring water levels and river flows.                           • Office of Radiation Protection and Environmental Monitoring
• National coordination and oversight of the Water Framework        • Office of Communications and Corporate Services
  Directive.                                                        The EPA is assisted by an Advisory Committee of twelve members
• Monitoring and reporting on Bathing Water Quality.                who meet regularly to discuss issues of concern and provide
                                                                    advice to the Board.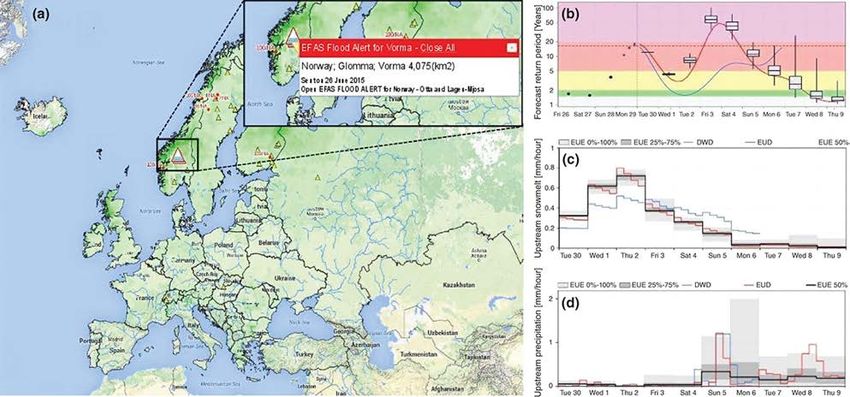
EPA RESEARCH PROGRAMME 2014–2020

FloodWarnTech Synthesis Report: Flood Warning
          Technologies for Ireland

                            (2014-W-DS-17)

                       EPA Research Report

    End of project report available for download on http://erc.epa.ie/safer/reports

                 Prepared for the Environmental Protection Agency

                                          by

                             University College Dublin

                                      Authors:

                      Michael Bruen and Mawuli Dzakpasu

                ENVIRONMENTAL PROTECTION AGENCY
                 An Ghníomhaireacht um Chaomhnú Comhshaoil
               PO Box 3000, Johnstown Castle, Co.Wexford, Ireland

               Telephone: +353 53 916 0600 Fax: +353 53 916 0699
                     Email: info@epa.ie Website: www.epa.ie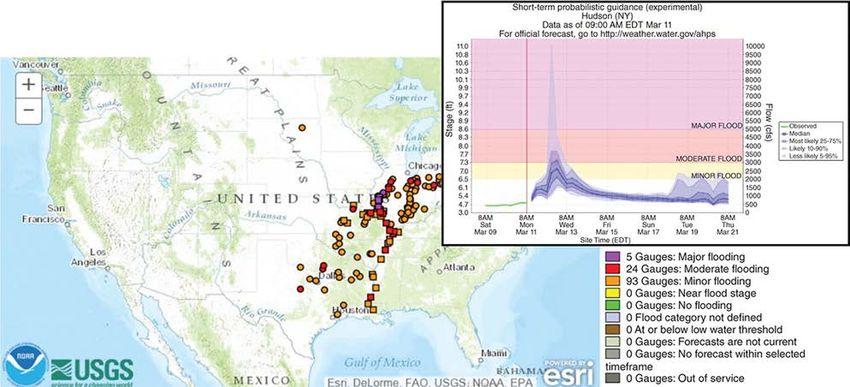
© Environmental Protection Agency 2019

                                ACKNOWLEDGEMENTS
This report is published as part of the EPA Research Programme 2014–2020. The EPA Research
Programme is a Government of Ireland initiative funded by the Department of Communications,
Climate Action and Environment. It is administered by the Environmental Protection Agency, which
has the statutory function of co-ordinating and promoting environmental research.

The project partners wish to thank the following for their technical guidance and advice at various
stages of the project: Mr Ray McGrath (UCD), Mr Oliver Nicholson (OPW), Mr Tom Leahy (Irish
Water), Dr Dorothy Stewart (EPA Project Manager), Dr Jan Verkade (Hydrologist, Deltares, the
Netherlands) and all of the stakeholders who contributed their expertise at the workshop.

                                        DISCLAIMER
Although every effort has been made to ensure the accuracy of the material contained in this
publication, complete accuracy cannot be guaranteed. Neither the Environmental Protection Agency
nor the authors accept any responsibility whatsoever for loss or damage occasioned or claimed to
have been occasioned, in part or in full, as a consequence of any person acting or refraining from
acting, as a result of a matter contained in this publication. All or part of this publication may
be reproduced without further permission, provided the source is acknowledged.

Cover image - Ballinasloe, River Suck in flood November 2009, photo taken by Pat Durkin, EPA

The EPA Research Programme addresses the need for research in Ireland to inform
policymakers and other stakeholders on a range of questions in relation to environmental
protection. These reports are intended as contributions to the necessary debate on the protection of
the environment.

                         EPA RESEARCH PROGRAMME 2014–2020

                    Published by the Environmental Protection Agency, Ireland
ISBN: 978-1-84095-808-9                                                                 April 2019

Price: Free                                                                        Online version

                                                 ii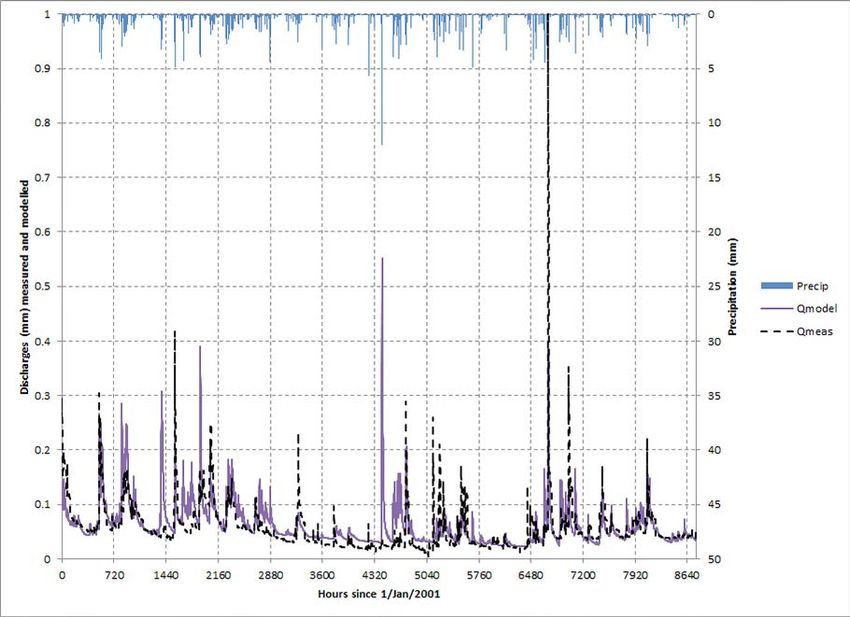
Project Partners

Professor Michael Bruen (Principal           Dr Mawuli Dzakpasu
Investigator)                                School of Civil Engineering
School of Civil Engineering                  University College Dublin
University College Dublin                    Dublin 4
Dublin 4                                     Ireland
Ireland                                      Tel.: +353 1 716 3212
Tel.: +353 1 716 3212                        Email: mawuli_dzkps@yahoo.com.au
Email: michael.bruen@ucd.ie

                                       iii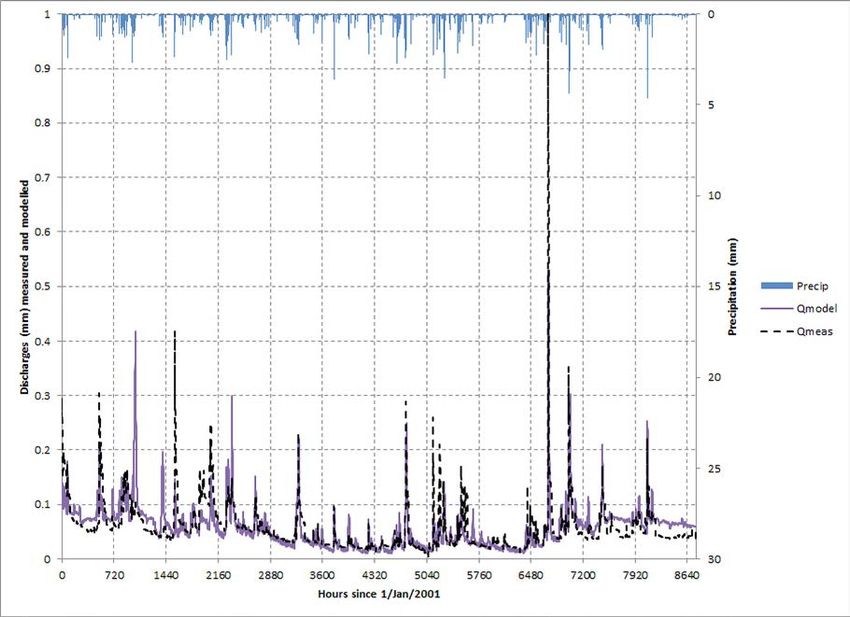
Contents

Acknowledgementsii
Disclaimerii
Project Partners                                                             iii
List of Figures                                                              vii
List of Tables                                                               ix
Executive Summary                                                            xi
1      Introduction                                                           1
       1.1        Background: Flood and Flood Hazard                          1
2      Input Data for Flood Forecasting                                       3
       2.1        Rainfall Estimates                                          3
       2.2        Merging of Gauge and Radar Rainfall Estimates               6
       2.3        Rainfall Forecasts                                          6
3      Hydrological and Hydraulic Models                                      9
       3.1        Flood Forecasting Models and Methods                        9
       3.2        Hydrological Models                                         9
       3.3        Flow Routing Models                                        11
       3.4        Selection of the Appropriate Model for Flood Forecasting   13
4      Operational Flood Forecasting Systems                                 14
       4.1        Forecasting Systems                                        14
       4.2        Operational Forecasting Systems Available in Ireland       16
       4.3        Operational Forecasting Systems in Other Countries         17
5      FloodWarnTech Workshop                                                22
       5.1        Introduction                                               22
       5.2        Conclusions and Summary of Results                         22
6      Report on Potential of Radar and NWP as Sources of Precipitation
       Information for Flood Forecasting                                     24
       6.1        Introduction                                               24
       6.2        Data Sources                                               24
       6.3        Catchments                                                 24

                                                   v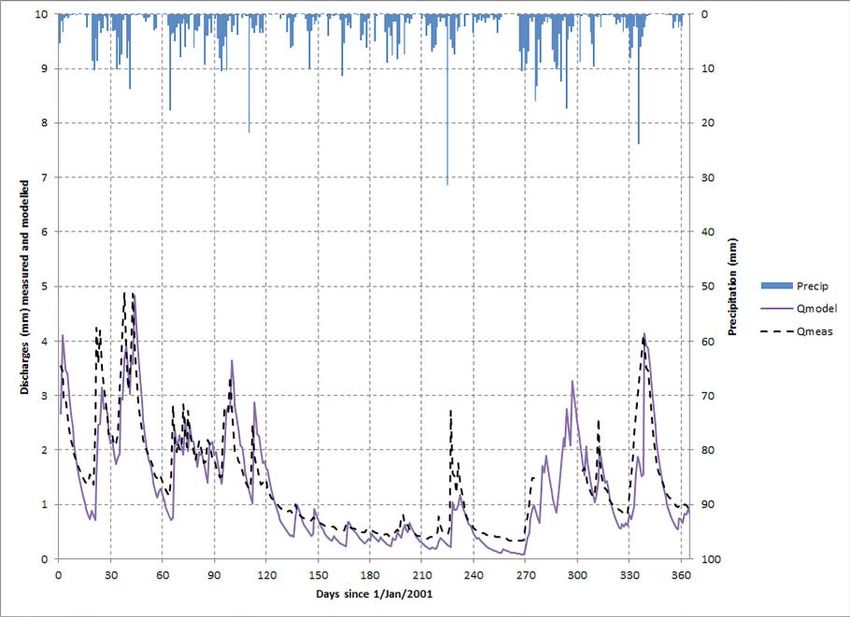
Flood Warning Technologies for Ireland

    6.4   Dodder                                                     24
    6.5   Suir                                                       29
    6.6   Boyne                                                      31
    6.7   Real-time Forecasting Evaluation                           35
    6.8   Summary Conclusions                                        39
7   Demonstration of Key Components of Flood Forecasting Platforms   41
8   Conclusions and Recommendations                                  43
    8.1   Conclusions                                                43
    8.2   Recommendations                                            44
References45
Abbreviations53

                                             vi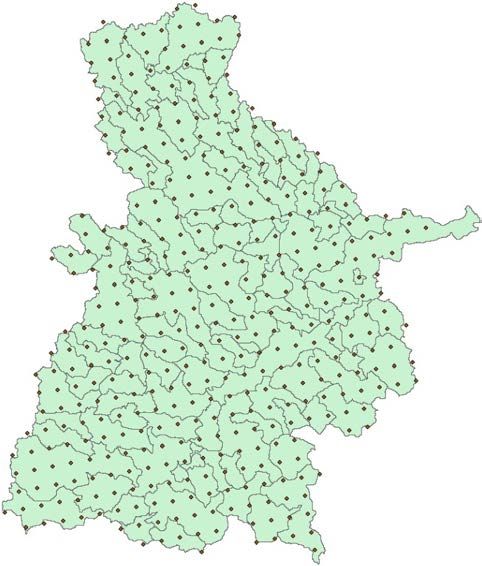
List of Figures

Figure 2.1.   Alternative flood alleviation strategies                                          3
Figure 3.1.   Simple model representations of a catchment: (a) plan view of the
              catchment; (b) physically based model with three soil and subsurface layers;
              (c) artificial neural network model                                              10
Figure 3.2.   Classification of streamflow routing models                                      12
Figure 4.1.   Possible linkages between meteorological and flood forecasting systems           14
Figure 4.2.   EFAS showing (a) the main interface with high (red) and medium (yellow)
              reporting points, flood alerts (warning triangles) and probability (%
              likelihood) of exceeding 50 mm of precipitation (green shading) during the
              forecast period (10 days); (inset a) the flood alert displayed when the alert
              point is clicked on; (b) the return period hydrograph with return period
              thresholds (1.5 years, green; 2 years, yellow; 5 years, red; 20 years, purple);
              (c) upstream snow melt forecast; and (d) upstream precipitation forecast         18
Figure 4.3.   Components of the US HEFS                                                        19
Figure 4.4.   Overview map of the US HEFS showing flood forecasting locations. An
              ensemble hydrograph is shown for a flood event at one river location,
              including observed stage and flow (green), forecast stage and flow (purple)
              in terms of probabilities, and colours indicating the forecast severity based
              on flood stage data (minor flood, yellow; moderate flood, red; major flood, pink) 19
Figure 4.5.   GloFaS interface showing (a) a global overview of medium (yellow), high
              (red) and severe (purple) reporting points; (b) a more detailed view of
              warning points in the USA; and (c) the return period hydrograph with return
              period thresholds (1.5 years, green; 2 years, yellow; 5 years, red; 20 years,
              purple) for one point in the USA                                                 20
Figure 6.1.   Locations of rain gauges in or near the Dodder catchment and Casement
              Aerodrome26
Figure 6.2.   Locations of NWP grid points in the Dodder catchment                             26
Figure 6.3.   Dublin radar precipitation grid overlapping the Dodder catchment                 26
Figure 6.4.   Cumulative depths of rain from three data streams and discharge (mm)             27
Figure 6.5.   Dodder flood forecasts 2001 (hourly) using precipitation from rain gauges        28
Figure 6.6.   Dodder flood forecasts for 2001 (hourly) using precipitation from NWP            28
Figure 6.7.   Dodder flood forecasts for 2001 (hourly) using precipitation from adjusted radar 29
Figure 6.8.   Locations of rain gauges used for the Suir catchment (to Caher Park)             30
Figure 6.9.   Locations of NWP grid points for the Suir catchment (to Caher Park)              30

                                                 vii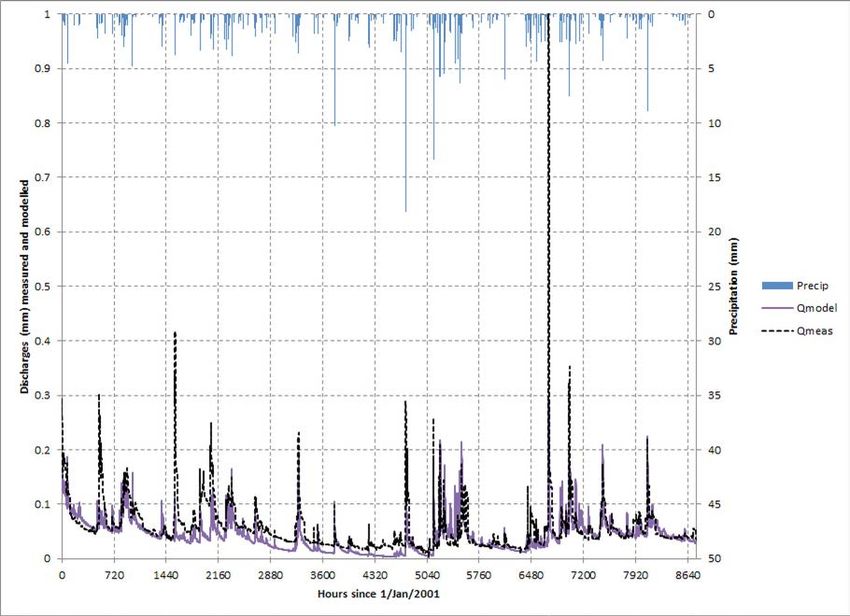
Flood Warning Technologies for Ireland
Figure 6.10. Cumulative volumes of precipitation from different data sources (Suir
catchment to Caher Park) 31
Figure 6.11. Simulation of the Suir catchment for 2001 with precipitation estimates from
rain gauges 32
Figure 6.12. Simulation of the Suir catchment for 2001 with precipitation information
from NWP 32
Figure 6.13. Rainfall stations used for the Boyne catchment simulations 33
Figure 6.14. Radar grid cells used for the Boyne catchment simulations 34
Figure 6.15. Locations of NWP grid points in the Boyne catchment 34
Figure 6.16. Boyne (at Slane Castle) cumulative rain gauge, NWP, radar and discharge
depths (mm) 34
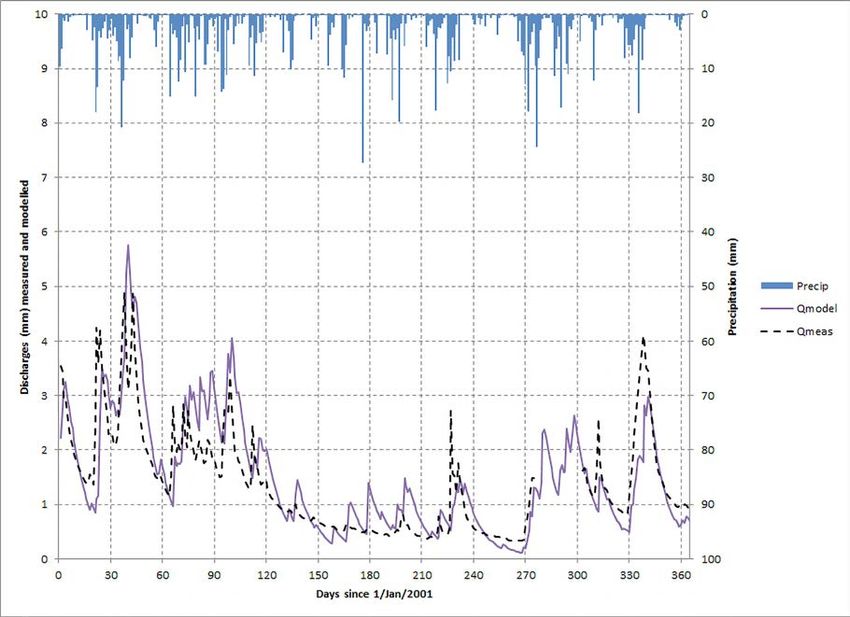
Figure 6.17. Simulation of the Boyne catchment for 2001 with precipitation estimates
from rain gauges 36
Figure 6.18. Simulation of the Boyne catchment for 2001 with precipitation information
from adjusted radar 36
Figure 6.19. Simulation of the Boyne catchment for 2001 with precipitation information
from NWP 37
Figure 7.1. Structure of the SMARG and SMART models. Source: Mockler et al. (2016) 41
Figure 7.2. Thematic concept of a simple flood forecasting system 42
Figure 7.3. Sample output composite graphic generated by the forecasting engine 42
Figure 7.4. Composite graphic as accessed through web browser 42
viiiList of Tables
Table 3.1. Potential advantages of different rainfall–runoff modelling approaches 11
Table 3.2. Classification of floodplain inundation modelling approaches 12
Table 4.1. Typical functionality in flood forecasting systems 15
Table 6.1. Summary of model fitting results (Dodder) 27
Table 6.2. Rain-gauge stations open in catchment of Caher Park in 2001–2003 30
Table 6.3. Annual average fluxes for the Suir catchment (to Caher Park) for the period
2001–200330
Table 6.4. Summary of model fitting results (Suir catchment) 31
Table 6.5. Annual average fluxes for the Boyne catchment (Slane Castle) 35
Table 6.6. Summary of model fitting results (Boyne catchment) 35
Table 6.7. Real-time flood forecasting for the River Boyne with rain-gauge
precipitation source 38
Table 6.8. Real-time flood forecasting for the River Boyne with NWP precipitation source 38
Table 6.9. Real-time flood forecasting for the River Boyne with adjusted radar
precipitation source 38
Table 6.10. Real-time flood forecasting for the River Suir with rain-gauge precipitation
source38
Table 6.11. Real-time flood forecasting for the River Suir with NWP precipitation source 38
Table 6.12. Real-time flood forecasting for the River Dodder with rain-gauge
precipitation source 39
Table 6.13. Real-time flood forecasting for the River Dodder with NWP precipitation source 39
Table 6.14. Real-time flood forecasting for the River Dodder with adjusted radar
precipitation source 39
ixExecutive Summary
FloodWarnTech was an Environmental Protection The conclusions from the project are as follows:
Agency (EPA)-funded desk study of flood warning,
1. The proposed national flood warning service
with a specific focus on Ireland. Its objectives were
should be implemented as soon as possible.
to investigate (1) flood forecasting techniques and
systems in use in Ireland and elsewhere; (2) methods 2. This service should consider the broader aspects
and models best suited for use in Ireland; and (3) the of flood warning identified by the workshop
optimal use of relevant data sources, observations and participants, listed above, especially the effective
forecasts for flood forecasting. communication of warnings to the public and
to decision makers. The generation and use of
The project started with an extensive review of the
uncertainty information is recommended.
topic and of existing forecasting systems. It held a
well-attended workshop at which (1) invited experts 3. The rain-gauge network has a critical role to play
described some of the internationally available flood in the performance of flood forecasting systems
warning platforms, suitable for use in Ireland, and (2) and should be preserved and enhanced where
an opportunity was provided for potential users of small catchments contribute to critical floods. This
warning systems and for stakeholders, from a wide project did not have the resources to consider the
range of emergency responder organisations, to use of X-band radar for these critical areas. This
discuss their forecasting and warning requirements. could be a separate study.
The workshop agreed on the need for further data
4. Both radar and numerical weather prediction
collection, improved modelling and also closer
(NWP) contribute value to flood forecasting, with
involvement of users, the public and the media. A
the potential, particularly of NWP, to extend useful
desire was expressed for some forecast uncertainty
forecast lead times.
information and flood response planning and river
maintenance were identified as important aspects of Suggestions for further investigations included:
the problem.
1. The full MÉRA reanalysis data set is now available
In addition, the project investigated, for three (the FloodWarnTech project had access only
selected catchments, the value of different sources to a pre-release 3-year data set). The model
of precipitation information (rain gauges, radar and simulations and data source tests carried out here
numerical weather models) as inputs to hydrological should be extended and undertaken for the full
models to simulate river flows. This highlighted the duration of the data set. This would augment and/
continuing value and importance of the terrestrial rain- or strengthen the conclusions.
gauge network.
2. This project did not examine methods of
The project also demonstrated, with assistance from assimilating upstream stream discharge into
its developers, the use of an existing real-time flood forecasting systems. For a number of the larger
forecasting system. rivers in Ireland, this is potentially of value and
should be investigated.
xi1 Introduction
1.1 Background: Flood and Flood systems with high spatial resolution and adequate
Hazard lead time to cope with such increasing flood hazards
cannot be overstated. Timely and accurate forecasts
Flooding occurs when a body of water rises to
and warnings, are needed by emergency services and
overflow land that is not normally submerged (Ward,
for public preparedness for, and their response to,
1978). While this definition explicitly includes all types
flooding events.
of surface inundation, floods are typically classified
into four categories, viz., riverine (fluvial), coastal, Flood forecasting and warning systems share the
groundwater and urban (often called pluvial) flooding. basic functions of collecting, processing, analysing
This study is limited to riverine floods, which occur and disseminating hydrological information, ideally
when a river discharge exceeds its bankfull capacity in real time (Bedient et al., 2013). Together, these
(Leopold et al., 1964). Water levels increase above the functions can provide advance warnings of impending
bank level of the river and inundate its surroundings. flood conditions. For river flooding in Ireland, rainfall
Based on their nature and speed of occurrence, some is often a key input, although other meteorological
pluvial floods are called flash floods and these typically factors may be required. These include observations
occur within 6 hours of rainfall events. Short, intense or estimates of air temperature, wind speed, net
bursts of rainfall, commonly from thunderstorms, and solar radiation and soil moisture (Sene, 2008).
typically cause such floods. Endangered communities Additional data required may include reservoir and
normally have a limited response time. Other hazards, lake evaporation and, in other countries, snow cover,
such as landslides and mudflows, often accompany river ice cover and ice jam locations. Nonetheless,
flash floods, causing damage, physically to property modern flood forecasting and warning systems have
and psychologically to people, and, in extreme evolved to meet the distinct needs of different clients,
situations, deaths. Fluvial flooding, on the other hand, regions or countries. Consequently, these systems and
is marked by relatively slowly rising water levels of the organisations that oversee them differ considerably
main rivers and a gradual inundation of floodplains and in complexity, size and scope.
is associated with longer duration rainfall (Ward, 1978;
Significant advances in flood forecasting have
Maskey, 2004; Dingman, 2015). Flash floods present
been achieved through a range of improvements
a more daunting challenge to the preparedness of
in observation capabilities, modelling techniques
flood-prone communities while the larger scope and
and decision support systems. The most notable
longer duration of typical fluvial flooding constitutes a
improvements are remote sensing observations,
major challenge to the scale and endurance of disaster
such as satellite and radar, and associated
management arrangements (Rosenthal and Hart,
computer modelling techniques for processing these
1998).
observations to produce lead times varying from hours
In the last decade, public and governmental concern to days. Some satellite-based precipitation products
has resulted in them demanding improved flood with high temporal and spatial resolution (near real
warnings (Penning-Rowsell et al., 2000; Handmer, time) have recently been developed. Advanced
2001) and that the monetary benefits are recognised techniques have also been developed for deriving very
(Pappenberger et al., 2015). A recent review of high resolution (spatial and temporal) real-time rainfall
climate change-related natural hazard and disaster estimates from weather radar data, either adjusted or
vulnerabilities (Bruen and Dzakpasu, 2018) cites merged with gauged rainfall.
predictions of increases in the frequency and intensity
New techniques have been developed for merging
of extreme precipitation events. These will lead to
multiple sources of information to produce rainfall
more severe flooding, which become more hazardous
forecasts with extended lead times. These combine
as urbanisation forces increasing populations into
satellite-based rainfall, radar rainfall, gauged
floodplains. Therefore, the need to develop forecasting
rainfall and numerical weather prediction (NWP)
1Flood Warning Technologies for Ireland
model outputs to produce rainfall forecasts. Recent Medium-Range Weather Forecasts (ECMWF), and are
improvements in the accuracy and resolution of available to the Office of Public Works (OPW). Local
NWP models have enhanced the quality of ensemble services are typically developed by the OPW and
rainfall forecasts. Improved real-time rainfall estimates operated by local authorities in close co-operation with
and forecasts give rise to the prospect of improved state and local government agencies. The national
flood forecasts. This prospect is further enhanced by agencies, such as OPW, Met Éireann and Civil
advances in the use of microwave satellite data to Defence, provide support services, such as information
derive information on soil moisture (Owe et al., 2001; (in the form of warning products) and specialist support
Alvarez-Garreton et al., 2014), evapotranspiration, and advice. These include radar-based weather
land use (Karimi and Bastiaanssen, 2015), snowpack information, appropriate flood response and action
extent (Mhawej et al., 2014) and flood inundation plans, and support and guidance in the establishment
areas (Lacava et al., 2015) to improve flood modelling. of automated local flood warning systems. However,
there is a need for a more efficient flood forecasting
At present, there is no operational flood forecasting
and warning system for the whole of Ireland (JBA
service with national coverage in Ireland. Flood
Consulting, 2011). Such a system is in the planning
forecasting and warning services are provided on
stage and will help to cope with future events predicted
either a regional or a local basis. Regional services
to be more severe as a result of climate change (Bruen
are provided by the European Flood Awareness
and Dzakpasu, 2018) and various other factors,
System (EFAS), hosted by the European Centre for
including population growth and rapid urbanisation.
22 Input Data for Flood Forecasting
The main inputs that are required to a river flood complex physical characteristics of a basin (Dingman,
forecasting model typically include river level or flow 2015), is used to estimate stream flow rates and water
observations and precipitation estimates by rain levels in near real time as they respond to rainfall. The
gauge, weather radar or satellite data. This information outputs from these models can provide flood warnings.
is usually received by telemetry, although manual Early warnings allow for adequate time to evacuate
observations are also used. Rainfall forecasts are also affected areas, shutdown vulnerable transportation
increasingly used to extend lead times further, and infrastructure, install demountable barriers, deploy
forecasts for other variables are sometimes required, emergency workers and establish emergency short-
such as of air temperatures for use in snowmelt term flood protection for vital structures (Looper and
models. Vieux, 2012).
Hydrological modelling outputs contain significant
2.1 Rainfall Estimates uncertainties (Krzysztofowicz, 2001; Beven, 2010;
McMillan et al., 2012; Dogulu et al., 2015) from
In temperate regions, precipitation is the most
uncertainties in the data, the model structure and
significant factor influencing the frequency and
its parameters, and the perceptual model of the
magnitude of flooding events (Bloschl et al., 2015). Of
underlying hydrological system (Dogulu et al.,
the several strategies for flood alleviation that have
2015). For rainfall, possible sources of uncertainty
been identified and applied in various flood mitigation
and error are the temporal and spatial variability
schemes (Figure 2.1), one of the most important is
(Faurès et al., 1995; Goodrich et al., 1995; Shah et
the use of precipitation information in flood forecasting
al., 1996; AghaKouchak et al., 2010), which provides
and warning. These depend largely on hydrological
a critical challenge for hydrological forecasting.
and hydraulic models for flow prediction (Takeuchi,
In addition, accurate rainfall data is needed in
2001). A hydrological model, which conceptualises the
model calibration to produce parameter sets that
Structural
Water Control Non-Structural
Storage - dams, reservoirs, Flood forecasting and warning Loss
detention and retention basins
Public response: risk information Reduction
Channel conveyance and education
alterations
Containment - flood walls,
demountable barriers,
Insurance Financial &
dykes and bank raising Humanitarian assistance Material
Infrastructure flood proofing assistance
Catchment measures - Planning policy and instruments
landuse change,
drainage modification Relocation of people and/or Land-use
infrastructure
Figure 2.1. Alternative flood alleviation strategies.
3Flood Warning Technologies for Ireland
represent basin characteristics. Widespread use of However, optimal gauge density and spacing is, for
hydrological models has demonstrated the need for the most part, never achieved in river basins (Smith
accurate rainfall fields to have confidence in runoff et al., 2007). Economic and practical considerations
and streamflow predictions (Beven and Hornberger, result in limited gauge networks that usually give a
1982; Kalinga and Gan, 2006; Cole and Moore, poor representation of the rainfall field over the basin
2008; Berne and Krajewski, 2013; Xu et al., 2013). (Volkmann et al., 2010). A rain gauge network density
No matter how well a model is founded in physical of one gauge per 65 km2 is recommended (Huff,
theory or empirically justified by past performance, it 1970) to achieve an average sampling error of less
cannot produce accurate runoff predictions if forced than 5% in recorded 6-hour rainfall accumulations.
with inaccurate rainfall data. Inaccurate rainfall data The density required, however, changes according to
directly compromise the integrity of the model and operational considerations. WMO (2008), on the other
the associated critical decisions (Golding, 2009). For hand, recommends rain gauge densities according
small catchments, such as those typically found in to catchment type at one gauge per 250 km2 for
Ireland, the timing and location of rainfall is critical mountainous catchments or at one gauge per 900 km2
in reproducing hydrographs. There is thus an urgent for flat catchments. The US Army Corps of Engineers
need to acquire reliable precipitation estimates at high (1996) recommends a network design with evenly
spatial (e.g. a few kilometres or less) and temporal distributed gauges at a spatial density determined by
(e.g. hourly or less) resolutions (Berne and Krajewski, equation 2.1:
2013).
N = A0.33 (2.1)
where N is the number of gauges and A is the area of
2.1.1 Rainfall estimation by rain gauges
the basin (in square miles).
Rain gauges are the most popular and widely used
Other factors that can affect the optimal network
method for recording rainfall accumulations at a
density of rain gauges include climatic patterns,
single location. While they can provide accurate
topography (Lobligeois et al., 2014), typical storm
point measurements, they are subject to numerous
type (Huff, 1970) and character of extreme rainfall
sources of error and uncertainty, which limit their
events (Barge et al., 1979). In the unique case of
use in operational flood forecasting models (Wilson
localised rainfall events, a dense rain gauge network
and Brandes, 1979; Sinclair and Pegram, 2005).
is desirable for operational flood forecasting. However,
These relate to the inability of rain gauges to capture
the installation of such a network may be impractical
the spatial variability of a rainfall field. Moreover,
(Zhu et al., 2013). Therefore, rainfall is often
systematic and calibration errors affect the accuracy
mischaracterised during high-intensity, small spatial-
of rain gauges through evaporative losses, splash-out,
scale events, leading to significant errors in predicted
wind effects, valley effects, tree and building cover or
stream flows (Golding, 2009). Several methodologies
miscalibration.
have been developed to optimise the location and
Distributed hydrological models require a spatial density of rain gauge networks (Pardo-Iguzquiza,
distribution of rainfall over entire catchments. Rain 1998; Jung et al., 2014).
gauges can provide only a fractional coverage of the
The high variability in rainfall fields has a
entire spatial domain and are thus often unable to
demonstrated effect on runoff modelling (Schilling
provide an accurate representation of the variability
and Fuchs, 1986; Faures et al., 1995). In areas
in a large rainfall field. Consequently, a network of
dominated by high-intensity rainfall events with
gauges is used to produce the spatial distribution
significant spatial variability, rain gauge density
and to interpolate rainfall accumulations at ungauged
and placement can strongly influence the predicted
locations. However, this spatial variability cannot be
stream flows from hydrological modelling, leading
adequately captured through the interpolation of point
to increased uncertainty in model outputs. This
rain gauge values (Sinclair and Pegram, 2005). The
can have detrimental consequences for the use of
interpolation accuracy of rainfall datasets depends
rainfall estimates from rain gauges alone as input into
on having an optimal network density and spacing
hydrological models for flood forecasting, which has
(Rodriguez-Iturbe and Mejia, 1974; Xu et al., 2013).
led to calls for the improvement of rainfall estimation
4M. Bruen and M. Dzakpasu (2014-W-DS-17)
(Wilson and Brandes, 1979; Kouwen, 1988; Borga The use of radar for quantitative precipitation
et al., 2000, 2002; Beven, 2002; Goudenhoofdt and estimation (QPE) in hydrological models began
Delobbe, 2009; Looper and Vieux, 2012). These in the early 1960s, when the spatial distribution
calls have led to the investigation of other methods to of radar information markedly improved real-time
increase the accuracy of rainfall estimation. flash flood warning in comparison with rain gauge
data (Wilson and Brandes, 1979). Since then, many
In Ireland, Met Éireann co-ordinates rainfall
studies (e.g. Vehviläinen et al., 2000; Cranston and
measurements in Ireland with data collected from its
Black, 2006; Smith et al., 2007; Looper and Vieux,
own rain gauges and those operated by individual
2012) have demonstrated how radar estimates
volunteers and organisations. Rainfall data are
substantially increased the accuracy of flood
collected hourly, daily or monthly. The majority of the
forecasting hydrological models during extreme
approximately 750 rain gauges located throughout
rainfall events. Collier (1986) demonstrated that
Ireland are read daily. The remainder are monthly read
a rain gauge network spacing of one gauge per
gauges located in remote areas. Monthly readings
20 km2 was needed to provide a spatial distribution
are of little value to flood forecasting. Met Éireann
of the rainfall field as accurately as radar. However,
makes hourly rainfall data available on its website from
despite these advantages in the early stages of its
25 locations. These provide valuable information on
application, the lack of knowledge and understanding
rainfall intensity. However, the spatial distribution of
of the inaccuracies associated with radar imagery
these may be inadequate for the needs of a national
limited its widespread use for hydrological modelling
flood forecasting service.
(Jayakrishnan et al., 2004; Golding, 2009).
Met Éireann also operates two weather radar systems
The uncertainties associated with radar QPE stem
that can provide precipitation estimates. Currently, the
from their being an indirect measurement of rainfall
radar images are mainly used subjectively to assess
and they thus are subject to multiple sources of error,
the areas of intense rain and to track the movement
e.g. radar beam blockage, beam power attenuation,
of rain storms. Furthermore, Met Éireann operates
ground clutter and anomalous propagation of the
a high-resolution NWP model. However, the existing
signal (Joss et al., 1990; Collier, 1996; Harrison et
flood forecasting systems in Ireland do not currently
al., 2000; Michelson and Koistinen, 2000; Einfalt et
use rainfall estimates derived from both radar and
al., 2004). Other factors include variability in time and
NWP models. The availability of rainfall forecasts
space of the vertical profile of reflectivity (VPR) and
based on multiple sources of information provides an
issues related to the microphysics of precipitation,
impetus for developing a national flood forecasting
influencing the relationship between radar reflectivity
system as well as for improving the existing flood
and quantity of precipitation. Furthermore,
forecasting systems, as is shown in this project.
spatiotemporal sampling errors can arise from the fact
that radar beam measures rainfall at significant heights
2.1.2 Rainfall estimation by radar above the ground. Between the measurement location
and the ground, the rainfall can move substantial
Weather radars can produce estimates of precipitation
lateral distances or even evaporate before reaching
over large geographical areas using measurements of
the ground. Electromagnetic interferences, e.g.
reflectivity and can therefore provide information about
from wi-fi systems, may also influence performance,
rainfall patterns at high temporal and spatial resolution.
potentially degrading the quality of rainfall estimates.
Furthermore, radars can provide rapid updates of the
three-dimensional structure of precipitation. These Gauge-based adjustment of radar QPEs has proven
advantages led to more wide-spread operational effective in reducing these errors and improving the
usage of radar precipitation measurements. Their accuracy of the estimates and thus their applicability
potential applications for hydrological modelling have for hydrological applications (Steiner et al., 1999;
been the subject of extensive research (Browning, Harrison et al., 2009). However, most gauge-based
1978; Bonnifait et al., 2009; Cole and Moore, 2009; adjustment methods have been tested and applied
Collier, 2009; Viviroli et al., 2009; Looper and Vieux, at large spatial and temporal scales (Smith and Seo,
2012; Keblouti et al., 2013). 1996; Fulton et al., 1998; Anagnostou et al., 1999;
5Flood Warning Technologies for Ireland
Todini, 2001; Germann et al., 2002, 2006; Gerstner 2.2 Merging of Gauge and Radar
and Heinemann, 2008; Goudenhoofdt and Delobbe, Rainfall Estimates
2009; Harrison et al., 2009). The relatively few tests
Several efforts have addressed the limitations
that have been conducted at urban/small scales report
associated with the gauge and radar rainfall estimation
that at these scales more dynamic and localised
discussed in section 2.1 by merging their outputs.
adjustments are required (Wood et al., 2000; Sinclair
This merging seeks to build on the strengths of each
and Pegram, 2005; Chumchean et al., 2006; Borup et
method while reducing their individual weaknesses
al., 2009; Wang et al., 2013; Löwe et al., 2014).
(Erdin, 2009). It has since been recognised that the
combination and adjustment of radar rainfall data
2.1.3 Effect of radar uncertainty on with rain gauge accumulations significantly improves
hydrological forecasting the accuracy of rainfall estimates and subsequent
hydrological modelling outputs (Kouwen 1988;
The uncertainties of radar QPE owing to the errors of
Vehviläinen et al., 2004; Kalinga and Gan, 2006;
calibration and processing have detrimental effects
Kim et al., 2008; Looper and Vieux, 2012). Some
on the quality of hydrological modelling forecasts. For
techniques for merging gauge and radar estimates
example, Kouwen and Garland (1989) reported that
have thus been developed for operational use, which
anomalous propagation, clutter and visibility effects
can be classified broadly into two categories, namely
caused significant errors in the QPE, which led to
bias reduction and error variance minimisation (Wang
an about 10% overestimation of the predicted peak
et al., 2013). Nevertheless, these merging techniques
flows. Similarly, Borga et al. (2002) reported that
have been shown to improve accuracy mainly at time
range-related errors, VPR effects and errors due to
steps greater than 1 hour. At time steps of less than an
miscalibration of the Marshall–Palmer Z–R relationship
hour, the accuracy approaches that of raw radar alone
significantly affected streamflow simulations, resulting
on account of spatiotemporal sampling errors involved
in errors of similar magnitude to those in gauge-only
in the direct comparison of radar and gauges.
simulations. However, Krajewski et al. (2010) showed
that improvements in radar hardware and software
have improved the quality of radar QPE significantly. 2.3 Rainfall Forecasts
Nonetheless, radar data need significant correction
Accuracy and lead time of precipitation forecasts are
before use in hydrological forecasting (Jayakrishnan et
vitally important parameters of any flood forecasting
al., 2004; Neary et al., 2004).
system. Without precipitation forecasts, the warning
On the other hand, the impacts of radar-derived lead time is limited to the catchment response time,
QPE on the accuracy of hydrological model outputs which depends on catchment morphology, size
are significantly higher in small catchments, and land use. Skilful forecasts of precipitation are
particularly in urban areas, than in larger basins required for effective warning of flash flooding in
(Bell and Moore, 1998; Collier, 2009; Schellart et small, fast-responding catchments and for extending
al., 2010, 2012, 2014). According to Vehviläinen the flood warning lead times in other catchments.
et al. (2004), in small catchments of less than Developments in quantitative precipitation forecasting
500 km2 where response times are of the order of (QPF) techniques have proven valuable for many
hours, hydrological models can benefit from the hydrometeorological applications (Zahraei et al.,
high temporal and spatial resolution of radar data. 2013). The real benefit of QPFs, however, depend on
However, mountainous topography can significantly the lead time of the forecasts, which range from very
impact on radar QPE by blocking radar beams, short (1–6 hours) and short (12–72 hours) to medium
resulting in simulations of comparable accuracy in (72–240 hours) (Cuo et al., 2011). For example,
radar-driven hydrological model outputs as gauge high-resolution QPFs with lead times of 1–6 hours
only-driven results (Borga et al., 2000). Therefore, enhances forecasting and warnings for flash flooding
although the use of radar for QPE can potentially (Hapuarachchi et al., 2011) and flooding in small,
increase the accuracy of the rainfall input, an fast-responding catchments. In small catchments,
understanding of location-specific factors is required forecasts based on observed discharge is of little
to determine the worth of the radar. practical use on account of the very short lead time
6M. Bruen and M. Dzakpasu (2014-W-DS-17)
(Ehret, 2003). Forecasts based on observed discharge of nowcasts benefit from the high spatial and temporal
combined with a rainfall–runoff model using observed resolution of the forecasts (Wilson et al., 1998), they,
precipitation have a slightly increased lead time. nevertheless, need to be balanced against the short-
Unfortunately, because of the short concentration time range of applicability of the forecasts.
times, even this is often insufficient to take effective
Numerical weather prediction uses models that resolve
preventive actions.
the dynamics and physics of the atmosphere on scales
While QPF provides possibilities of extending the ranging from the global scale to the mesoscale and
forecast lead times, current computational constraints can provide predictions of rainfall as well as other
restrict their operational forecast update cycles to meteorological quantities. Nevertheless, the increase
hours (e.g. every 6 hours), whereas convective in the resolution of NWP models and the need to
phenomena typically exhibit life times of tens of improve the prediction of small-scale features by
minutes (Browning, 1979). Short-time forecasts of a appropriate physical parameterisations presents a
few hours can be based on radar data using statistical significant challenge in the hydrological application
methods. On account of the uncertainties and of NWP rainfall forecasts (Cloke and Pappenberger,
errors associated with radar rainfall measurements, 2009). Unlike radar nowcasts, NWP rainfall forecasts
reasonable forecasts can only be achieved if radar suffer from imperfect assimilation of the initial state
precipitation is combined with surface observations of of the atmosphere. NWP models typically suffer from
rainfall. These combined rainfall rates with their high “spinup” errors in the first few hours before settling
spatial and temporal resolution can be used to develop (Golding, 1998). Many authors (e.g. Bowler et al.,
reasonable rainfall forecasts. These forecasts can then 2006; German et al., 2006) suggest that extrapolation-
be put into rainfall–runoff models to provide discharge based precipitation nowcasts have superior skill
forecasts. Thus, QPFs enable the modelling of runoff compared with NWP forecasts for lead times up to 6
and flow processes at a longer lead time to control hours. However, recent findings (Ballard et al., 2016)
the critical situations of flood-induced damage based demonstrate the potential for improved nowcasting
on adequate control decisions (Krämer and Verworn, using frequently updated initial conditions for
2009). Two approaches with different time scales of convection-permitting NWP. Moreover, NWP ensemble
applicability are in use for QPF, namely forecasting prediction systems can exhibit greater forecast skill
by NWP and forecasting of rainfall by extrapolation (Cloke and Pappenberger, 2009) than single NWP
from weather radar rainfall estimates (called radar deterministic model runs. The ensembles increase
nowcasting). forecast accuracy and allow for skilful predictions at
longer lead times (Buizza et al., 1999; Demeritt et al.,
Nowcasting emphasises the short-term nature of the
2007). Furthermore, NWP model-based probability
forecast of 0–6 hours (Wilson et al., 2004) at high
forecasts issued on consecutive days are usually more
spatial (e.g. 1 km) and temporal (e.g. 5 minutes)
consistent than single-valued forecasts (Buizza, 2008).
resolutions (Liguori and Rico-Ramirez, 2013).
Therefore, although radar nowcasts are preferable
Nowcasting is usually based on the analysis of a
for short forecast periods, NWP rainfall forecasts are
short series of radar images providing estimated
preferable for long forecast periods (Lin et al., 2005).
rainfall distributions at consecutive times, which are
extrapolated into future rainfall patterns. They are Advances have been made in building hybrid forecast
characterised by a good accuracy at the start of the systems aimed at blending the different forecast
forecast, as the precipitation is observed directly, capabilities of NWP and radar nowcasting systems
which decreases very rapidly with lead time, as with respect to the forecast lead time (Golding, 1998;
the basic extrapolation techniques generally do Pierce et al., 2000). Recent advances have further
not account for growth and decay processes in the exploited this approach to hybrid forecasting through
atmosphere (Golding, 1998). Nowcasts are potentially the STEPS (Short-term Prediction System; Bowler
valuable in the predictions of quickly developing et al., 2006) and SBMcast (Berenguer et al., 2011)
high-intensity rainfall events (Wilson et al., 2004), models. Data assimilation into NWP models offers the
and are thus of vital importance in flood warnings ability to use all observations up to the present to get
and risk management for hydrometeorological events the best estimate of the state of the atmosphere, from
(Ruzanski, 2011). Although the hydrological application which nowcasts are produced. Currently, nudging,
7Flood Warning Technologies for Ireland
variational data assimilation (3D-Var and 4D-Var) and Zollo et al. (2015) used both infrared and microwave
ensemble Kalman filters (EnKF) for high-resolution information from a geostationary satellite with
data assimilation (Sun, 2005) at grid lengths in the traditional extrapolation methods to nowcast
range from 1 km to 10 km are being used in weather precipitation. They confirmed the usefulness of the
services or are under development across the world. method over the Campania region of Italy. However,
More recent developments have improved both as might be expected with a more distant data source
accuracy and extended lead times; see, for instance, with greater uncertainty than terrestrial radar, the good
Sun et al. (2014), who reviewed the progress with the performance was generally limited to short lead times
use of NWP in nowcasting, particularly in extending of less than 30 minutes.
predictions beyond a 1 hour lead time. Kato et al.
Several international research programmes
(2017) found that NWP was better than extrapolation
addressed the propagation of uncertainty through
for predicting the extent of heavy rainfall, even for
hydrometeorological forecast systems. For example,
lead times less than 1 hour. However, Simonin et al.
the COST Action 717 (Rossa et al., 2005) investigated
(2017) reported that in the UK, nowcasting using NWP
the use of radar observations in hydrological and NWP
generally did better than other techniques for lead
models by investigating how radar data can be most
times longer than 2 hours and that it was generally
effectively utilised in model assimilation schemes and
better for the extreme convective rainfall.
in combination with other observations. Additionally,
In addition to improving on the traditional methods it examined and defined the requirements for
(radar plus NWP), new ideas and techniques are European radar data for use in hydrological models.
being applied to nowcasting. For instance, Sokol et Furthermore, the COST 731 Action (Zappa et al.,
al. (2017) augmented the basic Lagrangian trajectory 2010; Rossa et al., 2011) considered the application of
method of extrapolating radar reflectivity by generating methods to describe the propagation into hydrological
100-member ensembles of the trajectory from which systems of the rainfall uncertainty from NWP models,
the probability of precipitation exceeding pre-defined radar data and nowcasting models through ensembles
precipitation rates can be calculated. They reported and how this uncertainty can be communicated to end
useful lead times up to 60 minutes for low rainfall users (Bruen et al., 2010). The COST 731 Action also
rates, in the Czech Republic, but a reduction of useful looked at improvements in NWP applications using
lead time to 30–40 minutes for precipitation rates radar data assimilation systems to improve short-range
greater than 3 mm/hour. Shakti et al. (2015) added a QPFs and high-resolution ensemble forecasts (Rossa
30-member ensemble technique to the STEPS method et al., 2010).
and applied it to nowcasting precipitation amounts in
In Ireland, the development of a radar rainfall
Japan with good results for lead times up to 1 hour.
forecasting method and its use for flood forecasting
The accuracy of the method was confirmed with radar
and warning using a radar data stream from Met
observations and rain-gauge measurements and was
Éireann was reported by Desta et al. (2012). That
maintained for higher intensity precipitation rates.
study and similar recent reports (e.g. Fairman
In a different approach, Shi et al. (2017) realised et al., 2015) indicate that the Met Éireann radar
that the traditional optical flow/Lagrangian advection observations at Shannon and Dublin led to a
approach ignores large amounts of historic radar significant underestimation of precipitation totals, to
data and they proposed a supervised “deep learning” the point where the radar composite over long periods
approach that can learn from historic rain storms. requires significant adjustment before quantitative
They reported better performance than for the more use. However, since the publication of these studies,
traditional approach. Han et al. (2017) applied a significant refurbishing of the radars has taken place
simpler “machine learning” approach and found good and their current performance may be quite different.
predictions of storm movement and growth.
83 Hydrological and Hydraulic Models
3.1 Flood Forecasting Models and runoff, infiltration, interception, evapotranspiration,
Methods soil moisture, percolation and baseflow components
are included, using a single “lumped” rainfall input
Two different types of water flow models are used in
for the whole catchment. Additional sub-models
flood forecasting systems. The first type consists of
may be further included, such as for reservoirs, the
rainfall–runoff (hydrological) models, which provide
abstractions and discharges related to water supply,
estimates of river flows or surface water runoff based
and simple flow routing components.
on rainfall observations and, in some cases, rainfall
forecasts. Flow routing models, on the other hand, The main data requirements of conceptual models
translate river levels or flows in a channel from one are typically for catchment-averaged rainfall values
location to others further downstream, sometimes and potential evaporation (or evapotranspiration)
allowing for complicating factors, such as tidal estimates. The sensitivity to the evaporation inputs
influences and operations at flow control structures. varies widely between model types and in some cases
The main types are hydrological and hydraulic (or an assumed seasonal variation may suffice. Where
hydrodynamic) models. a more accurate estimate is required, Penman and
Penman–Monteith approaches may be used. These
Generally, with these types of models, there is a
approaches are based on measurements or estimates
trade-off between the lead time provided, the forecast
of air temperature, wind speed, humidity and radiation.
accuracy and the uncertainty in outputs. For example,
Furthermore, real-time observations of evaporation
rainfall–runoff models, based on precipitation, can
or evapotranspiration may be used, albeit rarely, on
provide longer lead times, but uncertainty in the
account of difficulties in obtaining reliable estimates.
output is higher than those of flow routing models. For
both types, however, whenever possible, forecasts Data-driven (black box or data-based) models use
are adjusted based on comparisons with real-time techniques such as transfer functions and artificial
observations. This process, so-called real-time neural networks to represent the translation of rainfall
updating or data assimilation, is a key feature; it to flows or levels by one or more pathways, but without
distinguishes flood forecasting models from their necessarily requiring a physical interpretation of the
offline simulation counterparts and often leads to underlying mechanisms. For these models, usually,
improvements in forecast performance. Probabilistic there are fewer preconceptions about the number of
and ensemble techniques (Cloke and Pappenberger, parameters, the parameter values or the data inputs
2009) are also increasingly used to provide an required. Nevertheless, sophisticated time series
estimate of the uncertainty in model outputs. analysis techniques are often needed to identify
the optimum data sources, model structure and
coefficients. Moreover, in some cases, this process
3.2 Hydrological Models
is guided by ideas about the underlying modes and
The hydrological models may be classified into characteristic time scales inherent in the catchment
three main types, viz., conceptual, data-driven and response (Young and Ratto, 2009). Models are usually
physically based models. These models operate either event based, and therefore a real-time operation
on a lumped, semi-distributed or fully distributed basis, requires a suitable starting condition to be provided,
depending on the type. Simple examples of the use such as the current flow or a measure of catchment
of these models to represent the same catchment are state.
shown in Figure 3.1. Conceptual models represent
Physically based models are based on partial
a river catchment as a series of interconnected
differential and other equations for the surface runoff
conceptual stores, which fill, overflow, drain and
production within grid cells, the drainage to deeper
empty based on the rainfall inputs and the estimated
layers and the translation of surface and sub-surface
losses. Typically, various combinations of surface
flows between cells. Typically, these make use of
9Flood Warning Technologies for Ireland
Figure 3.1. Simple model representations of a catchment: (a) plan view of the catchment; (b) physically
based model with three soil and subsurface layers; (c) artificial neural network model; (d) conceptual
model with interception, surface runoff, soil and groundwater stores; (e) lumped model; (f) semi-
distributed model; and (g) fully distributed model. Source: Sene (2008).
grid-based inputs for rainfall and other forcing variables The relative merits of these different modelling
and spatial datasets for land use, topography, river approaches have been highly debated (Arduino et
drainage networks and other features. Ideally, the al., 2005; Todini, 2007; Sivakumar and Berndtsson,
calibration of these models would be based entirely 2009; Beven, 2012), and several international
on model parameters derived from laboratory or field intercomparison experiments addressed the issues,
experiments. For example, it is sometimes possible to specifically for real-time flood forecasting models
define typical values based on catchment topography, (WMO, 1992; EFFS, 2003) and more generally for
soil types, channel characteristics and other factors. distributed rainfall–runoff models (Reed et al., 2004,
For real-time use, another consideration is that 2007; Andréassian et al., 2006; Smith, M. et al., 2013),
models of this type typically require multiple sources which provide several useful lessons. Table 3.1 lists
of data at a high spatial resolution. Efficient numerical some of the advantages of each approach. However,
implementation, as in TOPKAPI (Todini et al., 2002), the conclusions regarding specific “brands” of models
and fast computation performance are important in are often not clear-cut. For example, the results
large spatial domains. are often influenced by the methodologies adopted
(Clarke, 2008), by the data intervals used (e.g. daily
Different combinations of these various approaches
or hourly) and by whether or not data assimilation
may also be employed for flood forecasting. Examples
procedures were included in the evaluation.
of these include physical-conceptual models, which
combine conceptual runoff production and cell-to-cell Some examples of rainfall–runoff models used in
routing components. Such modelling approaches operational real-time flood forecasting applications
operate on a gridded basis and data-driven models, include MIKE SHE (Système Hydrologique Européen)
which include pathways to represent typical surface (Refsgaard et al., 1995); PDM (the Probability
and groundwater flow response timescales. The latter Distributed Model) in the UK (Borga et al., 2002;
are sometimes called hybrid metric-conceptual models Cole and Moore, 2009; Liguori and Rico-Ramirez,
or grey box models. 2013); Grid-to-Grid in the UK (Bell et al., 2007;
10You can also read