How COVID-19 is changing the world: a statistical perspective Volume II - UPU
←
→
Page content transcription
If your browser does not render page correctly, please read the page content below
How COVID-19
is changing the world:
a statistical perspective
Volume II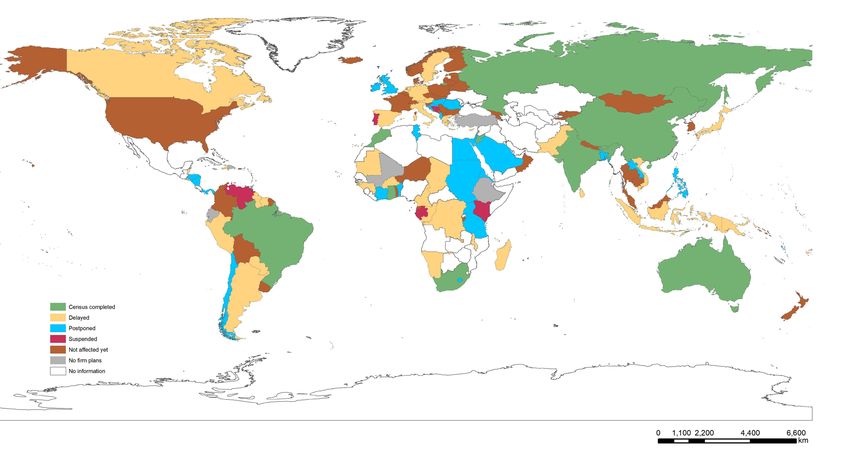
© 2020 Committee for the Coordination of Statistical Activities.
Some rights reserved.

This publication is copyrighted under the Creative Commons Attribution 3.0 IGO license.
The designations employed and the presentation of material on any map in this work do not imply the expression of any opinion
whatsoever on the part of the United Nations or other contributing organizations concerning the legal status of any country, territory,
city or area or of its authorities, or concerning the delimitation of its frontiers or boundaries. Dotted and dashed lines on maps represent
approximate border lines for which there may not yet be full agreement.

The publication has not been formally edited.
The Population Division of the United Nations Department of Economic and Social Affairs (UN DESA) provided desktop publishing, with
modifications on covers prepared by UNCTAD.
Contributing organisations
Asian Development Bank (ADB)
African Development Bank (AfDB)
Bank for International Settlements (BIS)
Cooperation Council for the Arab Countries of the Gulf (GCC)
European Central Bank (ECB)
Eurostat
Food and Agriculture Organization of the United Nations (FAO)
International Civil Aviation Organization (ICAO)
International Labour Organization (ILO)
Office of the United Nations High Commissioner for Human Rights (OHCHR)
Organisation for Economic Co-operation and Development (OECD)
Partnership in Statistics for Development in the 21st Century (PARIS21)
United Nations Children’s Fund (UNICEF)
United Nations Conference on Trade and Development (UNCTAD)
United Nations Development Programme (UNDP)
United Nations Economic and Social Commission for Asia and the Pacific (UN ESCAP)
United Nations Economic and Social Commission for West Asia (ESCWA)
United Nations Economic Commission for Africa (UNECA)
United Nations Economic Commission for Latin America and the Caribbean (ECLAC)
United Nations Educational, Scientific and Cultural Organization (UNESCO)
United Nations Entity for Gender Equality and the Empowerment of Women (UN Women)
United Nations High Commissioner for Refugees (UNHCR)
United Nations Human Settlement Programme (UN Habitat)
United Nations Industrial Development Organization (UNIDO)
United Nations Office on Drugs and Crime (UNODC)
United Nations Department of Economic and Social Affairs, Population Division (UN DESA/PD)
United Nations Department of Economic and Social Affairs, Statistics Division (UN DESA/SD)
United Nations World Tourism Organization (UNWTO)
Universal Postal Union (UPU)
World Bank (WB)
World Trade Organization (WTO)

                                                                                             1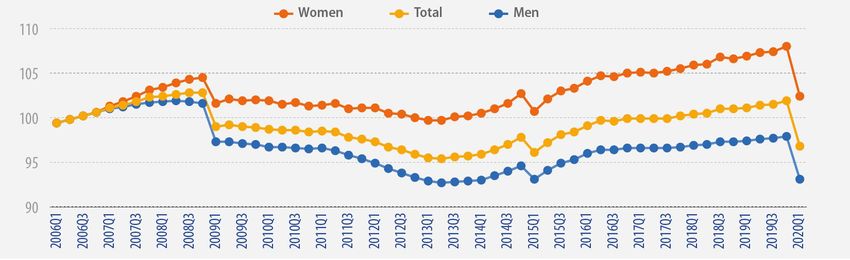
The Committee for the Coordination of Statistical Activities (CCSA)
    The CCSA is comprised of international and supranational organizations whose mandates include the provision of international official
    statistics guided by the Principles Governing International Statistical Activities (https://unstats.un.org/unsd/ccsa/principles_stat_ac-
    tivities/) and which have a permanent embedded statistical service that maintains regular contact with countries. The mandate of the
    CCSA is to ensure the efficient functioning of the international statistical system, to assist Governments in the development of common
    statistical standards, platforms and methodologies, and to provide inter-institutional support, outreach and advocacy for high-quality
    official statistics.

    More information can be found on the CCSA webpage: https://unstats.un.org/unsd/ccsa/

2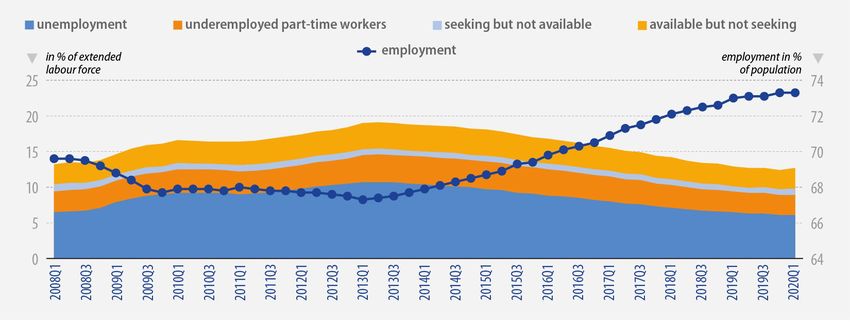
Introduction
  We are pleased to present the second volume of “How COVID-19 is changing the world: a statistical perspective”.
  Since the release of the first volume in May 2020, the COVID-19 pandemic has continued to rage around the world. By the end of
  August, countries around the globe had reported over 25 million cases, with nearly 850,000 deaths attributed to the disease.
  The pandemic presents tough choices. National and regional governments, local communities, health and school systems, as well
  as families and businesses are being forced to take many difficult decisions: How to re open safely? How to safeguard people’s
  lives and protect their livelihoods? Where to allocate scarce resources? How to protect those unable to protect themselves?
  Answers to questions like these will affect our short-term success in battling the virus and could have impacts for generations to
  come.
  More than ever, the world needs reliable and trustworthy data and statistics to inform these important decisions. The United
  Nations and all member organizations of the Committee for the Coordination of Statistical Activities (CCSA) collect and make
  available a wealth of information for assessing the multifaceted impacts of the pandemic. This report updates some of the global
  and regional trends presented in the first volume and offers a snapshot of how COVID-19 continues to affect the world today
  across multiple domains. The report also highlights the impact of the pandemic on specific regions and population groups.
  The information contained herein is even grimmer than in the first volume, confirming the unprecedented impact of the pandemic
  on the economic and social fabric of our societies. Some key findings are as follows:
     • Trends in COVID-19 caseloads differ widely by country, illustrating the unpredictable nature of the pandemic and the
       importance of remaining vigilant in our battle against the virus;
     • Global foreign direct investment is now projected to fall by as much as 40 percent in 2020;
     • Global manufacturing output fell by 20 per cent in April 2020 compared to the same period of the previous year, accelerating
       an already declining trend;
     • The pandemic is pushing an additional 71 to 100 million people into extreme poverty;
     • Globally, the first quarter of 2020 saw a loss of the equivalent to 155 million full-time jobs, a number that increased to 400
       million in the second quarter, with lower- and middle-income countries hardest hit;
     • Simulations suggest a steep and unprecedented decline in the Human Development Index (HDI), undermining six years of
       progress;
     • As recipients of 43 per cent of global remittance inflows, the developing economies of Asia and the Pacific are especially
       vulnerable to the global economic stall and its impact on the transfer of remittances by migrant workers;
     • To mitigate the impact of the pandemic in Africa, the African Development Bank has invested USD 10.2 billion to establish a
       Crisis Response Facility;
     • Data from 31 countries over the period 2014 to 2019 show that about 1 in 5 people reported having experienced
       discrimination on at least one of the grounds prohibited by international human rights law, highlighting the need for COVID-19
       responses to ensure that the pandemic does not exacerbate existing forms of discrimination;
     • Even before the pandemic, women did three times more unpaid domestic and care work than men; since the pandemic,
       however, data from rapid gender assessment surveys indicate that women in some regions are shouldering the extra burden
       of an increased workload, particularly in terms of childcare and household chores.
  The report also provides a glimpse of the challenges faced by national statistical systems. At a time when reliable information is
  more essential than ever, many systems are struggling to compile basic statistics, due in part to the pandemic but also because of
  a lack of resources needed to modernize operations and infrastructures.
  The data and statistics presented in this report are but the tip of an iceberg. Readers are encouraged to visit the websites of the
  contributing organizations, where they can find additional information on the impact of COVID-19 and other topics.
  Lastly, we would like to give special thanks to the CCSA secretariat (Statistics Division of UN DESA) and to the teams at UNICEF
  and in the Population Division of UN DESA, led by Mark Hereward and John Wilmoth, respectively, which joined forces to edit this
  collection of statistical information about the pandemic. Without their commitment and dedication, this report would not have been
  possible.

Angela Me                                      Haishan Fu
Chief, Research and Trend Analysis Branch      Director, Development Data Group
UNODC                                          World Bank
Co-chair CCSA                                  Co-chair CCSA                                               #StatisticalCoordination

                                                                                                                                        3
Table of
    Contents

4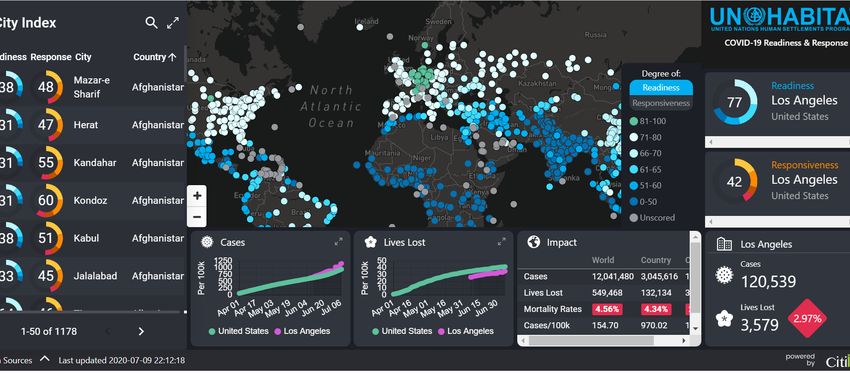
COVID-19 6
Differential success in mitigating the pandemic (UN DESA/PD)..............................................8
ECONOMIC IMPACT 10
Global banking up in the initial phase of COVID-19 (BIS) .................................................... 12
Need for high-quality data on a timely basis (ECB)...............................................................14
Aviation standstill with slow and shallow recovery (ICAO).................................................... 16
Working hours drop significantly (ILO)................................................................................18
Small, medium and vulnerable (OECD).............................................................................. 20
Many more children likely in monetary poor households (UNICEF) ........................................ 22
Dramatic drop in foreign direct investment (UNCTAD)...........................................................24
Slow recovery after production slump (UNIDO)....................................................................26
Disruption of the international postal supply chain (UPU)......................................................28
About 71 to 100 million people pushed into extreme poverty (WB).........................................30
Restrictions in exports (WTO)............................................................................................32
SOCIAL IMPACT 34
Addressing widespread discrimination (OHCHR).................................................................... 36
Human Development to decline for the first time since 1990 (UNDP)...................................... 38
Adequate catch-up strategies to lessen impact on learning (UNESCO)..................................... 40
Forcibly displaced disproportionally affected (UNHCR)............................................................42
Violence against women during COVID-19 (UNODC) ........................................................... 44
Gender inequality as society’s pre-existing condition (UN Women)...........................................46
REGIONAL IMPACT 48
Potential risk to remittances in Asia and the Pacific (ADB)..................................................... 50
AfDB’s response activities (AfDB) ............................................................................. .........52
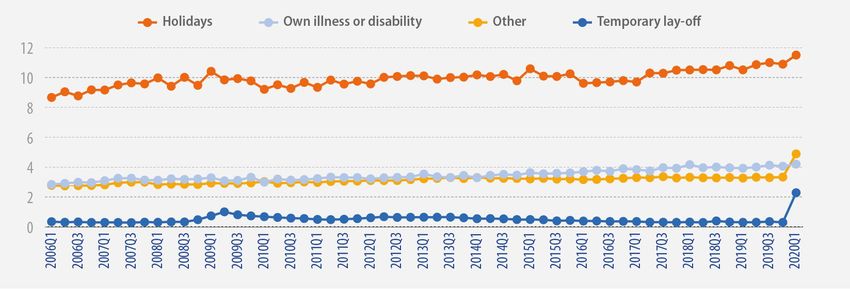
Effects on the EU labour market (Eurostat)......................................................................... 54
GCC countries’ intervention policies (GCC-Stat) .................................................................. 56
Impact on poverty and inequality in Latin America (ECLAC)................................................... 58
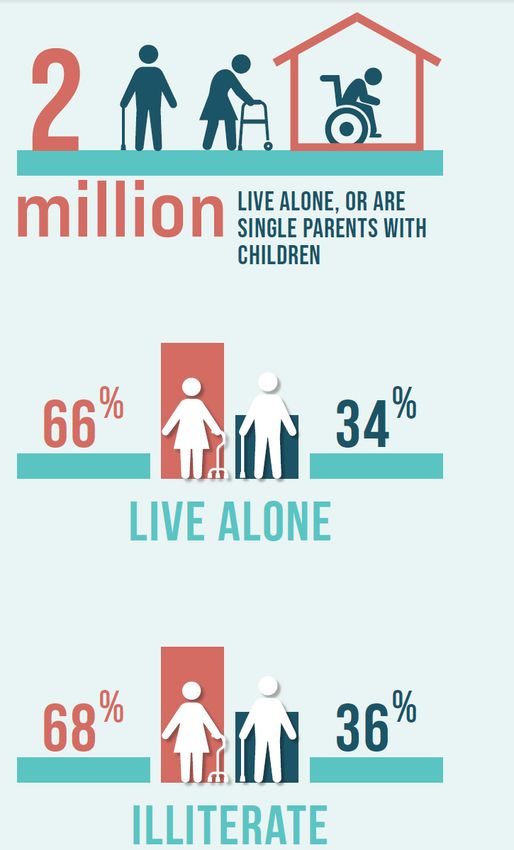
Impact on older persons in the Arab region (ESCWA)........................................................... 60
STATISTICAL IMPACT 62
Impact on censuses of agriculture and mitigation measures (FAO) ........................................ 64
NSOs and communicating COVID-19 (PARIS21)....................................................................66
Dashboards to monitor the COVID-19 impact (UN DESA/SD)..................................................68
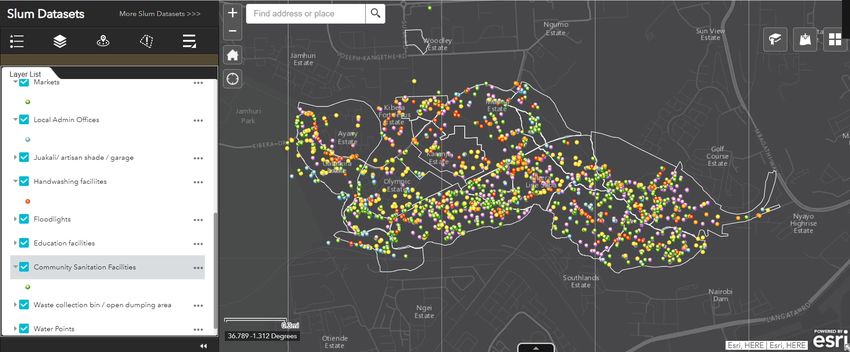
Data in support of COVID-19 response in cities (UN Habitat) ............................................... 70
Responses by National Statistical Systems in Asia and the Pacific (UN ESCAP)..........................72
Maintaining civil registration and vital statistics during the pandemic in Africa (UNECA)..............74
The impact of COVID-19 on tourism statistics (UNWTO).........................................................76
5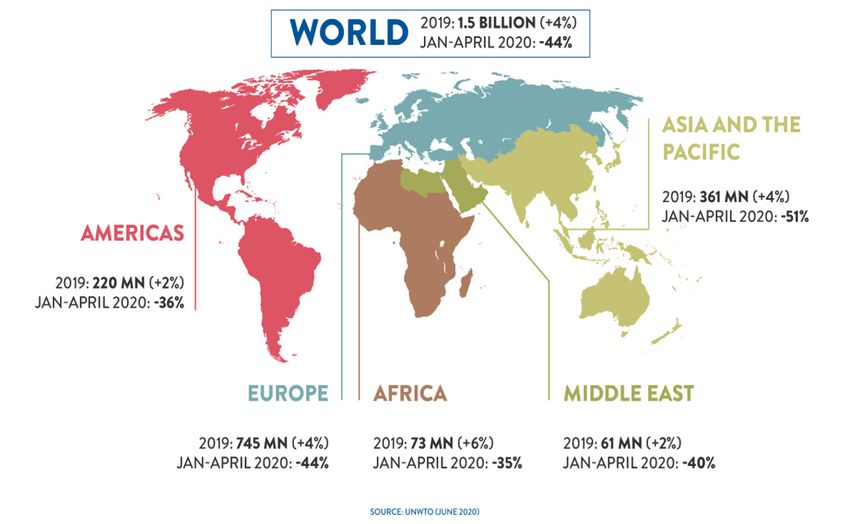
Covid-19

6
#StatisticalCoordination

                           7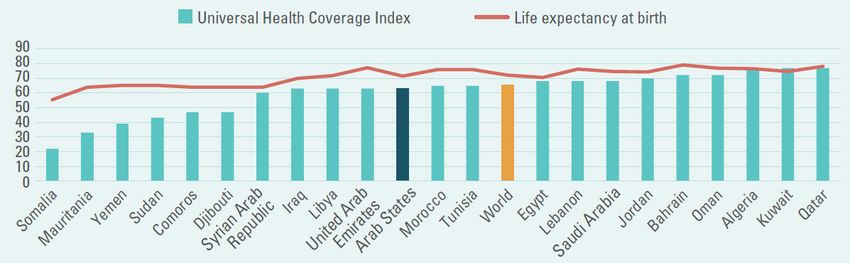
COVID-19

    Differential success in mitigating the pandemic
    Countries have experienced the COVID-19 pandemic under various circumstances and have adopted a variety
    of policy responses. Accordingly, they have experienced a wide range of trends in their daily caseloads.

                     Figure 1. Early epidemics                               Figure 2. Initial success, ongoing challenges

         Source: World Health Organization, Coronavirus Disease (COVID-19) Dashboard at https://covid-19.who.int/.

    All countries have been challenged by the novel coronavirus,        August. Meanwhile, the fire has raged without stop since late
    but they have not all fared the same. Here, distinctive patterns    February in Iran, where containment remains challenging.
    are illustrated using daily counts of new confirmed cases as        Like Italy, several countries in Europe and elsewhere reduced
    reported to the World Health Organization.                          a large outbreak to a slow burn but remain at risk for flare-ups
    Early scenarios of the COVID-19 pandemic often depicted             (figure 2). Like Iran, in several countries, caseloads have been
    waves, including a possible second wave in late 2020. On the        rising or remain at high levels (figure 3). Like China and the
    ocean, waves follow troughs with a predictable rhythm. For          Republic of Korea, some countries successfully mitigated the
    pandemic influenza, a summer trough has often been followed         epidemic, maintaining or reducing case counts close to zero,
    by a fall or winter wave. Yet daily case counts of COVID-19         but all remain at risk for flare-ups (figure 4).
    have followed various patterns, without a consistent summer         Few locations have seen epidemics that could be compared
    trough or a predictable second wave.                                to a fire storm. The most prominent examples are cities or
    A forest fire may be a more appropriate metaphor for the            regions within countries where the epidemic initiated or was
    spread of COVID-19. Both chaotic and unpredictable, a forest        concentrated, including Hubei province, northern Italy and
    fire may burn slowly in a controlled way; it may become larger      New York City.
    and more difficult to contain; or it may rage out of control like   For a successful re-opening, countries must remain vigilant in
    a fire storm. Airborne embers may land on dry wood, igniting a      the face of COVID-19. Just as a single ember can rekindle a
    new blaze or reigniting an old one. Wind and other factors may      fire that had been brought under control, the virus can easily
    accelerate the spread.                                              return to a population where it had been suppressed.
    Four countries with early epidemics—China, the Republic of          Stopping the uncontrolled spread of the virus requires a
    Korea, Italy and the Islamic Republic of Iran—illustrate the new    coordinated strategy, clear messaging and social solidarity.
    metaphor (figure 1). China and the Republic of Korea quickly        Even without a vaccine, countries can take decisive action to
    tamed the forest fire in February and early March and have          mitigate the pandemic and to create the essential conditions
    contained the blaze well since then. Italy controlled a fire that   for economies to reopen safely.
    raged during March and April, reducing it to a slow burn in June
    and July. Yet all three countries have seen flare-ups in July or

8
COVID-19
Figure 3. Rising or high caseloads Figure 4. Few cases, effective suppression
Source: World Health Organization, Coronavirus Disease (COVID-19) Dashboard at https://covid-19.who.int/.
Note:
• Figures prepared by United Nations Department of Economic and Social Affairs, Population Division, using data
from the World Health Organization, Coronavirus Disease (COVID 19) Dashboard, https://covid19.who.int/ (data last
updated 30 August, 12:47 pm CEST). Observations are 7-day moving averages; therefore, the last data point for each
country corresponds to 26 August.
• The vertical axes of figures 1 and 2 run from 0 to 8,000 cases; for figure 3, from 0 to 70,000; for figure 4, from 0 to 150.
• Confirmed cases are an imperfect measure of disease dynamics, both because they omit unreported cases and
because their trend may differ from the trend in deaths. Further analysis using all forms of available data is likely to yield
additional insights.
References:
Kristine A. Moore and others. “The future of the COVID-19 pandemic: Lessons learned from pandemic influenza”, Center for
Infectious Disease Research and Policy (CIDRAP), University of Minnesota, 30 April 2020, https://www.cidrap.umn.edu/sites/
default/files/public/downloads/cidrap-covid19-viewpoint-part1_0.pdf.
NBC News, Meet the Press, interview with Michael Osterholm, 21 June 2020, https://www.youtube.com/
watch?v=d_3cQZQLxJo.
9Economic
Impact
10#StatisticalCoordination
11ECONOMIC
Global banking up in the initial phase of COVID-19
Bank for International Settlements (BIS) statistics show that global cross-border bank credit surged in the first
quarter of 2020, accompanied, in particular, by a substantial increase in foreign claims on the US official sector.
In contrast, credit on emerging market and developing economies (EMDEs) stagnated. Lastly, the pandemic-
induced volatility in financial markets contributed to notable jumps in global banks’ derivatives positions.
Figure 1. Global cross-border claims1
Source: BIS locational banking statistics.
1
Quarterly changes are adjusted for breaks-in-series and exchange rate fluctuations. The annual growth rates are
calculated based on the adjusted changes for the last four quarters.
2
Includes claims on international organisations (in addition to claims unallocated by counterparty residence).
Against the backdrop of the COVID-19 pandemic, banks’ Another BIS dataset, the consolidated banking statistics
global cross-border claims surged in the first quarter of 2020. (CBS), tracks the globally consolidated positions of banks
International banking credit is here measured by the BIS headquartered in a given country. They cover global banks’
locational banking statistics (LBS), which follow balance of foreign claims—i.e., cross-border claims and local claims
payments residence-based concepts and track the claims booked by affiliates abroad (excluding inter-office positions).
(assets) and liabilities of banks located in a particular country. These data show that non-US banks’ foreign claims on the
Cross-border claims rose (on a break- and exchange rate- United States surged by nearly $950 billion in Q1 2020, the
adjusted basis) by $2.6 trillion in Q1 2020 (figure 1). This largest quarterly increase on record. Their local claims in local
increased their year-on-year growth rate to 10% at end-March currencies—i.e., dollar-denominated claims on US residents
2020, up from 6% a quarter before. Claims on borrowers in booked by the US-based affiliates of non-US banks—
advanced economies, esp. the United States, and offshore accounted for much of this expansion.
financial centres expanded the most.
12ECONOMIC
Figure 2. Claims on EMDEs
Source: BIS locational banking statistics; BIS consolidated banking statistics on a guarantor basis.
1
Data at end-4Q 2019.
A key factor was the significant rise (by $560 billion) observed Foreign bank lending to EMDEs is highly concentrated (figure
for non-US banks’ foreign claims on the US official sector, 2, right-hand panel). At end-March 2020, five bank nationalities
which includes the US government and the Federal Reserve (UK, US, Japanese, Spanish and French banks) accounted for
(US data show that non-US banks’ branches and agencies in almost two thirds of all foreign claims on EMDEs (blue bars).
the United States held $870 billion of reserves at the Federal
The CBS also reveal a significant increase in the market value
Reserve at end-Q1 2020, up from $550 billion at end-2019).
of banks’ derivatives positions at the time of the pandemic
The annual growth rate of cross-border claims on EMDEs escalation. This is likely to have reflected the bout of market
continued to decline from already low levels: it fell to 1.8% as volatility observed in the first quarter of 2020, which widened
of end-March 2020, compared to 3.7% at mid-2019 (figure 2, the gap between market and contract prices and pushed
left-hand panel). derivatives contracts “into the money” for either the reporting
banks or their counterparties.
Metadata:
• BIS international banking statistics cover the balance sheets of internationally active banks. The locational statistics pro-
vide information about the geographical and currency composition of banks’ assets and liabilities, including intragroup
business. The consolidated statistics measure banks’ country risk exposures on a worldwide consolidated basis. Both
data sets are collected under the auspices of the Committee on the Global Financial System and reported to the BIS at
a country, rather than individual bank, level.
Source:
• BIS international banking statistics at end-March 2020, BIS Statistical release, 22 July 2020.
13ECONOMIC
Increase of the Pandemic Emergency Purchase
Programme
In crisis times there is even more a need for high-quality data to be available on a timely basis. The European
Central Bank (ECB) and the national central banks (NCBs) offer assistance to reporting agents to ensure that
data remains fit for purpose. The European Central Bank has introduced a Pandemic Emergency Purchase
Programme (PEPP) to support the euro area banking sector, firms and households through the COVID-19
crisis.
Table 1. Purchases under the PEPP (Euro millions) Table 2. Breakdown of cumulative net purchases
under the PEPP
2020 Monthly net purchases Mar-May 2020 Euro millions
Asset Backed Securities 0
March 15,444
Covered Bonds 3,128
April 103,366 Corporate Bonds 17,620
May 115,855 Commercial Paper 34,845
Public Sector Securities 384,464
June 85,423
Total 440,057
Note: On 4 June 2020 the Governing Council decided Note: Breakdown of holdings as at end-July 2020 under
to increase the €750 billion envelope for the Pandemic the PEPP (Figures may not add up due to rounding.
Emergency Purchase Programme to €1,350 billion. Figures are preliminary and may be subject to revision)
Despite the current coronavirus pandemic, the ECB is exceptional circumstances surrounding the performance of
determined to continue collecting data on a timely basis and of day-to-day operations underlying the statistical reporting.
a quality that is fit for purpose. This will allow the ECB to have The ECB has therefore invited the national central banks
the necessary statistical information at its disposal to adjust all and reporting agents to find pragmatic solutions within the
of its measures, should this be needed, to safeguard liquidity existing legal framework to keep data reporting within limits
conditions in the banking system and to ensure the smooth that are manageable for reporting agents, while maintaining
transmission of its monetary policy. the quality of the statistical information at a sufficiently high
This statistical information contributes to the maintenance of level.
price stability and the smooth conduct of policies pursued In case of difficulties, reporting agents are asked to contact
by the competent authorities responsible for the supervision their national central banks and the ECB for assistance. The
and resolution of financial institutions, for markets and ECB and the national central banks cooperate closely with
infrastructures, and for the stability of the financial system. other European institutions and bodies. Together with the
Many reporting agents have adopted remote working reporting agents, the ECB will rise to these unprecedented
arrangements. Meanwhile, the continuity and quality of challenges, thus ensuring that the data and statistics required
statistical information reporting may be challenged by the to support the necessary policy measures are fit for purpose.
14ECONOMIC
Link to statistics and metadata:
• Statistical Data Warehouse website
• Statistics webpage on ECB website
• Euro area statistics website
• ECB and SSM websites
Sources:
• ECB communication to reporting agents on the collection of statistical information in the context of COVID-19, ECB, 15
April 2020.
• Supervisory reporting measures in the context of the coronavirus (COVID-19) pandemic, ECB, 15 April 2020.
• Pandemic emergency purchase programme (PEPP)
• Our response to the coronavirus emergency, Christine Lagarde, President of the ECB, the ECB Blog, 19 March 2020.
15ECONOMIC
Aviation standstill with slow and shallow recovery
The global aviation came to a halt in the course of wide-scale lockdown and travel restrictions across all
regions. Air travel demand was crippled with stagnant recovery anticipating a long shadow of the crisis.
Figure 1. Air traffic demand decline by region
Source: ICAO ADS-B operational data.
Figure 2. Passenger revenue loss by region
Source: ICAO Economic Impact Analysis of COVID-19 on Civil Aviation.
Since the start of the COVID-19 outbreak, both capacity 264 million, respectively. Air cargo demand also reached its
offered and travel demand plunged. The situation got historical low level, declining by -28%. Demand for medical
worsened alongside the widespread of the virus. Following the supplies as well as essential goods has withheld air freight
global pandemic declarations, air travel was decimated amidst traffic from collapsing.
the prolonged large-scale lockdown and travel restrictions Revenue streams of the industry evaporated. According to
enforced in most part of the world. ICAO’s estimates, airlines have lost approximately USD 160
Economic impact analysis of the International Civil Aviation billion in passenger revenue for the first six months of the year,
Organization (ICAO) reveals that in the month of April 2020 and airports and air navigation service providers are expected
when almost all countries implemented full or partial lockdown, to lose around USD 52 billion and USD 6 billion, respectively.
air traffic fell drastically to nearly zero with unprecedented As the industry continues to find its way in the wake of the
contractions of over 90%. pandemic, gradual resurgence in air traffic was observed since
For the first half of 2020, number of passengers dropped by May 2020, driven mostly by domestic market, particularly in
56% compared to 2019, from 2.2 billion to 1 billion. Asia/ China where domestic traffic was recovered to 76% of the
Pacific recorded the biggest fall in passenger numbers by 466 June 2019 level. International traffic, however, remained
million, followed by Europe and North America, by 342 and sluggish with marginal improvements, indicating a slow return
to normalcy.
16ECONOMIC
Figure 3. Monthly passenger traffic compared to 2019
Source: ICAO ADS-B operational data.
Figure 4. Evolution of domestic passenger traffic of China
Source: ICAO ADS-B operational data.
Link to metadata:
• ICAO COVID-19 Air Traffic Dashboard: https://www.icao.int/sustainability/Pages/COVID-19-Air-Traffic-Dashboard.aspx
• ICAO Economic Impact Analysis of COVID-19 on Civil Aviation: https://www.icao.int/sustainability/Pages/Economic-Im-
pacts-of-COVID-19.aspx
Sources:
• ICAO Air Transport Statistics, ADS-B FlightAware
• ICAO Economic Impact Analysis of COVID-19 on Civil Aviation
17ECONOMIC
Working hours drop during the pandemic much
larger than initially estimated, with a
disproportionate impact on women workers
Rising unemployment, working time reduction, temporary layoffs and job-search discouragement lead to an
estimated drop in aggregate working hours of 14 per cent in the second quarter of 2020 relative to the last
quarter of 2019. Women workers are especially bearing the brunt of the crisis, with female employment at
greater risk of disruption and an increased burden of unpaid work on women.
Figure 1. Estimated drop in aggregate working hours
(Estimated percentage drop in aggregate working hours compared to the per-crisis baseline,
4th quarter 2019, seasonally adjusted)
The closure of workplaces and implementation of other in working hours during the first quarter of the year. However,
containment measures, combined with the rapid deterioration as the pandemic began to spread globally, significant losses in
of economic conditions, led to immediate and massive losses working hours were observed in other regions as well.
in working hours over the first half of 2020. The ILO has The ILO also substantially revised upwards its estimate of
consistently updated the estimates of working hours losses global working-hour loss in the second quarter of 2020
it presents on its Monitor. The latest ILO estimates integrate compared with previous estimates. The latest estimates reveal
new data available and point to a considerably larger decline a decline in global working hours of 14 per cent in the second
in global working hours in the first half of 2020 than initially quarter of 2020 (up from the previous estimate of 10.7 per
estimated, reflecting the worsening situation in many parts cent), equivalent to 400 million full-time jobs. Lower-middle-
of the world. The new estimates suggest that workers in income countries are the hardest hit, experiencing a decline
developing countries, especially those in informal employment, of 16.1 per cent. The Americas is estimated to have suffered
have been affected to a greater extent than in past crises. a reduction in working hours of 18.3 per cent, or 70 million
During the first quarter of 2020, an estimated 5.4 per cent of FTE jobs, in the second quarter of 2020, compared with
global working hours were lost relative to the fourth quarter the previous estimate of 13.1 per cent. This is the highest
of 2019 (up from 4.8 per cent in the previous ILO estimate), working-hour loss among the major geographical regions and
equivalent to 155 million full-time jobs. Asia and the Pacific the largest upward revision since the previous edition of the
accounted for approximately 80 per cent of the global reduction ILO Monitor.
18ECONOMIC
Disproportionate impact of the COVID-19 more than 70 per cent of those employed in health and social
crisis on women and threat to the goal of work; in some developed regions, they account for almost
achieving gender equality 80 per cent of the health workforce. However, women in this
sector tend to be engaged in lower-skilled and lower-paid
Latest data reveal alarming trends that threaten to exacerbate jobs, which are associated with wider gender pay gaps (26
existing gender disparities and undo the modest gains per cent in high-income countries and 29 per cent in upper-
achieved in recent years in terms of gender equality in the middle-income countries). Health workers, in particular those
labour market. Despite some progress over previous decades, dealing with COVID-19 patients, are often subject to arduous
gender gaps were still considerable and persistent in labour (and sometimes dangerous) working conditions. Long working
markets around the world before the onset of the crisis: the hours in intensive care units, a lack of personal protective
gender gap in labour force participation was estimated at 27 equipment and other resources, understaffing and intense
percentage points in 2019, and among wage workers gender emotional stress expose health workers to higher risks of
pay gaps persist at around 20 per cent globally. infection and transmission, especially in low- and middle-
What is more, the crisis is disproportionately affecting women income countries.
workers in four main ways. First, a large proportion of women Fourth, during the crisis, the unequal distribution of increased
work in sectors severely affected by the crisis. Globally, care demands affects women disproportionately. In normal
almost 510 million, or 40 per cent of all employed women, times, women provide around three quarters of all unpaid care
work in hard-hit sectors, including accommodation and food work. The amount of time dedicated by women to unpaid
services; wholesale and retail trade; real estate, business and care work increases with the presence of children in the
administrative activities; and manufacturing (compared to 36.6 household. The closures of early childhood education centres,
per cent of employed men). care services and schools, along with the unavailability of older
Second, women in domestic work have been highly vulnerable relatives to provide support, have exacerbated care demands
to containment measures. According to ILO estimates, as at 4 during the crisis. The situation for single parents, 78.4 per cent
June, 55 million or 72.3 per cent of domestic workers around of whom around the world are women, can be even more
the world were at significant risk of losing their jobs and difficult, especially if they have to juggle continuing to work
incomes as a result of the lockdown and the lack of effective (on-site or remotely) and caring for children on their own.
social security coverage. The vast majority—around 37 million These disproportionate impacts on women could undo some
—of these at-risk domestic workers are women. of the gains in gender equality in the labour market and
Third, the overwhelming majority of workers in the health and exacerbate disparities.
social work sector are women. Globally, women represent
Source:
• The information presented here is an excerpt of the ILO Monitor: COVID-19 and the world of work, Fifth edition. Refer
directly to the Monitor for more details, including on data sources. For information on COVID-19 and labour statistics, see
ILOSTAT.
19ECONOMIC
Small, medium and vulnerable
The sectors most directly affected by lockdown measures implemented by governments to curb the coronavirus
outbreak account for 40% of jobs in OECD countries. Small and medium enterprises, which are particularly
vulnerable to a prolonged lockdown, account for around three in four of these jobs.
Figure 1. Share of total employment in the sectors most directly affected by lockdown measures –
Breakdown by economic sector (percentage)
Note: Economic sectors are defined using the ISIC rev.4 classification: manufacturing of motor vehicles and other
transport equipment (29-30); construction (41-43); wholesale/retail trade and repair of motor vehicles (45-47); air
transport (51); accommodation and food service activities (55-56); real estate activities (68); professional, scientific
and technical activities (69-75); arts, entertainment and recreation (90-93); and other service activities (94-96). The
latter two are grouped together as other personal services in the figure.
An increasing number of countries are imposing containment continue to trade, whilst many others, such as restaurants and
measures in order to curb the spread of COVID-19 infections. cinemas, experience a complete halt in activity.
Most of the firms in the most affected sectors are Small and In most of the sectors, containment measures have led to a
Medium Enterprises (SMEs) which are particularly vulnerable complete or partial shutdown and, so, the 40% figure provides
to a prolonged lockdown. some sense of scale around the potential number of jobs that
Employment in the most directly affected sectors alone could be lost from a prolonged slowdown or the level of policy
account for 40% of total employment on average across OECD support that governments will need to provide (and in many
countries (figure 1). The impact of a shutdown on employment cases are) to support firms to retain staff.
will of course vary by sector as some, for example, food retail,
20ECONOMIC
Figure 2. Share of total employment in the sectors most directly affected by lockdown measures –
breakdown by firm size (percentage)
Especially at risk from a prolonged slow down are SMEs, Most sectors beyond those mentioned here are also likely to
with many anecdotal sources pointing to significant cash flow be adversely affected, directly through closure and temporary
problems and around one in three at risk of failure without shutdowns, or indirectly through supply-chain difficulties, staff
support. shortages, or impacts on productivity.
Figure 2 shows that SMEs account for the bulk of employment Moreover, it is likely that demand in the economy will be more
in the most affected sectors: 75% on average across OECD widely affected. For example, investments may be postponed
countries and nearly 90% in Greece and Italy. Microenterprises or cancelled, which will create both immediate and longer-
with less than 10 employees, probably the most at risk of cash term impacts on GDP levels and growth.
shortages, account for around 30% of employment in these
sectors, and up to 60% in Greece and Italy.
Additional information:
• Overview of policy measures already taken by governments to support SMEs
• Statistical Insights: Small, Medium and Vulnerable
Sources:
• OECD Annual National Accounts and OECD Structural Business Statistics
21ECONOMIC
Many more children likely in monetary poor
households
Combining the latest available GDP projections (as of June 2020) and historical trends in changes in income
distribution (in particular during years of crises), there could be between 90 and 117 million additional children
in monetary poor households in developing countries.
Figure 1. Number of children in monetary poor households (Estimates based on national poverty lines)
Source: Save the Children and UNICEF estimates.
Children suffer poverty differently from adults. What they needs and at higher risk to be in monetary poor households.
require to survive and thrive is different. Their dreams and Save the Children and UNICEF further estimated the impact of
hopes are different. Moreover, their needs ought to be COVD-19 on the scale of child poverty by analyzing economic
supported and taken care of by adults, not by themselves. projections by the IMF and World Bank, historical evidence
Thus, when measuring child poverty, it is important to use a on past income distribution changes from UNU WIDER, and
direct measurement that assesses their access and utilization demographic data from international household surveys for
of various goods and services such as education, health, over 100 low- and middle-income countries.
housing, and nutrition.
Unless urgent action is taken to protect families from the
However, sometimes this information is not readily available. financial hardships caused by the pandemic, there could be
In addition, children do have a right to a minimum standard between 676 and 703 million children in these circumstances
of living which could be measured indirectly by the level of in low- and middle-income countries by the end of 2020. More
consumption/income of the household. than half of these children live in sub-Saharan Africa and South
About a third of the children in developing countries were Asia (table 1).
living in monetary poor households before COVID-19. As The headcount rates are highest in Sub-Saharan Africa
families lose their sources of income and home environments and Latin America. The highest percentage increases in the
are turned upside down due to the socioeconomic impacts numbers of children are likely to occur in Central and East Asia
of COVID-19, children are likely to be deprived of their basic (figure 2).
22ECONOMIC
Table 1. Projections of number of children in monetary poor households in low- and middle-income
countries by end of 2020
Number of children
(in million)
Lower Upper
Region Baseline bound bound
East Asia & Pacific 43 63 67
Europe & Central Asia 14 17 20
Latin America & Caribbean 72 87 90
Middle East & North Africa 41 49 49
South Asia 168 193 202
Sub-Saharan Africa 250 266 275
WORLD 586 676 703
Source: Save the Children and UNICEF estimates.
Figure 2. Children living in monetary poor households: Baseline and projections to end of 2020
Source: Save the Children and UNICEF estimates.
Note:
Information on the most optimistic (pessimistic) of the GDP projections for each country was combined with likely changes in
income distribution of varying strength (based on historical trends) to establish a range of possible paths for the percentage
and number of children in monetary poor households. The headcount based on national poverty lines are used as well as the
distribution of children by wealth quintiles.
Sources:
• Save the Children and UNICEF estimates based on data from: IMF, World Economic Outlook Update, June 2020; World
Bank, Global Economic Prospects, June 2020; World Bank, World Development Indicators, https://data.worldbank.org/
indicator/SI.POV.NAHC; United Nations Department of Economic and Social Affairs, Population Division, World Pop-
ulation Prospects: 2019 Revision; UN WIDER, World Income Inequality Database, April 2020 update; MICS and DHS
databases.
23ECONOMIC
Dramatic drop in foreign direct investment (FDI) in
2020 and 2021
COVID-19 has had immediate effects on FDI and will have potentially lasting consequences.
Figure 1. FDI inflows, 2015-2019 and 2020-2022 (Trillions of dollars)
Source: UNCTAD.
The COVID-19 pandemic will have an immediate and negative The outlook beyond 2021 remains highly uncertain. Even
impact in 2020 and will result in a further deterioration in before the COVID-19 outbreak, UNCTAD’s model forecasted
2021. UNCTAD forecasts that global FDI flows will fall by as a stagnant trend (-3 per cent in 2020 and +1 per cent in
much as 40 percent in 2020, compared with their 2019 value 2021) as a result of political and trade tensions and an overall
of $1.5 trillion. A fall of this magnitude would bring FDI below uncertain macroeconomic outlook. A U-shaped recovery,
$1 trillion ($900 billion) for the first time since 2005. FDI is that would bring FDI flows back to their pre-crisis trend line,
forecasted to decrease by a further 5 to 10 percent in 2021. is possible, but only at the upper bound of expectations.
Economic and geopolitical uncertainty look set to dominate
The forecasted fall will be more severe than the one
the investment landscape in the medium term. At the lower
experienced in the two years following the global financial
bound of the forecast, further stagnation in 2022 will leave the
crisis, which at its lowest level fell to $1.2 trillion in 2009.
value of global FDI well below 2019 levels.
This latest downturn, triggered by the pandemic, follows
FDI projects in the first months of 2020 are showing sharp
several years of negative or stagnant growth and compounds
declines. The numbers of announced greenfield projects in
a longer-term declining trend. The expected level of global
March decreased by more than 50 percent compared with the
FDI flows in 2021 would represent a 60 percent decline
2019 monthly average (figure 2). Greenfield FDI is forecast to
compared with 2015 levels—a fall from $2 trillion to less than
fall by more than 30 percent for the year as a whole compared
$900 billion.
with 2019.
24ECONOMIC
Table 1. FDI inflows and forecasts, by group of Figure 2. Announced Greenfield projects monthly
economies and region, 2017-2020 and average number, 2019 and early 2020
2017 2018 2019 2020
Group of economies/ USD USD USD USD
region Billions Billions Billions Billions
World 1,700 1,495 1,540 920 to 1,080
Developed economies 950 761 800 480 to 600
Europe 570 364 429 240 to 300
North America 304 297 297 190 to 240
Developing economies 701 699 685 380 to 480
Africa 42 51 45 25 to 35
Asia 502 499 474 260 to 330
Latin America and the
Caribbean 156 149 164 70 to 100
Transition economies 50 35 55 30 to 40
% % % %
change change change change
World -14 -12 3 -40 to -30 All regions and economic groupings will see negative
FDI growth rates in 2020 (table I). Developed economies
Developed economies -15 -20 5 -40 to -25
as a group are forecast to experience a decline of between
Europe -16 -36 18 -45 to -30 -25 and -40 percent. FDI in Europe will fall most (-30 to -45
North America -40 -2 0 -30 to -20 per cent relative to 2019), as the severity of the virus adds to
Developing economies 7 0 -2 -45 to -30 economic fragility in several large economies.
Africa -10 22 -10 -40 to -25 Developing economies as a group are expected to see a
Asia 7 -1 -5 -45 to -30
larger decrease in the range of 30 per cent to 45. Unlike the
situation after the global financial crisis, developing
Latin America and the
Caribbean
economies appear more vulnerable to this crisis. Their
14 -5 10 -55 to -40
productive and investment footprints are less diversified
Transition economies -25 -31 59 -45 to -30
and thus more exposed to systemic risks.
Dependence on commodities for Latin America and the Caribbean and Africa and on GVC-intensive industries for Asia push
these regions to the frontline of the crisis from an FDI perspective. Longer term, developing economies may be further penalized
by the trend towards re-shoring or regionalization of international production, which could accelerate in response to the
COVID-19 crisis.
Sources:
• UNCTAD World Investment Report 2020. Available at: https://unctad.org/en/PublicationsLibrary/wir2020_en.pdf
• UNCTAD FDI/MNE database www.unctad.org/fdistatistics
25ECONOMIC
Slow recovery after production slump in April 2020
Global manufacturing growth, which already exhibited a decelerating trend in 2019, declined further due to the
economic disruptions triggered by COVID-19. The latest production data for China already reached the same
production level as before the pandemic, while other countries seem to recover at a slower pace.
Figure 1. Index of world manufacturing output for Figure 2. Growth of manufacturing output of specific
specific regions (base 2015) regions, in percentage, compared to the same
period of the previous year
Source: UNIDO Statistics.
Note: The preliminary data are based on observed index numbers of industrial production (base year 2015) collected
by UNIDO’s Statistics Division. The data coverage is limited to those country groups that are severely affected by
COVID-19 containment measures and that have a high level of data availability.
Total world manufacturing production strongly declined over economic downturn will continue in the majority of countries or
the last months, whereas a slow recovery is already visible. whether the economy can be revived.
In January 2020, China’s manufacturing output dropped The majority of the observed countries, both industrialized
sharply primarily due to COVID-19 containment measures put and developing or emerging countries, registered a significant
in place (figure 1), although its economy recovered fast and decrease in production (figures 3 and 4). However, developing
already reached the production level of January in June 2020. and emerging industrial economies witnessed more intense
production decreases than industrialized countries. Only a few
The economic impact of COVID-19 in Latin America and in
countries, such as the Republic of Korea, maintained a stable
industrialized countries (grouped into North America, Europe
production level.
and East Asia) is visible from March 2020 onwards with its
trough mostly in April 2020 (figure 2). Many countries began Aggregate data for industrial groups reveal lower losses in
reopening their economies in May 2020, albeit not at full June for electronics, machinery and electrical equipment,
capacity. Global data already signal a recovery from May 2020 whereas in previous months the less affected groups were on
onwards, whereas the coming months will show whether the basic consumer needs, e.g. food and beverages (figure 5).
26ECONOMIC
Figure 3. Growth of manufacturing output for Figure 4. Growth of manufacturing output for
industrialised countries in percentage, compared to developing and emerging countries in percentage,
the same period of the previous year compared to the same period of the previous year
Figure 5. Estimated growth by industry in percentage, compared
to the same period of the previous year, June 2020
Source: UNIDO Statistics.
The preliminary seasonally adjusted data are based on observed index numbers of industrial production (base year 2015)
collected by UNIDO’s Statistics Division. The data coverage is limited to countries severely affected by COVID-19 containment
measures and with a high level of data availability. Regional and world aggregates are calculated with weights referring to the
base year 2015. Further information on the methodology of index calculation and seasonal adjustment can be found here.
The most recent monthly data are available and regularly updated on the UNIDO Statistics data portal.
27ECONOMIC
Disruption of the international postal supply chain
due to COVID-19
• During the peak of the crisis, over one in two international mail items was “stranded”.
• Since then, the logistics supply chain has started recovering.
• International mail volumes remain depressed, down by 20% due to the crisis.
Figure 1. Cumulative number of announcements to Figure 2. Ratio of international outbound messages
the UPU Emergency Information System to international inbound messages
Source: UPU Emergency Information System (EmIS) Source: UPU big-data platform, EMSEVT3 messages.
messages. Note: Weekly ratio between announced dispatch and
Note: Daily cumulative sum of announcements at the reception of mail. Electronic Data interchange (EDI)
global level. messages at the office of exchange level.
Postal operators around the world have been facing hurdles items received by the importing country, one can measure the
in providing their traditional services due to the COVID-19 level of disruption in the international supply chain. In normal
outbreak. In particular, the sanitary measures taken by times, the ratio is slightly above one, as in a given week almost
governments have both restricted the access to labour (e.g. every exported item is received by the importing country.
social distancing) and transportation services (e.g., closure Since February 2020, the ratio has climbed and, during the
of airports). At the same time, in countries experiencing week of 27 April, reached its historic maximum. At the peak
economic shutdowns, postal services have been deemed vital of the crisis, for every 2.3 weekly item exported, only one
and continue to function in contrast to many other businesses. was notified as received. Since then, the ratio has decreased
and eventually stabilized close to pre-crisis levels during the
As the United Nations agency in charge of coordinating
second week of June.
cross-border postal activity, the Universal Postal Union (UPU)
monitors international mail in real time through its big data Problems related to the availability of labour (111 EmIS
platform. Through its Emergency Information System (EmIS), announcements) have also lengthened the clearance of items
it also collects essential information on the capacity of postal through customs, with bar-coded parcels showing an increase
operators to supply services. As of 16 July 2020, 137 countries from an average of 2 hours to over 64 hours during the peak
have submitted EmIS messages to announce disruptions in of the crisis.
their operations. The international transport capacity has been Overall, even if the international logistics postal chain has
the most impacted area, with over 316 EmIS messages sent proved resilient to the crisis, the volume of international mail
to the UPU since the beginning of the crisis (figure 1). has decreased. Estimates gathered from high-frequency
The disruption of air-routes has impacted the delivery of data indicate that the drop of international mail due to the
many postal items. Figure 2 displays the “stranded mail emergence of the pandemic is 20 per cent (figure 3). This is
ratio”, based on information from bar-coded mail items. By just one of the symptoms of the extent to which COVID-19 has
calculating the ratio between items ready to be exported and impacted international economic flows.
28ECONOMIC
Table 1. Postal disruption due to COVID-19 Figure 3. Year-on-year weekly growth rates, all mail
classes
Number of EmIS announcements of a
disruption in the supply of postal services 217
Number of EmIS announcements of a
disruption of international mail flows 316
Maximum stranded mail ratio (outbound 2.3 (+134%
messages/inbound messages) reached compared to
during the crisis (April 2020) April 2019)
Drop in international postal volumes due
to the crisis (items, all mail classes) 20%
Average increase in customs clearance
time (inbound parcels) during the peak of from 2 to 64
the crisis hours
Source: UPU big-data platform.
Note: The dotted line reflects the trend.
Sources: UPU big-data platform. UPU EmIS The dashed vertical line indicates the closure of Wuhan
messages. UPU Quality Control System (QSC). international airport.
Notes: Drop in volumes obtained by comparing the The red curve depicts year-on-year growth rates.
period going from the 1 January to 13 July 2020 to the The spikes in 2019 coincide with a seasonal Holiday.
period 1 January to 13 July 2019.
Sources and links:
• UPU (2019), “The COVID-19 crisis and the postal sector”. https://www.upu.int/UPU/media/upu/publications/theCovid-
19CrisisAndThePostalSectorEn.pdf
• UPU Emergency Information System (EmIS).
• UPU Quality Control System (QCS).
• UPU official statistics are freely available in the following platform: https://www.upu.int/en/Universal-Postal-Union/Activi-
ties/Research-Publications/Postal-Statistics
• UPU postal big data is a collection of Electronic Data Interchange (EDI) messages sent between postal operators, cus-
toms and airlines. The EDI messages are the result of the implementation of UPU standards. Several guides on stan-
dards are available in the UPU website https://www.upu.int/en/Postal-Solutions/Programmes-Services/Standards
• A description on how to transform EDIs into bilateral postal flows and supply chain indicators is available in the following
two papers:
• Anson, J, Boffa, M, Helble and M. (2019). Consumer arbitrage in cross-border e-commerce. Rev Int Econ. 2019; 27:
1234– 1251. https://doi.org/10.1111/roie.12424
• Ansón, J, Arvis, J‐F, Boffa, M, Helble, M, Shepherd, B. Time, uncertainty and trade flows. World Econ. 2020; 00: 1– 18.
https://doi.org/10.1111/twec.12942
29ECONOMIC
COVID-19 pushing 71 to 100 million people into
extreme poverty
COVID-19 is taking its toll on the world, causing deaths, illnesses and economic despair. This contribution
suggests that COVID-19 is pushing about 71 to 100 million people into extreme poverty, and that South Asia
and Sub-Saharan Africa might be the regions hardest hit.
Figure 1. The impact of COVID-19 on global poverty
Nowcasting global poverty is not an easy task. It requires increase in global poverty since 1998, when the Asian financial
assumptions about how to forecast growth, how such growth crisis hit. With the new forecasts, global poverty—the share of
will impact the poor and many other assumptions. Estimating the world’s population living on less than US $1.90 per day—is
how much global poverty will increase because of COVID-19 projected to increase from 8.2 per cent in 2019 to 8.8 per cent
is challenging and comes with much uncertainty. in 2020, or from 632 million people to 684 million people. The
projected decline over the same time period using the previous
This note is based on the latest household survey data for
Global Economic Prospects forecasts was from 8.0 per cent
166 countries in PovcalNet, an online tool for estimating
to 7.7 per cent. The slight change in the base number from 8.2
global poverty, with extrapolations using growth projections
to 8.0 per cent for 2019 happens because the revised growth
from the June 2020 edition of the World Bank’s Global
forecasts also changed for non-COVID reasons in some
Economic Prospects. Comparing these forecasts impacted by
countries. Taking this into account, the pandemic is driving
COVID-19 with the forecasts from the previous edition of the
a change in the 2020 estimate of the global poverty rate of
Global Economic Prospects published in January allows for an
0.9 percentage points. In absolute terms, it is estimated that
assessment of the impact of the pandemic on global poverty.
COVID-19 will push 71 million people into extreme poverty in
Whereas other factors may have worsened or improved
2020. In a downside scenario, which assumes that outbreaks
countries’ growth outlooks between January and June, most
persist longer than expected forcing lockdown measures to be
of the changes in the forecasts are due to the pandemic.
maintained or reintroduced, 100 million people will be pushed
The forecasts reveal that COVID-19 is likely to cause the first into poverty.
30ECONOMIC
Figure 2. The regional distribution of the COVID-19-induced poor
Sources:
• http://iresearch.worldbank.org/PovcalNet/home.aspx
• https://www.worldbank.org/en/publication/global-economic-prospects
• https://blogs.worldbank.org/opendata/updated-estimates-impact-covid-19-global-poverty
• http://documents1.worldbank.org/curated/en/765601591733806023/pdf/How-Much-Does-Reducing-Inequality-Mat-
ter-for-Global-Poverty.pdf
31You can also read