Fertilizer Application Patterns and Trends and Their Implications for Water Quality in the Western Lake Erie Basin - February 2018
←
→
Page content transcription
If your browser does not render page correctly, please read the page content below
Fertilizer Application Patterns and Trends
 and Their Implications for Water Quality
      in the Western Lake Erie Basin

                     February 2018

INTERNATIONAL JOINT COMMISSION • COMMISSION MIXTE INTERNATIONALE
          Canada and the United States Canada et États-Unis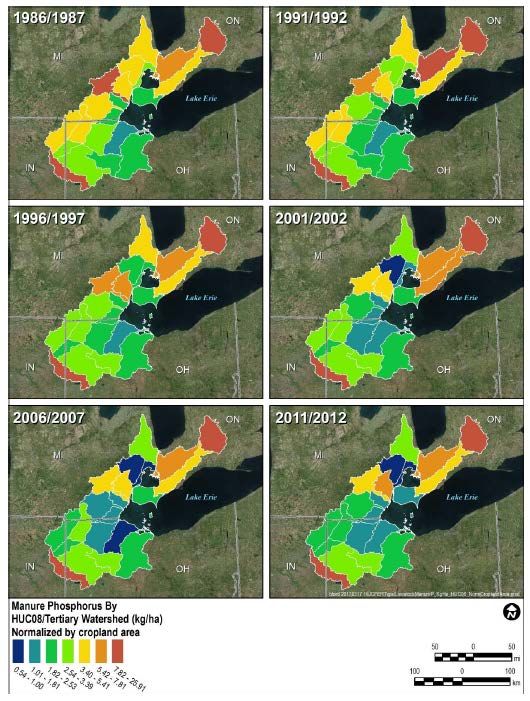
For more information on the International Joint Commission (IJC), please visit the IJC’s
website: www.ijc.org. Information also can be obtained by contacting any of the
following IJC offices:

United States Section Office    Canadian Section Office      Great Lakes Regional Office
2000 L Street NW, Suite 615     234 Laurier Avenue West      100 Ouellette Avenue 8th
Washington, DC 20440            22nd Floor                   Floor
Phone: 202-736-9000             Ottawa, ON K1P 6K6           Windsor, ON N9A 6T3
Fax: 202-632-2006               Phone: 613-995-2984          Phone: 519-257-6733
commission@washington.ijc.org   Fax: 613-993-5583            Fax: 519-257-6740
                                commission@ottawa.ijc.org    OR
                                                             P.O. Box 32869
                                                             Detroit, MI 48232
                                                             Phone: 313-226-2170 x6733
                                                             commission@windsor.ijc.org

Ce rapport est également disponible en français.

This report may be cited as: International Joint Commission (2018). Fertilizer
Application Patterns and Trends and Their Implications for Water Quality in the
Western Lake Erie Basin.

February 2018

Print version
ISBN: E95-2/30-2018E
Cat. No.: 978-0-660-24732-8

PDF version
ISBN: E95-2/30-2018E-PDF
Cat. No.: 978-0-660-24731-1

                  For more information, visit the IJC website (IJC.org)
                            and follow us on social media.

                Subscribe to our newsletter at: http://ijc.org/en_/blog.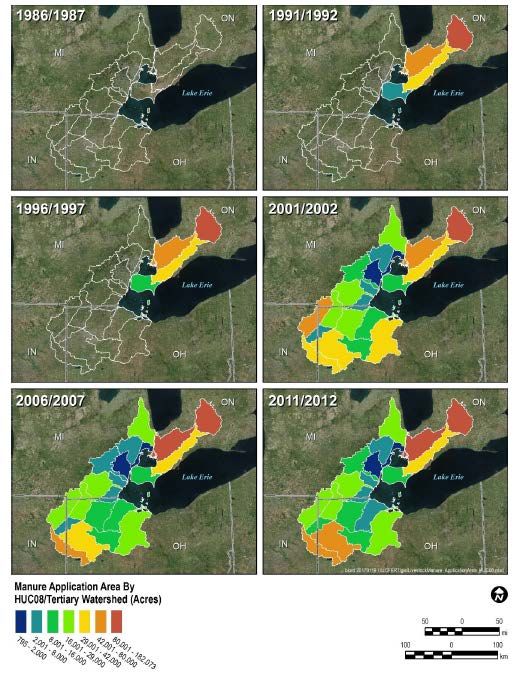
INTERNATIONAL JOINT COMMISSION

                        Gordon Walker
Lana Pollack            Chair
Chair                   Canadian Section
United States Section

Rich Moy                Richard Morgan
Commissioner            Commissioner
United States Section   Canadian Section

                        Benoît Bouchard
                        Commissioner
                        Canadian Section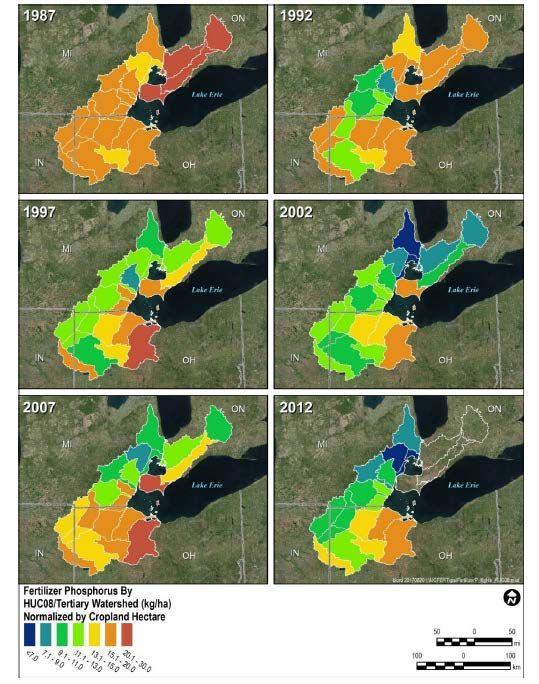
Acknowledgments
The International Joint Commission would like to acknowledge the extensive efforts,
input and guidance provided by the Great Lakes Science Advisory Board’s Science
Priority Committee and its project Work Group.

Primary Authors
J. David Allan, Work Group Co-Chair and University of Michigan
Michael W. Murray, Work Group Co-Chair and National Wildlife Federation
with contributions by Matthew Child, International Joint Commission

Work Group Members and Reviewers
Tom Bruulsema, International Plant Nutrition Institute
Patricia Chambers, Environment and Climate Change Canada
Anne Cook, The Andersons Incorporated
Irina Creed, Western University
Steve Davis, U.S. Department of Agriculture, Natural Resources Conservation Service
Joe DePinto, Independent Consultant
Brad Glasman, Upper Thames River Conservation Authority
Pradeep Goel, Ontario Ministry of Environment and Climate Change
Bob Hecky, University of Minnesota – Duluth
Laura Johnson, Heidelberg University
Pamela Joosse, Agriculture and Agri-Food Canada
Joe Kelpinski, Michigan Department of Agriculture and Rural Development
Kevin King, U.S. Department of Agriculture, Agricultural Research Service
Andrea Kirkwood, University of Ontario Institute of Technology
Rebecca Muenich, Arizona State University
Jeff Ridal, St. Lawrence River Institute of Environmental Sciences
Clare Robinson, Western University
Craig Stow, National Oceanic and Atmospheric Administration
Chris Winslow, Ohio State University
Santina Wortman, U.S. Environmental Protection Agency
Matthew Child, International Joint Commission (Great Lakes Regional Office)
Glenn Benoy, International Joint Commission (Canadian Section)
Mark Gabriel, International Joint Commission (U.S. Section)

Contract Team (LimnoTech)
John Bratton              Brian Lord
Noemi Barabas             Dan Rucinski
Chelsie Boles             Derek Schlea

                                          1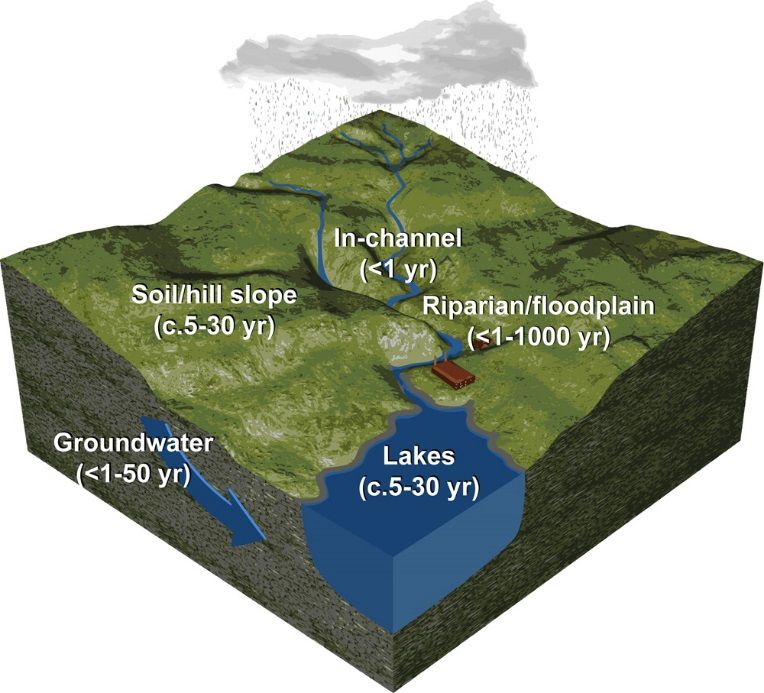
Executive summary
This assessment of fertilizer application and impacts in the western Lake Erie basin
(WLEB) was conducted by members of the International Joint Commission Science
Advisory Board's Science Priority Committee, with the assistance of an advisory group
and a contractor. It considers primarily commercial (or synthetic) fertilizer and manure,
and secondarily other nutrient-containing materials applied to agricultural lands.

Nonpoint agricultural release is recognized to be the largest single source of excess
nutrients to western Lake Erie. Because phosphorus (abbreviated by its chemical
symbol, “P”) is the limiting nutrient for algal growth in most freshwater systems, the
sources, transformations and effects of excess P were the focus of much of the
assessment, although nitrogen (N) is also briefly discussed. Commercial fertilizer sales
data, reported rates of commercial fertilizer application to the land surface, and total
manure generation based on livestock numbers within watershed boundaries were
used to inform the relative importance of these two sources to P loading. Point sources
such as wastewater and industrial outfalls as well as urban and other nonagricultural
nonpoint sources were not examined as part of this analysis; these sources are currently
considered relatively minor (less than 15 to 25 percent combined) at the regional scale in
comparison with nonpoint agricultural P loading to western Lake Erie (WLE). The
study had a geographic scope of the binational WLEB, including the St. Clair - Detroit
River system basin.

In addition to assessing the relative magnitude of P inputs from commercial versus
manure fertilizers, this study drew upon published literature and knowledge of the
advisory group and contractor team to better understand past, current and possible
future influence of nonpoint agricultural runoff on nutrient loads delivered to WLE,
and their potential to cause eutrophic conditions and episodic appearances of nuisance
and harmful algal blooms (HABs). This included a review of land and nutrient
management programs, including the recently adopted 4R nutrient management
program; consideration of the capabilities of existing monitoring programs and
watershed models to distinguish nutrient loads and impacts from different fertilizer
sources and application practices; and assessment of the state of knowledge concerning
the potential contribution of each fertilizer type to eutrophic conditions in Lake Erie.
This effort helped to identify gaps in spatial coverage, temporal resolution and
knowledge related to data, modeling and monitoring; points to continuing and
emerging research needs; and identifies issues where future policy development may be
important to effect necessary change.

                                            2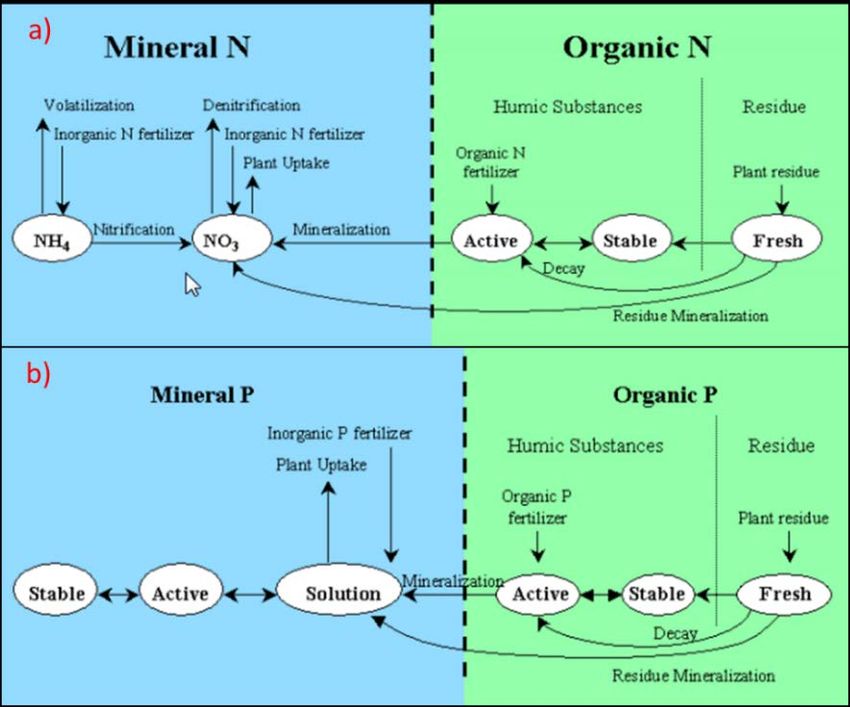
Key findings and recommendations
This study presents numerous findings related to agricultural practices and fertilizer
application (Chapter 2), monitoring (Chapter 3), modeling (Chapter 4), and additional
factors that deserve consideration (Chapter 5). Chapter 6 identifies numerous data and
information gaps and presents the work group’s recommendations. A summary of key
findings and recommendations is included below.

1.      There are no established analytical nor data analysis methods for
distinguishing P loads from commercial fertilizer versus manure at the point of
delivery to the lake from tributaries, nor can a causal connection be drawn between
different sources of P applied to fields and the response of algae in WLE.
Although recent and increasing research using stable isotopes and molecular
fingerprinting holds considerable promise to improve our understanding of the
fertilizer sources of P to the lake, at this time commercial fertilizer sales, manure
generation and application information must be used as a proxy for the relative
influence of each major fertilizer source, although prevailing privacy policies limit
access to farm data and information. In addition, limited research to date finds no
significant differences in P export (either dissolved reactive P [DRP] or total P) from
fields receiving manure versus commercial fertilizer. However, findings of this report,
supported by current literature, leave little doubt that nutrients lost from agricultural
lands are primarily responsible for WLE eutrophic conditions.

Recommendation: Continue emerging research on phosphorus source monitoring,
including stable isotope and organic phosphorus fingerprinting research as part of
source attribution efforts, and site-based monitoring of P loss by species from fields
receiving differing amounts of commercial fertilizer and manure.

2.     Estimated overall manure generation and commercial fertilizer application
values, converted to elemental P, total 41,687 tonnes (72 percent) for the US watershed
and 16,327 tonnes (28 percent) for the Canadian watershed based on the most recent
comparable binational data (2006-07), as summarized in Table ES-1 (data from
LimnoTech, 2017).
As indicated in the following table, commercial fertilizer is the primary source of
phosphorus used for agricultural purposes in the western Lake Erie basin (WLEB)
overall and in the United States, while in Canada manure and commercial fertilizer are
comparable as sources (52 percent manure and 48 percent commercial fertilizer).

                                             3
Table ES-1: Amount of phosphorus in manure generated and commercial
fertilizer applied in the western Lake Erie basin, 2006/2007
Jurisdiction Total P (kg)   Total P   Manure     Manure      Commercial      Commercial
                            (kg) as   Generated  Generated   Fertilizer      Fertilizer
                            %         P (kg)     P as % of   Application P   Application P as
                                                 Total P     (kg)            % of Total P
U.S.         41,687,180          72    7,735,580      19      33,951,601             81
(2007)
Canada       16,326,671          28    8,443,129      52       7,883,542            48
(2006)
Total        58,013,851        100 16,178,709         28     41,835,143             72

Current P application rates from commercial fertilizer are comparable in much of
Canada and the United States and have declined in the watershed overall since the
1980s. The total numbers of animals in areas draining to the WLEB have remained fairly
constant over the past 30 years, but there is a trend toward higher concentrations of
animals per farm. P from generated manure has remained stable with no significant
changes since the 1980s (though one analysis estimates gradually increased generation
in the Maumee River watershed from the early 1990s to 2010), and it is higher in the
upper portions of each domestic watershed. Information on permitted concentrated
animal feeding operations (CAFOs) in the United States is publicly available (although
not easily aggregated) and data regarding animals per farm in Ontario are generally not
available to the public.

The amount of phosphorus entering watersheds due to other agricultural sources –
including greenhouses, other agricultural products and pesticides – is small and not
likely to contribute substantially to loads or impacts in Lake Erie, although they may
have local impacts.

There are fundamental data limitations on estimates of both commercial fertilizer and
manure application, with both temporal and spatial limitations, due primarily to
program structure (e.g. agricultural censuses carried out only every five years) and
prevailing policies that restrict the availability of farm-scale data.

Recommendation: Agencies should obtain (e.g. through surveys, available datasets and
any new data as appropriate) commercial fertilizer sales and application data at both
higher temporal and spatial resolution to allow for improved understanding of this
important source. In addition, agencies should evaluate approaches to making these
data broadly available at the highest spatial resolution possible.

                                                  4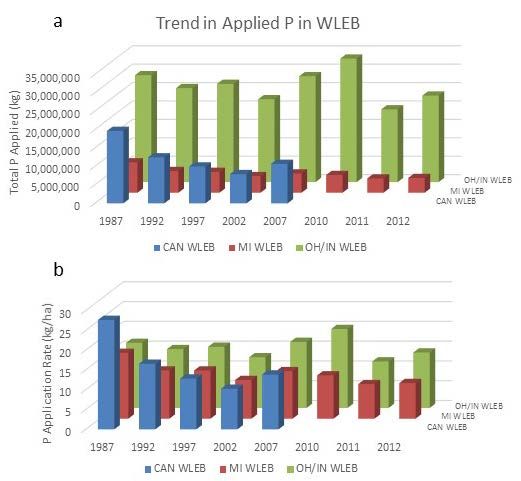
Recommendation: Better quantify all major components of manure generation,
management, field application, and associated P loss and impacts on local and regional
surface water quality and ecosystems.

3.      Stored soil P (legacy P) has the potential to contribute to river P loads for years
or decades, although evidence indicates that some drawdown of legacy P is occurring.
Numerous studies indicate that P fertilizer application exceeded P removal in crop
harvest to the 1980s, likely resulting in accumulation of P stored in watershed soils.
More recently, fertilizer application of phosphorus in the whole watershed is roughly
balanced by P removal in harvested crops, although there is considerable local
variation. Because crop yields have in general increased in recent decades while P
fertilizer application has held steady or declined, this general pattern implies an
ongoing drawdown of soil phosphorus content. However, even a small ‘leakage’ of
excess P may be sufficient to contribute to algal blooms, particularly since the quantities
of P added as fertilizer and removed as crop yield are large relative to P exported from
the fields.

Phosphorus may also have accumulated to saturation in some nonagricultural
compartments (buffer zones, filter strips, wetlands, riparian zones, ditches/drains and
ditch/drain sediments and river channels). Because these systems do not have an outlet
for phosphorus via crop harvest, it is hypothesized that these compartments of the
greater landscape may be shifting from P sinks to slow-release P sources. The role and
behavior of legacy P in systems such as this is an area of active research, and is also
largely outside of current management and policy consideration.

Further reduction in P fertilizer application, increases in P removal via crop harvest and
improvement in P retention on the land (through nutrient management practices such
as the 4Rs, or right source, rate, time, and place) may be called for in order to speed the
drawdown of stored P and lessen P export.

Recommendation: Agencies should collect and regularly update a statistically
representative binational data set of phosphorus concentrations and vertical
stratification in agricultural soils (including more consistent protocols for soil test
phosphorus), whether through an existing program or a new (agency led, or potentially
multi-sector) program.

                                             5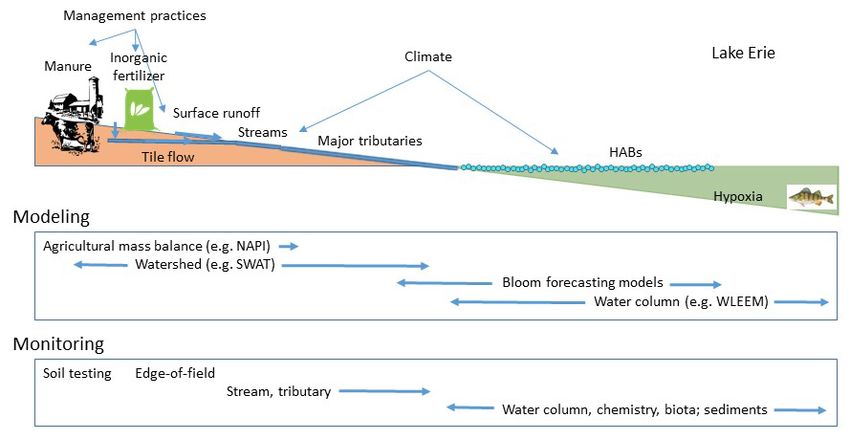
Recommendation: Improve spatial resolution of data on legacy phosphorus (including
reservoirs of legacy P in locations not actively farmed), as well as linkages between P
fluxes from reservoirs and lake phenomena including algal blooms and hypoxia.

4.     No-till cropping systems contribute to increased Dissolved Reactive
Phosphorus (DRP) export from fields.
Sixty-three percent of WLEB cropland has some type of conservation tillage in place
(mulch tillage, seasonal no-tillage, or continuous no-tillage), practices that were widely
adopted in the region by the early 1990s. The expansion of conservation tillage over the
past two decades coincides with the rise of DRP export and thus is considered a
contributory factor. No-till leads to accumulation of P in the uppermost layer of soil
which is then more available for transport, and may allow the formation of soil
macropores that serve as transport pathways for subsurface transport through drain
tiles.

Numerous studies have found that no-till plots have a higher DRP load than other
conservation and conventional tillage plots.

Recommendation: Support research and monitoring to quantify and better understand
the implications of no-till agriculture for P accumulation at the soil surface and P
transport through drain tiles, and to explore potential new approaches to minimizing P
losses associated with no-till practices.

5.     Subsurface artificial tile drains increase conveyance of P through subsurface
pathways.
Data from the mid-2000s indicate that most US counties in the WLEB have over 50
percent of acres tile-drained (including 86 percent of agricultural land in the Maumee
River watershed), and three of the four tertiary watersheds in the Canadian portion of
the WLEB have over 50 percent of hectares tile-drained. Other studies have found that
average tile flow can convey up to 50 percent of annual precipitation. Few data exist to
quantify trends in tile drainage in the WLEB.

Phosphorus transported through tile drains may be an important contributor to algal
blooms. Although dissolved and particulate phosphorus loadings from subsurface tiles
are small as a proportion of P applied, the widespread prevalence of tiling suggests a
substantial cumulative effect.

                                            6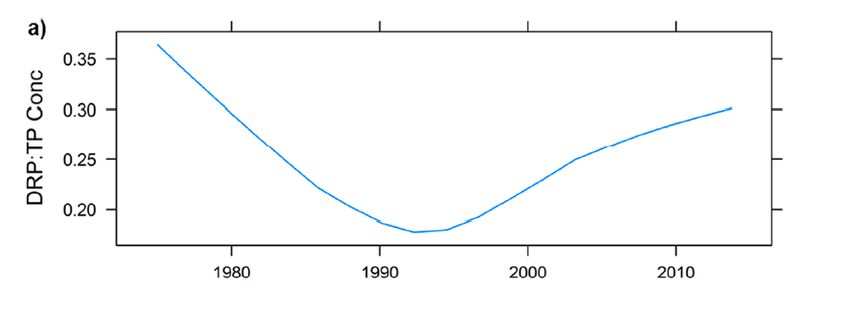
Recommendation: Agencies should obtain more current data on tile drainage networks
and their impact on P form and mass transport, including interactions with tillage
practices, commercial fertilizer and manure application, and the relative role and rates
of tile discharge of P in comparison with surface runoff.

6.     Climate change is expected to influence P export to the lake.
The phosphorus load delivered by rivers to Lake Erie is governed by concentration and
discharge. Because discharge varies much more than concentration, years of high
precipitation and discharge are also years of high P loads. One study found about one-
third of the increased DRP load of the Maumee River since 2002 is attributable to higher
runoff volumes, and researchers have noted that a continuing trend of increasing river
discharge substantially complicates the ability of nutrient management to reach load
reduction targets.

Modeling indicates that the realized benefits of best management practices (BMPs) and
related management strategies under a moderate climate may be substantially offset if
precipitation and runoff increase in the future. Modeling studies have found that wetter
climates will result in longer recovery timeframes, though several recent studies have
also indicated the potential for tempered impacts on P export with future climate.

Climate change can influence HAB development in other ways, including through
generally warmer water temperatures and effects on lake stratification.

Recommendation: Continue to evaluate climate change impacts on P loads from rivers
as a potentially complicating factor influencing how target loads are determined, as
well as implications for management actions needed to meet targets.

7.     The western basin of Lake Erie and its tributaries are among the most
intensively monitored parts of the Great Lakes basin, although shortcomings need to
be addressed.
Offshore lake monitoring and lower watershed monitoring are reasonably robust. There
are many monitoring programs that include parameters relevant to nonpoint nutrient
loading and impacts. Data availability is fair overall, with time lags commonly
exceeding a year or more for data release. Real-time gauges and sensors are becoming
more common in the region, and most major programs do distinguish between total
and dissolved reactive phosphorus, the latter of which is considered more bioavailable.
Important monitoring gaps exist in watersheds and lakes in terms of space, time and
parameter suite.

                                            7
Recommendation: Design and implement an optimized and integrated long-term
monitoring network for water quality and agricultural practices to support decisions
about the best approaches to nutrient load reductions.
Recommendation: Develop stable funding mechanisms and institutional stewards for
sustained, long-term binational monitoring and data management.
8. Models (in particular the Soil and Water Assessment Tool or SWAT) provide
valuable insights into the effectiveness of various land and nutrient management
strategies in reducing P loads, and hold much additional potential as analytical and
predictive tools.
Modeling has provided valuable insights into the relationships between agricultural
practices and riverine P loads, identified locations where P losses likely are greatest,
and shown the potential benefits of various land and nutrient management practices –
including management practices that farmers employ. Results suggest that wide
implementation of a mix of strategies will be needed to reduce P loads to WLE. As a
cautionary note, the extent of existing implementation of most conservation practices is
not always modeled (given limited data on current extent of implementation), which
must be taken into account in considering modeled benefits of additional
implementation.
Recommendation: Develop operational models linked to optimized monitoring
networks, and high-resolution surveys of changing agricultural practices and
watershed characteristics to support forecasting of evolving conditions, and to inform
inter-annual and within-season adaptive management decisions.
Recommendation: Continue financial and policy support for development and
application of research models at various scales to improve process understanding of
phenomena and dynamics (including improving soil phosphorus routines and
addressing other processes noted above), as well as to simulate alternate management
scenarios.
9. Broad implementation of a mix of current best management practices,
increased evaluation and developing new approaches to address emerging
challenges, including the increase in DRP export, are critical to restoring the health of
Lake Erie.
Adoption of appropriate management practices (e.g. the 4R nutrient management
program) may have a bigger influence on P export from agricultural lands than the type
8of fertilizer (i.e. commercial versus manure). Adoption of 4R practices can reduce
available P, and edge-of-field studies also have found positive outcomes from
implementation of 4R practices, although more research on the efficacy of management
practices is needed. Models indicate that realizing significant reduction of riverine
nutrient loads from Lake Erie tributaries will require multiple conservation practices
including nutrient management, reduced fertilizer application and various land
management practices.
The lack of detailed information on farm practices at the field level and over time limits
our ability to fully document and model fertilizer application, evaluate the effectiveness
of changes such as expanding adoption of 4R practices, and to make more realistic
models of how changes in practices affect nutrient runoff. Farmer surveys, especially if
the survey pool is sufficiently large and representative, can help in this regard, as
would more detailed reporting of local practices.
Further expansion and implementation of appropriate management practices ultimately
depends on understanding and, where feasible, addressing the socio-economic, policy
and cultural drivers of agricultural production and BMP adoption. Although an
examination of those issues is beyond the scope of this report, the authors acknowledge
their importance and encourage a deeper examination of those drivers considering the
science findings included here.
Recommendation: Continue to promote 4R guidelines for fertilizer application through
outreach, education and technology to enhance adoption and effectiveness of 4R
practices. Expand efforts to evaluate the effectiveness of 4R and other best management
practices at the field and watershed scales, and identify areas for improvement.
Recommendation: Support research and monitoring (watershed and lake) to improve
process understanding and identify management options best able to reduce export of
all forms of P so that P remains onsite and available for crop uptake.
Perspective
Looking to the future, it is likely that management and policy will need to be developed
to address the challenges identified in this report. This may require new approaches to
offset the presumed influence of no-till crop management and tile drainage on
phosphorus runoff, including changes to tillage and drainage practices, keeping in
mind other environmental goals of these practices (e.g. erosion control). Should future
9climates continue a trend to greater precipitation and runoff, it may be necessary to
adjust target P loads in the future if the climate becomes substantially wetter.
Fortunately, a number of trends, now more than a decade long (based on most recently
available data), are encouraging. P fertilizer inputs are declining while P removal as
crop yield has increased. Declines in soil P in at least some locations suggest that
fertilization at or below crop needs and drawdown of soil P can be achieved without
impacting yields. Models such as SWAT provide insight into the mix of land and
nutrient management practices that are likely to be most effective in bringing riverine P
loads into the range where extreme algal blooms will become rare events. This report
provides a comprehensive assessment of fertilizer practices in western Lake Erie and
through synthesis of the most recent literature, identifies research needs, aspects of land
and nutrient management that demand attention, and suggests where policies may
need to be developed to effect necessary changes.
P control measures enacted in the 1970s demonstrated that Lake Erie eutrophication
could be reversed by strategies focused mainly on point sources, resulting in significant
reductions in total P loadings, in open lake P concentrations and in algal biomass. The
challenge this time is with agricultural nonpoint sources of nutrients, which will require
a different set of responses. Lake Erie has benefitted from bold action in the past and
requires similar bold action today to ensure its health and value to the people of the
basin into the future.
10Table of contents
Acknowledgments ........................................................................................................................................ 1
1. Problem statement ............................................................................................................................ 14
2. Agricultural practices, fertilizer application, and factors affecting nutrient runoff in the western
Lake Erie basin........................................................................................................................................... 16
2.1 Farming practices and trends in the WLEB ................................................................................... 17
2.2 Commercial fertilizer application ................................................................................................... 18
2.3 Manure application ......................................................................................................................... 22
2.4 Other nutrient sources, including greenhouses, herbicides and other products........................ 27
2.5 The role of nutrient management in affecting nutrient runoff following commercial fertilizer
and manure application ........................................................................................................................ 28
2.5.1 Nutrient management and commercial fertilizer application ............................................... 29
2.5.2 Nutrient management and manure application .................................................................... 31
2.6 Summary of commercial fertilizer application and manure generation in the western Lake Erie
basin ....................................................................................................................................................... 34
2.7 Summary and data gaps ................................................................................................................ 35
3. What is the capability of tributary, lake and remote monitoring to assess the contributions of
different fertilizer sources? ....................................................................................................................... 38
3.1 Watershed, lake and remote monitoring programs ...................................................................... 38
3.2 Summary and data gaps ................................................................................................................ 42
4. What is the capability of modeling to guide management decisions related to nutrient
reductions?................................................................................................................................................. 44
4.1 Watershed models .......................................................................................................................... 45
4.1.1 SWAT ......................................................................................................................................... 48
4.1.2 SPARROW ................................................................................................................................. 51
4.2 Western Lake Erie harmful algal bloom forecasting model ......................................................... 52
4.3 Mass balance models .................................................................................................................... 53
4.4 Summary and data gaps ................................................................................................................ 56
5. What additional factors deserve consideration? ............................................................................ 58
5.1 Increasing DRP in river runoff........................................................................................................ 58
5.2 Legacy P .......................................................................................................................................... 59
5.3 Changing farm practices ................................................................................................................ 62
5.3.1 No-till cropping systems........................................................................................................... 62
115.3.2 Tile drains ................................................................................................................................. 62
5.4 Nutrient ratios................................................................................................................................. 65
5.5 Changing climate............................................................................................................................ 65
5.6 Additional factors ........................................................................................................................... 67
5.7 Summary and data gaps ................................................................................................................ 67
6. Conclusions and recommendations ............................................................................................... 68
6.1 Fertilizer application in the WLEB findings ................................................................................... 69
6.1.1 Fertilizer data gaps and research needs ................................................................................ 71
6.1.2 Fertilizer and broader agricultural practice recommendations............................................. 72
6.2 Monitoring findings ........................................................................................................................ 73
6.2.1 Monitoring data gaps and research needs ............................................................................ 74
6.2.2 Monitoring recommendations ................................................................................................. 74
6.3 Modeling findings ........................................................................................................................... 74
6.3.1 Modeling data gaps and research needs ............................................................................... 75
6.3.2 Modeling recommendations ................................................................................................... 75
6.4 Integrated efforts to protect and restore Lake Erie ..................................................................... 75
7. References cited .............................................................................................................................. 76
List of Tables
Table ES1: Amount of phosphorus in manure generated and commercial fertilizer applied in the
western Lake Erie basin, 2006/2007……………………………………………………………………………………………4
Table 2-1: Phosphorus and nitrogen content of several commercial phosphate fertilizers....………...19
Table 2-2: Phosphorus and nitrogen content of several manure types ..………………………………………..23
Table 2-3: Amount of phosphorus in manure generated and commercial fertilizer applied in the
western Lake Erie basin, 2006/2007……………………………......……………………………………………………….35
Table 3-1: Summary of key tributary and open lake monitoring programs for the western Lake Erie
basin..….…………………………………………………………………………………………………………………………………….39
Table 4-1: Comparison of 11 watershed models…………………………………………………………………………..46
List of Figures
Figure 1-1 Study area ..……………………………………………………………………………………………………………….15
Figure 1-2 Schematic diagram showing selected human activities and components of the hydrologic
cycle influencing nutrient loading and lake conditions..………………………………………………………………..16
Figure 2-1 Trends in commercial fertilizer phosphorus applied in the western Lake Erie basin……...20
Figure 2-2 Trends in commercial fertilizer phosphorus application intensity by watershed in the
western Lake Erie basin ….…………………………………………………………………………………………………………21
Figure 2-3 Trends in livestock manure phosphorus generation by watershed in the western Lake Erie
basin………………………………………………………………………………………………….………………………………………26
12Figure 2-4 Trends in manure application area by watershed in the western Lake Erie basin .………. 27
Figure 4-1 Conceptualized nitrogen and phosphorus processes in SWAT..………………………………..….50
Figure 4-2 A mass balance or P budget diagram showing inputs and outputs………………………………53
Figure 4-3 Summary of P balance over time for Ontario, Michigan and Ohio………………………………….55
Figure 5-1 Smoothed, long-term trend for the DRP/TP concentration ratio………………….………………..58
Figure 5-2 Typical time scales for phosphorus retention and recycling in watershed and waterbody
legacy P stores .……………………………………………………………………………………………………….…………………61
131. Problem statement
Eutrophication – or elevated nutrient levels and associated ecological changes – has
plagued Lake Erie and many other water bodies for decades. Following significant
harmful algal blooms (HABs), hypoxia and other impacts in Lake Erie in the 1960s,
multiple policy, regulatory programs and nonregulatory initiatives were put into place
to address these and other problems. The combination of the US Clean Water Act
(including the permitting program for point sources), federal and provincial laws and
programs on the Canadian side, binational US-Canadian efforts through the Great
Lakes Water Quality Agreement (GLWQA), and other nonpoint source reduction
programs led to reductions of some nutrient loads, in particular via wastewater
treatment plants and agricultural sediment runoff. Since the 1990s, however, resurgence
in eutrophic symptoms and especially the increasing presence and severity of Lake Erie
HABs have brought new urgency to the need to understand causes and determine
effective management responses. As nutrient loads continue to be high and agricultural
sources of phosphorus (P) in commercial fertilizer and manure 1 are widely considered
to be an important source of P entering Lake Erie (IJC, 2014), there is an urgent need to
better understand the influence of agricultural fertilizer and appropriate land and
nutrient management strategies to protect the health of western Lake Erie (WLE).
The International Joint Commission (IJC) Science Priority Committee (SPC) was tasked
with exploring this issue in depth for the western Lake Erie basin (WLEB) (Figure 1-1).
The key objective was to assess the magnitude and relative importance of two broad
nutrient sources, commercial fertilizer and manure, and the influence of nutrient
management associated with those major sources on nutrient loads and their impacts to
the WLEB. This project attempted to address the following questions:
• What are the magnitudes of commercial fertilizer use and manure generation
and use in the WLEB? Are data sufficient to understand the relative importance
of these sources to phosphorus delivery to WLE?
• What is the extent of best management practices and programs (e.g. 4R nutrient
stewardship) in the WLEB and what is their effectiveness in managing
phosphorus loss to tributaries from commercial fertilizer and manure?
1
As used in this report, “commercial fertilizer” references all forms of synthetic fertilizer (including inorganic
fertilizers and synthetic organic fertilizers). “Commercial fertilizer” does not encompass animal manure that is
brokered (sold) in the WLEB. “Manure” references animal manure in any form (i.e. liquid or solid) produced by
livestock, and does not include other organic-rich waste material (e.g., biosolids from wastewater treatment
plants, compost, or any other material). “Fertilizer” used alone typically references any form of inorganic or
organic material added to soil to augment nutrients (through primarily commercial fertilizer and manure).
14• What is the extent of existing monitoring programs and are these programs
adequate to ascertain the relative importance of commercial fertilizer and
manure as phosphorus sources to WLE?
• What are the capabilities of existing models (in particular watershed models) to
help ascertain the relative importance of commercial fertilizer and manure as
contributors of phosphorus to Lake Erie and also to assess the effectiveness of
various management practices?
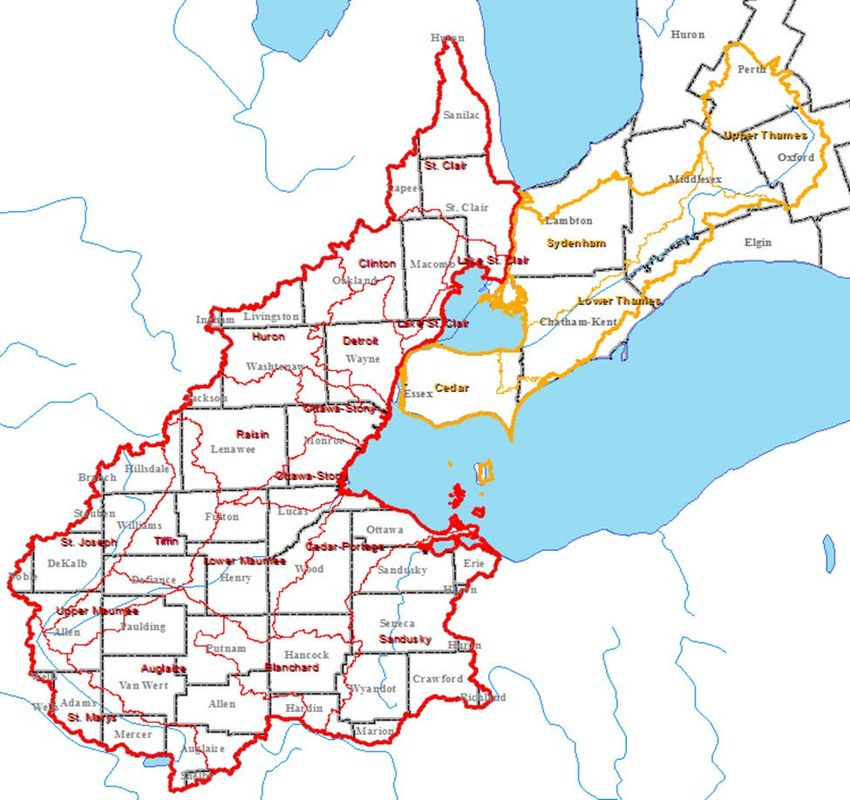
Figure 1-1 Study area. US watershed area (red) = 14,833 sq. miles (38,416 sq. km) or 78 percent
of the total; Canada area (yellow) = 4,286 sq. miles (11,101 sq. km) or 22 percent of the total
watershed area. (LimnoTech, 2017)
A schematic of key processes and analytical approaches to studying the issue in the
WLEB is provided in Figure 1-2. This report summarizes this overall effort, which
included meetings of a work group, development of a contract technical report
(LimnoTech, 2017) with multiple components, including data acquisition, mapping and
summarizing, and assessments of monitoring programs and models, and development
of this synthesis report.
15Figure 1-2 Schematic diagram showing selected human activities and components of the hydrologic
cycle influencing nutrient loading and lake conditions. Other components (e.g., point source inputs,
detailed assessment of groundwater transport of phosphorus, detailed review of in-lake processes)
were beyond the scope of this assessment.
2. Agricultural practices, fertilizer application, and
factors affecting nutrient runoff in the western Lake
Erie basin
The western Lake Erie basin (WLEB) extends over 19,000 square miles (49,000 square
kilometers) across parts of Ohio, Indiana, Michigan and Ontario, with approximately 78
percent of the watershed in portions of the three US states (LimnoTech, 2017). The
United States and Canadian portions of the watershed are heavily agricultural, with
row crops extending over much of both portions, and animal feeding operations in
varying locations but often clustered in the upper portions of each watershed
(LimnoTech, 2017). Row crops are particularly significant in the Maumee River
watershed, amounting to more than three-fourths of the watershed area (Kalcic et al.,
2016). The importance of agricultural practices (in particular commercial fertilizer and
manure application and subsequent runoff) as a major contributor to nutrient loading to
the WLEB has been recognized for a number of years (e.g., Scavia et al., 2014; Smith et
al., 2015a; Watson et al., 2016 (and references therein)).
16Fertilizer applied to agricultural soils is an important but not exclusive determinant of
nutrients carried from the landscape into waterbodies. Fertilizer is applied to fields to
increase crop yields, so that crops can grow in greater abundance than the previous
natural vegetation growing on unamended soil. Crop needs vary by crop, strain,
growing season, weather conditions, water availability, plant health and soil types,
among other factors. Nitrogen, phosphorus and potassium are the three main nutrients
that are supplied in commercial fertilizers.
Fertilizer in excess of annual crop needs and not otherwise retained in the landscape
(e.g., by binding to soil particles or transported to groundwater) can be mobilized in
dissolved or particle-bound forms and exported from farm fields by (surface) runoff or
tile drain discharge. These excess nutrients are a combination of both newly applied
nutrients and nutrients from prior years of fertilizer use and retention. Fertilizers
applied to agricultural lands can be described in terms of the amounts, the timing, the
methods and the types of fertilizer product chosen to optimize crop production over the
short and the long term. Multiple factors can potentially influence the amount of
nutrient loss from fields, including type of crop and rotation patterns, tillage practices,
soil type and texture, slope, artificial drainage, fertilizer type and application approach
(e.g. rate, timing), and hydrology (e.g. related to weather and climate) (Sharpley and
Jarvie, 2012).
2.1 Farming practices and trends in the WLEB
Row crops, largely corn and soybeans, predominate in both portions of the WLEB (over
70 percent of all crops for the two crops together), with smaller amounts of wheat,
alfalfa and hay, based on five-year agricultural census data for each country. Area
planted for the two major crops has not changed substantially since the 1990s, though
total area (for all crops) declined slightly from 1996 through 2011 (LimnoTech, 2017).
The stability in these two agronomic features, extent of farmed lands and crop type,
suggest that the causes of increased loadings of dissolved reactive phosphorus (DRP,
considered to be an important contributor to HABs) over the last two decades to Lake
Erie must be found in other factors.
Two key farm practices relevant to phosphorus export are extent of artificial drainage
and conservation tillage (Jarvie et al., 2017). Subsurface artificial (tile) drains are an
important component of agricultural production in poorly drained soils, used to lower
the water table thereby improving plant survival through increased root aeration and
allowing producers to maintain field access. Due to the substantial extent of clay soils in
17the WLEB, artificial drainage is common (Kalcic et al., 2016), and though few data exist
that quantify actual trends in tile drainage in the WLEB, anecdotal evidence suggests
that tiling has increased in recent decades.
Data from the mid-2000s indicated that most US counties in the WLEB have over 50
percent of acres tile-drained, and three of the four major watersheds in the Canadian
portion of the WLEB have over 50 percent of hectares tile-drained (LimnoTech, 2017).
Indeed, overall, 86 percent of agricultural land in the Maumee River watershed is
estimated to have drainage tiles (LimnoTech, 2017). In addition, the recent U.S.
Department of Agriculture (USDA) Conservation Effects Assessment Project (CEAP)
assessment of the US portion of the WLEB shows 63 percent of WLEB cropland has
some type of conservation tillage in place (i.e., either mulch tillage, seasonal no-tillage,
or continuous no-tillage), practices that were widely adopted in the region by the early
1990s, with no significant change in tillage practices between 2003-06 and 2012 surveys
(USDA NRCS, 2016).
In addition to row crops, the watersheds of the WLEB support substantial populations
of livestock, particularly cows, swine and chickens. These generate the manure that is
an important nutrient source and, along with commercial fertilizer, the main focus of
this report. Total livestock populations have remained relatively stable over the past 30
years in areas draining to the WLEB (LimnoTech, 2017). In the Canadian WLEB
drainage area, swine and poultry showed gradual increases over the 30-year period
while total cattle population showed a gradual decrease, resulting in an overall
relatively stable number of animal units (i.e. individual animals). On the other hand, in
the US portion of the watershed, total animal populations increased from 2002 to 2012
for cattle, swine and poultry (in the latter case, using a watershed-based accounting
method). Total animal numbers for the 2011-12 period were approximately 900,000
swine in both US and Canadian portions, 375,000 and 170,000 cattle, and 10.8 and 8
million chicken/poultry, in the US and Canadian portions of the WLEB, respectively.2
In addition, there has been a tendency toward larger farms in particular in the United
States, with increases of cattle, swine and poultry in the largest farm categories (for each
group) since 1987 (LimnoTech, 2017).
2.2 Commercial fertilizer application
Fertilizer application is one key factor in determining potential magnitude of nutrients
lost from watershed soils and entering WLEB tributaries. There are multiple types of
2
LimnoTech, 2017. Note for chicken/poultry, US numbers were based on the watershed-based estimation method.
18commercial fertilizer formulations, including fertilizers containing the two key
macronutrients phosphorus and nitrogen. Plants take up phosphorus as phosphate
(PO43-, with the exact form dependent on the soil pH), and there are several measures of
the solubility (or ability to dissolve) in water of phosphorus in such fertilizers, with
most commercial fertilizers containing at least 50 % water soluble P (OSU, 2006). Table
2-1 gives typical phosphorus and nitrogen levels for several common types of
commercial phosphate fertilizers.
Given that sales information is publicly available on a consistent basis (while direct
application data are not), commercial fertilizer application across the WLEB and over
time is best inferred from sales data at the county and state or province level. 3 Based on
agricultural census data (which are offset by one year between the United States in
2012, and Canada in 2011) and additional sales data, fertilizer application amounts by
three jurisdictions in the WLEB starting in the mid-late 1980s are provided in Figure 2-1.
Table 2-1: Phosphorus and nitrogen content of several commercial phosphate
fertilizers (from OSU, 2017)
Fertilizer Material % P (as P2O5)* %N
Single superphosphate 16-20 -
Triple superphosphate 44-48 -
Monoammonium phosphate (MAP) 48-61 10-12
Diammonium phosphate (DAP) 46 18
Ammonium polyphosphate 34 10
*: Phosphate is typically measured as P2O5.
3
County level (US only: Ruddy et al., 2006; Gronberg and Spahr, 2012); province and state level (Canada, US:
Bruulsema et al., 2011; IPNI-NUGIS 2012)
19Figure 2-1 Trends in commercial fertilizer phosphorus applied in the western Lake Erie basin. Total
phosphorus applied (in kilograms) (panel a), and rate applied (kilograms per hectare (ha), where one
hectare is approximately 2.2 acres) (panel b), for commercial fertilizer in the Ohio and Indiana
portions, Michigan portion, and Canadian portion of the western Lake Erie basin. Data are drawn
from IPNI NuGIS database, and cover census years (i.e., 1987, 1992, etc. for United States, and
offset by one year for Canada (e.g. 1986, 1991)), and two additional years (2010, 2011). Note that
2011 census data from Canada were not available at time of compilation. Similar data on nitrogen
were not compiled for this project. Figure modified (panel letters, hectare abbreviation) from
LimnoTech, 2017, and data available in appendices of technical report.
Total phosphorus (P) application in general shows higher amounts applied in the Ohio
and Indiana portions of the watershed. Application rates (kg ha-1, Figure 2-1b) show
slight decreases for the Michigan portion of the WLEB, decreasing trends in the
Canadian portion (though an increase in 2007), and variable trends for the Ohio and
Indiana portion.
Note that data on fertilizer form are not captured in the censuses; however, earlier data
in Ohio indicated a gradual shift in the past one to two decades to greater use of
monoammonium phosphate and less use of diammonium phosphate (ODA, 2013). In
the United States as a whole from 1995 – 2011, use of diammonium phosphate declined
by 32 percent, while use of monoammonium phosphate increased by 130 percent
(USDA, 2017a).
20Figure 2-2 Trends in commercial fertilizer phosphorus application intensity (kilograms per hectare)
by watershed in the WLEB (with data not available for Ontario for 2012). Ontario data (from the
agricultural census in Canada) cover the year prior to those indicated in each panel. (LimnoTech,
2017).
Commercial fertilizer application rate data (on a per area basis, as shown in Figure 2-1)
are provided in map form in Figure 2-2. As shown, application rates are higher in the
Sandusky, St. Joseph and Cedar-Portage watersheds in the United States, and higher
rates (in particular more recently) in the Essex region watersheds on the Canadian side.
21The data also show different temporal patterns – application rates are mostly declining
in individual US watersheds over the period, whereas in Ontario rates generally
declined to 2001 and then increased to 2006 (the most recent data available for Canada).
At the watershed scale, average commercial fertilizer application rates across
watersheds in the US portion in 2012 found in this assessment were 11 kg/ha (10
lb./acre), and were highest in the Sandusky watershed at 19 kg/ha (17 lb./acre)
(LimnoTech, 2017). Though not directly comparable, the USDA WLEB CEAP
assessment for 2012 reported an overall average application rate of 16.4 lb. /acre
(USDA, 2016); note that comparing findings between the two assessments would entail
several considerations. 4 In the Canadian portion, rates in 2006 (most recent year with
available data at the time of technical report preparation) averaged 16 kg/ha (14 lb.
/acre), with the maximum in the Essex region watersheds at 26 kg/ha (23 lb. /acre).
Across the US WLEB, crop removal ranged from approximately 11 to 22 kg/ha (10 to 20
lb. /acre). 5 This finding, which is consistent with the recent CEAP assessment (USDA,
2016), and which is summarized in the technical report (LimnoTech, 2017) and
supported by other recent reviews (e.g., Bruulsema, 2011; Han et al., 2012) indicates that
fertilizer application of phosphorus in the whole watershed is roughly balanced by P
removal in harvested crops. Because crop yields have in general increased in recent
decades while P fertilizer application has held steady or declined, this general pattern
implies an ongoing drawdown of soil phosphorus content across the WLEB. Indeed,
soil test phosphorus levels (a measure of P available to crops, rather than actual P
content of soils) have shown generally decreasing fraction of samples with higher (> 50
parts per million (ppm) P, and increasing fraction of samples with lower P, in counties
overall in the three states and Ontario. 6
2.3 Manure application
Application of animal manure is a longstanding practice in agriculture, which provides
organic matter to increase soil health and recycling of nutrients. At the same time,
improper application techniques can lead to excessive transport of nutrients, organic
matter and other constituents into surface and groundwater. In the WLEB, cattle, swine
or pigs and poultry are the dominant farmed animal operations. As noted above, total
livestock populations have remained relatively stable over the past 30 years in areas
4
Considerations include different methodologies (e.g., use of surveys in the CEAP assessment vs. fertilizer sales
data in the LimnoTech assessment, and ensuring use of same metrics (e.g. cropland acres, etc.); J. Bratton,
personal communication.
5
Based on IPNI-NUGIS, 2012.
6
Bruulsema, 2016, and reviewed in LimnoTech, 2017.
22draining to the WLEB, although there are some differences between the US and
Canadian portions of the watershed and increasing consolidation (larger operations) on
the US side in particular. The regulatory approach for animal feeding operations differs
in the two countries. In the United States, concentrated animal feeding operations
(CAFOs) of a certain size are regulated under the Clean Water Act, with
implementation typically done by state agencies. In the Canadian portion of the basin,
intensive livestock operations (ILOs) are regulated by Ontario agencies (i.e., Ontario
Ministry of Agriculture and Rural Affairs, and Ontario Ministry of the Environment
and Climate Change).
The quantity and characteristics of manure generated by livestock varies based on
several factors, in particular species, age and productivity of the individual animal, as
well as nutrient concentrations in and digestibility of its feed (OSU, 2006). Typical
phosphorus and nitrogen content in animal manures is provided in Table 2-2. The data
show the potentially wide range in P and N content possible within an animal group,
though some general patterns as well, including the generally higher P content in
poultry manure, and generally lower N:P ratios (not shown) for poultry manure as well.
Phosphorus in manure can be in both inorganic form (i.e. as phosphates) and organic
form, though most P is in the form of phosphate, and becomes available to plants after
application to cropland (Eghball et al., 2002). Further discussion on issues involving P
availability in manure is provided below and in Chapter 5.
Table 2-2: Phosphorus and nitrogen content of several manure types (from
OSU, 2005)
Manure Type % P (as P2O5)* % N*
Average Range Average Range
Dairy cattle 1.8 0.7 – 5.2 4.3 2.2 – 14.3
Swine** 4.3 1.4 – 6.8 14.0 2.7 – 24.2
Poultry*** 7.0 1.6 – 17.9 3.9 2.3 – 5.6
*: Percentages on a dry weight basis; **: Finishing; ***: Layers
Manure production quantities for the United States were drawn from the IPNI NuGIS
project database, which includes estimates based on livestock numbers reported in
census data, and reported excretion rates for different livestock (LimnoTech, 2017). Data
for the Canadian portion of the WLEB were drawn from a Canadian GIS dataset
(LimnoTech, 2017). Like total livestock populations discussed above, manure generation
has remained relatively stable, with no significant changes since the mid-1980s (through
the 2011-12 censuses), at roughly 8,000 tons of manure phosphorus produced annually
in each portion of the WLEB. Multiple studies carried out in the past decade resulted in
23You can also read