Mapping Ireland's coastal, shelf and deep-water environments using illustrative case studies to highlight the impact of seabed mapping on the ...
←
→
Page content transcription
If your browser does not render page correctly, please read the page content below
Downloaded from http://sp.lyellcollection.org/ by guest on April 7, 2021

Mapping Ireland’s coastal, shelf and deep-water
environments using illustrative case studies to highlight the
impact of seabed mapping on the generation of blue
knowledge
Ronan O’Toole1*, Maria Judge1, Fabio Sacchetti2, Thomas Furey2,
Eoin Mac Craith1, Kevin Sheehan2, Sheila Kelly1, Sean Cullen1,
Fergal McGrath2 and Xavier Monteys1
1
 Geological Survey Ireland, Beggars Bush, Haddington Rd., Dublin 4, Ireland
2
 Marine Institute, Rinville, Oranmore, Co. Galway, Ireland
  ROT, 0000-0003-0242-5611; FS, 0000-0002-2098-7071; EMC, 0000-0002-7919-6303;
SK, 0000-0002-5774-6212
*Correspondence: ronan.o’toole@gsi.ie

Abstract: Through Ireland’s national seabed mapping programme, Integrated Mapping for the Sustainable
Development of Ireland’s Marine Resource (INFOMAR), the collaboration between Geological Survey Ireland
and the Marine Institute continues to comprehensively map Ireland’s marine territory in high resolution.
Through its work, the programme builds on earlier Irish seabed mapping efforts, including the Irish National
Seabed Survey project in producing seabed mapping products that support Ireland’s blue economy, European
marine policy and international efforts to understand our global oceans. INFOMAR uses a variety of marine
technologies to deliver accurate bathymetric maps and useful data products to end users through a free and
open source licensing agreement. To reflect the diversity of applications these data products serve, a series
of four case studies are presented here focusing on marine geophysical and geological data from locations within
Ireland’s marine territories. The case studies illustrate how data generated through seabed mapping may be
interpreted to directly impact the generation of blue knowledge across a variety of marine environments ranging
from shallow coastal and shelf waters to the deep oceanic depths of the continental slope of Ireland’s marine
area. The impact of Ireland’s seabed mapping efforts is further considered in the context of national, European
and international initiatives where Ireland’s marine knowledge resource is leveraged to deliver positive benefit
to the programme’s stakeholders.

A history of Irish seabed mapping                              evolved into a follow-on national seabed survey ini-
                                                               tiative through a joint venture between GSI and the
Deep-water hydrographic and geophysical survey                 Marine Institute. The INtegrated mapping FOr the
operations to designate the boundaries of the Irish            sustainable development of Ireland’s MArine
continental margin in support of Ireland’s United              Resource (INFOMAR) programme was initiated to
Nations Convention on the Law of the Sea                       survey the remaining shelf and coastal waters
(UNCLOS) maritime territorial claims began off-                between 2006 and 2026, to deliver a seamless base-
shore Ireland in 1996 (Naylor et al. 1999), conducted          line bathymetry dataset to underpin the future man-
by Ireland’s Petroleum Affairs Division on behalf of           agement of Ireland’s marine resource (Dorschel
the Government of Ireland. Findings reinforced the             et al. 2010).
need for a comprehensive assessment of the entire                  To leverage the €80 m financial support required
Irish seabed. The Geological Survey Ireland (GSI)-             after INSS for mapping the gaps in the coastal, shelf
managed Irish National Seabed Survey followed                  and inshore waters of Ireland, a comprehensive
(INSS, 2000–06), an ambitious but successful pro-              review was commissioned to consider the pro-
gramme to survey Ireland’s entire deep-water terri-            gramme approach, cost and survey priorities. This
tory beyond 200 m water depth (Verbruggen and                  informed a two-phase programme strategy subse-
Cullen 2008). With national interests and develop-             quently developed (INFOMAR 2007) that outlined
ment opportunities largely coastal and shelf based,            the approach, outputs and anticipated beneficiaries.
and with one of the most detailed offshore cohesive            Phase 1, which was completed in 2015, focused on
seabed mapping knowledge resources available                   mapping 26 priority bays and 3 priority offshore
globally in 2006, mapping the gaps naturally                   areas that were deemed to be of most economic

From: Asch, K., Kitazato, H. and Vallius, H. (eds) From Continental Shelf to Slope: Mapping the Oceanic Realm.
Geological Society, London, Special Publications, 505,
https://doi.org/10.1144/SP505-2019-207
© 2020 The Author(s). This is an Open Access article distributed under the terms of the Creative Commons Attribution
License (http://creativecommons.org/licenses/by/4.0/). Published by The Geological Society of London.
Publishing disclaimer: www.geolsoc.org.uk/pub_ethics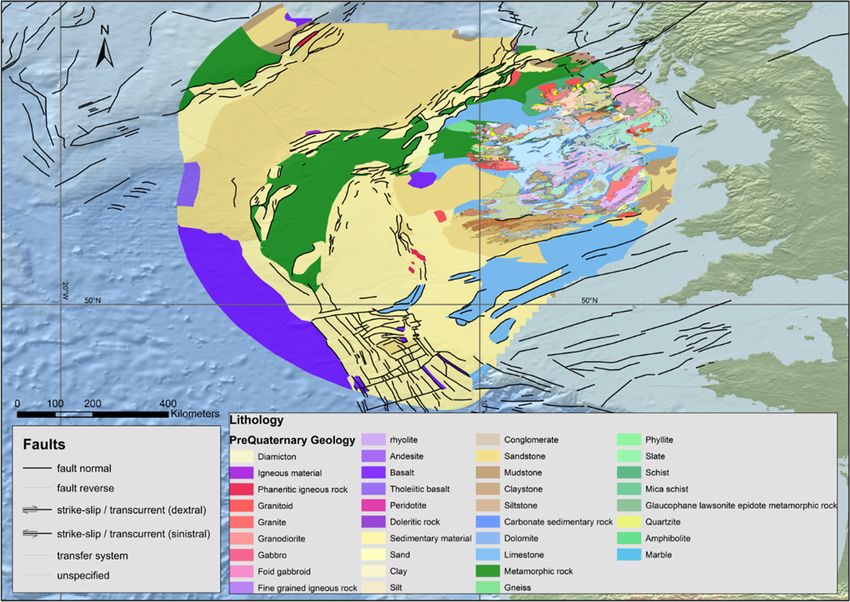
Downloaded from http://sp.lyellcollection.org/ by guest on April 7, 2021

                                              R. O’Toole et al.

significance to the country. Phase 2, which com-         accurate oceanographic modelling to assess coastal
menced in 2016, is focused on mapping the remain-       flooding and erosion risk, as well as state-of-the-art
ing unsurveyed marine areas and building on the         ecosystem investigations such as assessing the
knowledge and expertise generated through the ini-      aquaculture-carrying capacity of inshore waters.
tial project phase.                                     Shelf and offshore mapping provides a foundation
    Following Government of Ireland approval and        for aggregate resource and habitat assessments,
INFOMAR’s commencement in 2006, the joint pro-          informing permitting and development decisions,
gramme management of GSI and Marine Institute           while enabling protection of key fish spawning and
coordinated a seminal cost benefit analysis (CBA)        nursery grounds (Sutton 2008). Collectively, these
to investigate the economic impact of the seabed        coastal and offshore marine data enrich the efforts
mapping initiative across all marine sectors (PwC       of Ireland’s research community who analyse the
2008). Taking a conservative approach, a 4–6            bathymetry data for a multitude of applications.
times return on investment was reported, depending          As of 2019, Ireland’s database of marine data has
on the duration over which the programme was com-       grown in excess of 120 terabytes (TB) and continues
pleted. This proved to be a critical assessment in      to expand. The database comprises a range of geo-
securing future annual programme investment, par-       physical data measurements including multibeam
ticularly despite national fiscal challenges from        echosounder (MBES) bathymetry and backscatter,
2008 onwards. Subsequent independent reviews            shallow seismic profiles, gravity, magnetics, side-
commissioned by the programme carried out by            scan sonar and oceanographic water column profiles.
PwC and Risk Solutions have further supported the       It also houses information on the many physical
case for continued seabed mapping, with key recom-      ground-truthing samples and interpreted observa-
mendations tabled and implemented incrementally         tions including, for example, shipwreck discoveries
year-on-year (PwC 2013; Risk Solutions 2016).           of which there are currently 426 listed in the
    INFOMAR is a key cross-sectoral enabling            INFOMAR database.
action in Ireland’s integrated marine plan, ‘Harness-       One of the key drivers behind the successful
ing Our Ocean Wealth’ (Government of Ireland            uptake of Ireland’s seafloor mapping data has been
2012) with an oversight Board and Technical Advi-       the Irish government’s Open Data Initiative (DPER
sory Committee (TAC) governance structure ensur-        2017). Supported by the Union (EU) Open Data
ing its relevance to all key stakeholders nationally.   Directive (EU 2019), this major government initia-
The primary marine bathymetry dataset derived           tive ensures that INFOMAR data are freely available
from full coverage high-resolution multibeam            to the public. Online access is favoured as a direct
echosounder surveying, is critical for the develop-     route to the range of high-quality data and data prod-
ment of Ireland’s marine knowledge, economy and         ucts produced. The revised programme website,
policy, as well as the protection of its marine envi-   relaunched in November 2018 has been developed
ronment. With an ethos of improving efficiency           with the aim of providing a contemporary feel for
and embracing innovation, domestically the pro-         the end user, while strengthening the value of pro-
gramme supports the needs of Irish society, industry    gramme outputs. Provision of straightforward access
and government, while internationally it contributes    to the data is a key objective. This has been accom-
to numerous EU Directive-related reporting, regula-     plished through the production of web map services
tory and monitoring obligations (PwC 2013).             (WMS) and availability of embedded data viewers.
                                                        A simple web-viewer available on the website home-
                                                        page allows for the visualization and exploration of
Knowledge as a marine resource                          Ireland’s marine territory in detail and is capable
                                                        of displaying multiple layers of seafloor information.
Ireland’s seabed mapping efforts initially began with   The programme’s official data download portal is the
the aim of developing a marine baseline dataset to      Interactive Web Data Delivery System (IWDDS),
underpin national security as well as future eco-       which is accessible through the INFOMAR website
nomic, environmental, infrastructural and policy        and provides free and open data to programme
decisions for Ireland as set out in the INFOMAR         stakeholders.
Proposal and Strategy. With more than 20 years of           Key products, designed around stakeholder
seabed mapping undertaken to date, this endeavour       requirements include Geographical Information Sys-
is being steadily achieved with over 700 000 km2        tem (GIS)-compatible datasets: bathymetry, back-
of the seafloor within the Irish designated area         scatter and shaded relief as geo-referenced images;
mapped to date in high resolution (Fig. 1).             sediment samples and shipwrecks as point files; sedi-
    Shallow water mapping reveals uncharted rocks       ment classification and survey coverage as polygon
and unknown shipwrecks, delivering safe navigation      files; and survey track lines as polyline files. In addi-
data within the busiest zones for marine traffic. Data   tion, raw data are made available on request for those
describing the geomorphology of the seabed enable       working with non-standard applications and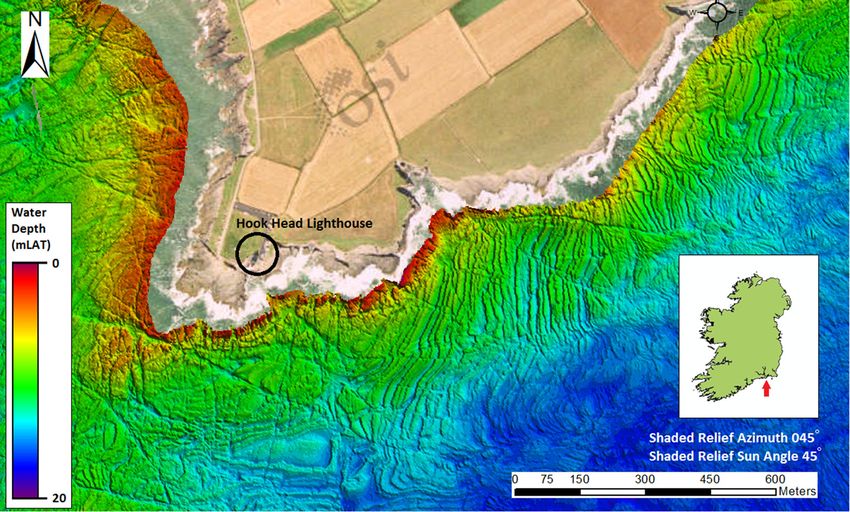
Downloaded from http://sp.lyellcollection.org/ by guest on April 7, 2021

                              Mapping coastal, shelf and deep-water environments

    Bathymetry(m)
          0
          –500
          –1,000
          –1,500
          –2,000
          –2,500
          –3,000
          –3,500
          –4,000
          –4,500
          –5,000
          –5,500

Fig. 1. ‘The Real Map of Ireland’ – Irish Designated Area, Coordinate Reference System: Web Mercator (EPSG
code: 3857).

software. For users who are unfamiliar with GIS pro-      pan-European data products that include Irish data
cesses or other technical software, the data are avail-   are freely available for global dissemination and
able in formats that can be easily displayed on widely    usage.
available free software and viewers such as Google            INFOMAR programme data are further distribu-
Earth.                                                    ted through international open-access data portals:
    Integration of regional marine data from the          for example, the National Oceanic and Atmospheric
world’s oceans enhances our understanding of the          Administration (NOAA) archives, where the NOAA
Earth’s coasts, seas and oceans as a globally con-        Bathymetric Data Viewer enables users to view and
nected system. To support the integration of marine       download raw and processed seabed mapping data
knowledge for cross-border, European and interna-         from Ireland’s past and present seabed mapping pro-
tional collaborations, Ireland’s seabed mapping data-     grammes. Through this well-known facility, Irish
sets are analysed and interpreted by programme staff      seabed data reach a broad global network of potential
to produce standardized products and metadata com-        end users. These data resources are also integrated in
patible with international initiatives. The European      the Nippon Foundation’s Generalised Bathymetric
Marine Observation and Data Network (EMODnet)             Chart of the Ocean (GEBCO) compilation and are
is a large-scale pan-European marine data initiative      one of the largest data contributors to the Seabed
(Kaskela et al. 2019). Funded by the European             2030 initiative (Mayer et al. 2018). Additionally,
Commission, it aims to implement the EU’s                 through participation in international partnerships
Marine Knowledge 2020 strategy (EU 2010). The             such as AORA (Atlantic Ocean Research Alliance),
INFOMAR seabed-mapping programme has con-                 ASMIWG (Atlantic Seabed Mapping Inter-
tributed data to EMODnet’s Bathymetry, Geology            national Working Group) and CHERISH (Climate,
and Seabed Habitats lots. Through these projects,         Heritage and Environments of Reefs, Islands and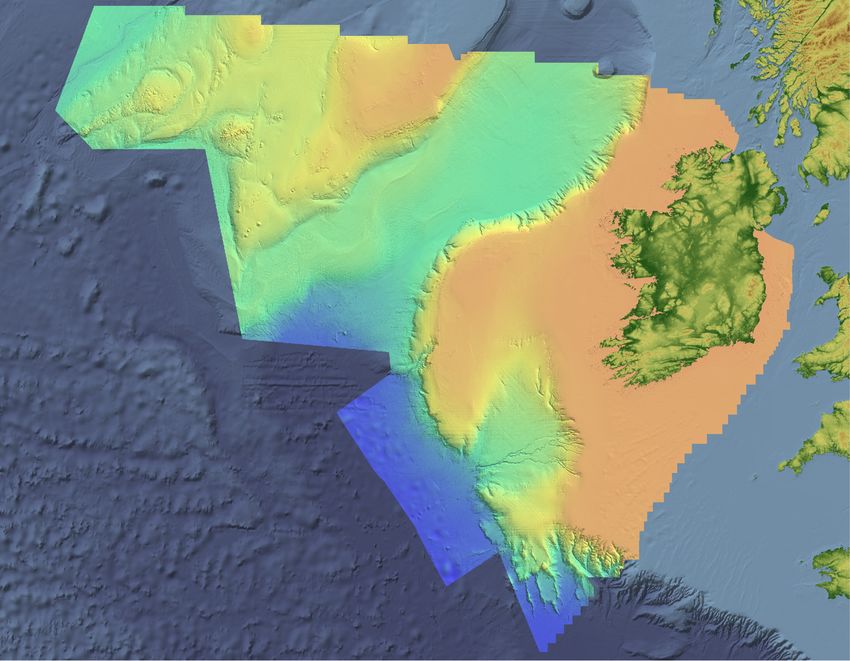
Downloaded from http://sp.lyellcollection.org/ by guest on April 7, 2021

                                                R. O’Toole et al.

Headlands) Ireland’s seabed mapping results are fur-      relevant by the possibility of future development of
ther distributed to a broad international community       renewable energy infrastructure at the site and pro-
of multidisciplinary data end users.                      vides a wealth of knowledge on the types of consid-
                                                          erations that will be instrumental for future offshore
                                                          development plans. The fourth case study details an
Irish seabed mapping case studies:                        overview of deep-water geological and geophysical
enhancing our knowledge of Ireland’s                      data. These data were used in conjunction with
marine environment                                        INSS and INFOMAR bathymetry data to produce
                                                          the first bedrock map of Ireland’s offshore Exclusive
Gauging the impact of Ireland’s marine data dissem-       Economic Zone (EEZ) as part of work undertaken
ination strategy and wider activity at national, Euro-    for the EMODnet Geology project. Now complete,
pean and international levels is a subject that will be   the map details a chronology of Ireland’s geological
considered further in this paper; however, to illus-      history dating back to the Grampian. Geological
trate the impact of how baseline seabed mapping           knowledge of this kind can be applied in support
datasets and products can be utilized to enhance          of multiple applications including: habitat mapping;
our understanding of the marine environment, gener-       marine spatial planning; environmental conserva-
ating new knowledge and insights, a series of four        tion; and resource mapping.
case studies is presented in this paper.                      Taken together, these case studies are effective in
    The case studies focus on a variety of marine         demonstrating the value of seabed mapping in fur-
environments found within Ireland’s designated            thering our understanding of the broad range of
marine territory (Fig. 1), traversing from the coastal,   marine environments that make up Ireland’s marine
shallow waters of the inshore marine areas, progress-     resource. Finally, this paper considers the impact
ing across the continental shelf and onwards to the       of Ireland’s seabed mapping efforts as they relate
continental slope and deep ocean floor. These case         to national, European and international initiatives,
studies consist of four individual interpretations of     education, research and industry and reflects on Ire-
Irish marine data that illustrate how analysis of Ire-    land’s future activities and prospects in the sphere of
land’s marine data resources can enhance the under-       marine and ocean science at the beginning of the
standing of Ireland’s marine environment, geology         United Nations Decade of Ocean Science for Sus-
and submerged landscapes.                                 tainable Development (2020–30) movement as Ire-
    The first case study focuses on the Hook Head          land continues in its aim to map, observe and
peninsula and Waterford Estuary. This study illus-        predict its coasts, seas and oceans.
trates how high-resolution MBES datasets can be
used to explore a potential submerged landscape.
Offshore extrapolation of onshore geological fea-         Case study 1: a coastal submerged
tures and interpretation of overlaying bathymetric        landscape; Hook Head – a seabed within a
characteristics reveals information about submerged       seabed
landscapes and the Last Glacial Maximum (LGM).
The second case study is located further out to sea,      The extent of exposure of Ireland’s continental shelf
SE of Ireland, on the Irish continental shelf and rep-    due to a lower sea-level during and following the last
resents a detailed overview of the programme’s map-       glaciation is still being understood, but bathymetry
ping rationale, approach and procedures when              data from Ireland’s seabed mapping data resource
surveying and analysing a specific survey block.           present compelling evidence for potential sub-
Geological and geophysical data including multi-          merged landscapes in the country’s coastal and near-
beam sonar data are recorded to reveal substrate          shore environment. Submerged landscapes are
geology and environmental information. As the site        features on or below the seafloor that can be reason-
is known for its significance to the Irish fishing sector   ably deduced to have been subaerially exposed in the
as a Nephrops fishery, the impact of the blue knowl-       past, before sea-level rose to where it is today. One
edge generated through seafloor, substrate and habi-       place where INFOMAR bathymetry data help build
tat mapping is also described, facilitating enhanced      a strong case for the presence of submerged land-
stock assessments. The third case study presented         scapes is Waterford Estuary on the south coast of Ire-
focuses on a dynamic shelf environment offshore           land. In this study, high-resolution shaded relief
North Donegal. The study details interpretation of        bathymetry from Waterford Estuary and its sur-
baseline multibeam sonar data that infer a high-          rounding area has been used to infer the presence
energy dynamic environment from mobile sedimen-           of these submerged seafloor features in conjunction
tary seabed features. A resurveying of the area is        with contemporary geological knowledge from the
used in correlation with existing hydrographic mod-       area in order to consider the relationship between ter-
els to examine the driving forces of sediment mobil-      restrial observations and the potential submerged
ity in this region. The study is made all the more        landscape features identifiable in the shaded relief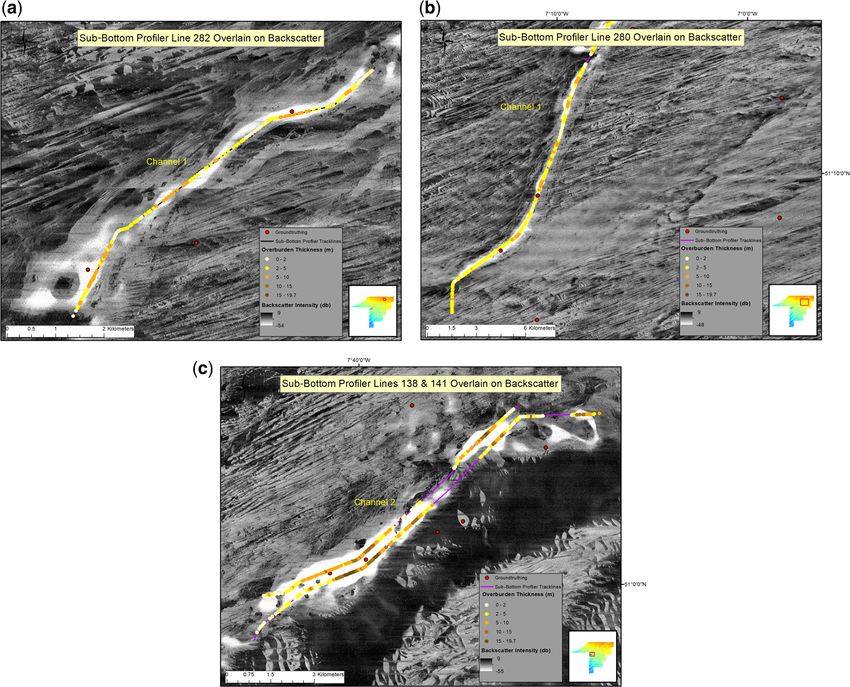
Downloaded from http://sp.lyellcollection.org/ by guest on April 7, 2021

                              Mapping coastal, shelf and deep-water environments

bathymetry data. By visualizing bathymetry data at             Hook Head, County Wexford is a prominent pen-
high resolution and adjusting parameters such as hill      insula in the SE of Ireland located at the eastern bank
shading and water depth colour-scale, these data can       of Waterford Estuary (Fig. 2). It is comprised of
be used to identify and represent images of underwater     rocks ranging from Cambrian in age to Devonian
outcrop and submerged, ancient landscape features.         and continues upwards into a Lower Carboniferous
    High-resolution MBES bathymetry data featured          limestone assemblage (GSI 2018). The geological
in this study were acquired during ongoing INFO-           record of Hook Head and its modern, adjacent
MAR inshore survey operations. Acoustic soundings          seabed details an evolution through continental col-
data were processed using a Teledyne-CARIS HIPS            lision, both ancient and modern sea-level as well as
& SIPS™ hydrographic software package. Tidal and           glaciation. Around the base of its scenic lighthouse,
navigation corrections, sound velocity and noise           Carboniferous coral fossils are exposed in abun-
cleaning processes were applied to the data in             dance in subaerial conditions (Sleeman et al.
order to generate a high resolution bathymetric grid       1974). One can walk over rocks that were once sub-
of the study area in the World Geodetic System             merged calcareous deposits on a tropical seafloor
1984 (WGS84) Coordinate Reference System                   akin to the present-day Bahamas. This once coral-
(CRS) and vertically referenced to Lowest Astro-           rich seabed, however, now lithified and uplifted,
nomical Tide (LAT) using the United Kingdom                forms the modern limestone seabed as we move
Hydrographic Office (UKHO) Vertical Offshore                from the headland, underwater, down below contem-
Reference Frame (VORF) model (Ziebart et al.               porary sea-level. This rock, detailed using high-
2007). The resulting bathymetric grids were                resolution nearshore bathymetry (Fig. 3), is a sub-
exported in a standard ESRI™ format and brought            strate for modern sea life. Modern geological pro-
into ARC-GIS™ software for further analysis and            cesses and sea-level change have facilitated the
juxtaposition with GSI’s 1:100 000-scale geological        phenomenon where the modern seabed sits directly
map series. This methodology allowed for a broad           atop the ancient Carboniferous seabed, each sepa-
examination of the study area’s seafloor morphology         rated in time by more than 300 Ma.
in the context of potential submerged landscapes and           On land, the solid geology of Hook Head is well
the area’s geological history as determined from           documented (Tietzsch-Tyler and Sleeman 1994).
terrestrial-based studies.                                 The peninsula is long and narrow, consisting of

Fig. 2. Geology of Hook Head peninsula, Co. Wexford overlaying grey-scale hillshade bathymetric layer.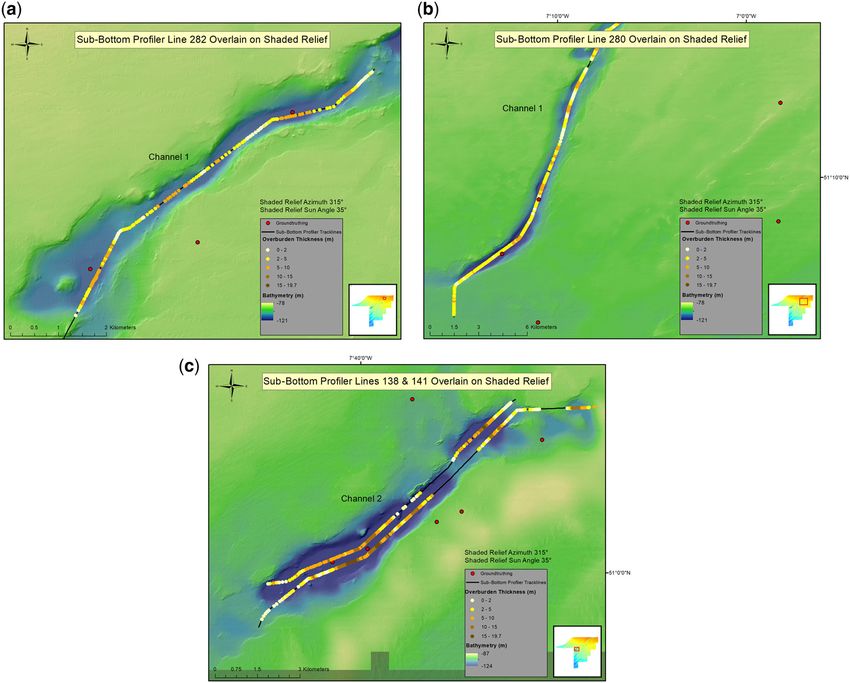
Downloaded from http://sp.lyellcollection.org/ by guest on April 7, 2021

                                                R. O’Toole et al.

Fig. 3. INFOMAR bathymetry around the tip of Hook Head, draped over aerial photography (© Ordnance Survey
Ireland/Government of Ireland 2020/OSi_NMA_041). The data show the typical strata and weathering patterns often
associated with seafloor limestone, supporting the inference that the limestone around the base of the lighthouse
extends offshore.

geological formations that, as we step in a southward     southernmost tip of the peninsula and proceed under-
direction off the ancient Cambrian basement of the        water, detailed seafloor bathymetry illustrates the
mainland, span from the Devonian through to the           probable continuation of these stratigraphic units
Carboniferous. The story of sea-level and environ-        offshore (Fig. 3).
mental change here begins with the ancient Cam-               Deposits that were once laid down in a warm
brian rock, formed from the accumulation of               tropical environment now form the hard substrate
deep-water slope sediments on a continental margin        below the present-day Celtic Sea. This same sub-
of the long-gone Iapetus Ocean around 500 Ma ago          strate was only recently inundated, however, on a
(Tietzsch-Tyler and Sleeman 1994). Following this,        geological timescale. During the last ice age, the
continental collision resulted in the building of an      area was glaciated, with evidence for the advance
ancient mountain chain – the Caledonian Orogeny –         of a grounded Irish Sea glacier (Ó Cofaigh and
during which the Iapetus Ocean was closed and a           Evans 2001). Following the LGM, 27 000 ka BP
large continental landmass formed (Tietzsch-Tyler         (Clark et al. 2012), the ice sheets receded rapidly,
and Sleeman 1994). The Old Red Sandstones of              albeit unevenly, due to climatic warming (Chiverrell
the Devonian, comprising the peninsula’s landward         et al. 2013). However, sea-level remained low dur-
end (Fig. 2), were originally laid down in an alluvial    ing a period of isostatic rebound that temporarily out-
setting as these Caledonian mountains were eroded         paced the inevitable sea-level rise due to meltwater
(Woodcock and Strachan 2002). The Lower Carbon-           (Edwards and Brooks 2008).
iferous then saw a gradually northward-advancing              Waterford Estuary extended further out to sea and
sea, with the sedimentary rocks overlying the Old         the coastline in the area was further south. This is
Red Sandstones formed in marine conditions again.         clearly visible in the bathymetry data in Figure 4.
At this point, continental drift had brought Ireland’s    Interpretation of the shaded relief bathymetry
ancestral basement rocks close to the equator and so      (Fig. 4) allows the erosion pattern of the bedrock
these shallow seas were tropical and teeming with         to be visualized as a possible palaeochannel exten-
prehistoric life, such as corals, brachiopods, crinoids   sion. Beyond the harbour mouth, despite recent
and bryozoans (Meere et al. 2013). These are the          marine sedimentation, the expression of the palaeo-
fossils underfoot as one stands on the shoreline          channel is visible in the bathymetric imagery in the
below Hook Head lighthouse. As we depart the              mouth of Waterford Estuary (between Dunmore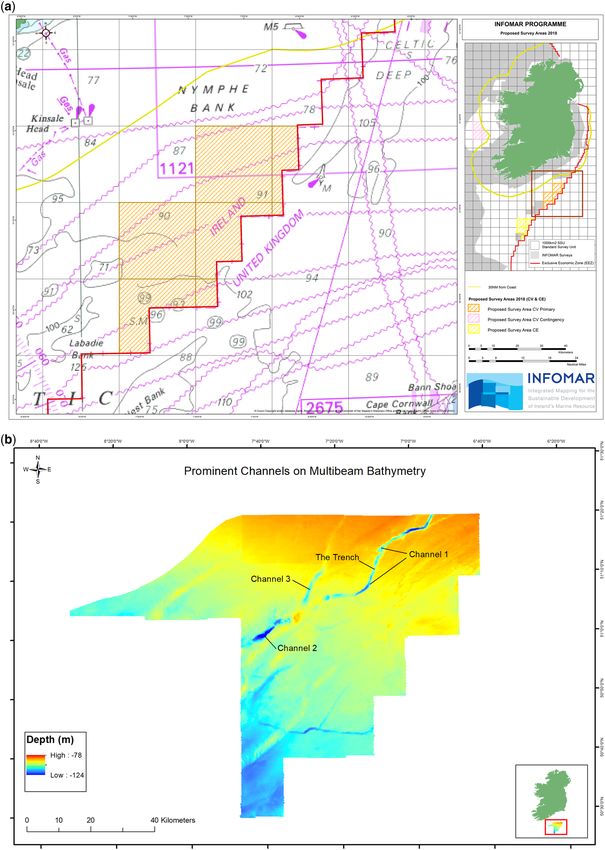
Downloaded from http://sp.lyellcollection.org/ by guest on April 7, 2021
                                                                                                                                                                         Mapping coastal, shelf and deep-water environments
Fig. 4. Coastal bathymetry around Waterford estuary displaying: (1) possible palaeochannel extension; (2) submerged meandering channel feature; and (3) ridge features
interpreted as possible eskers.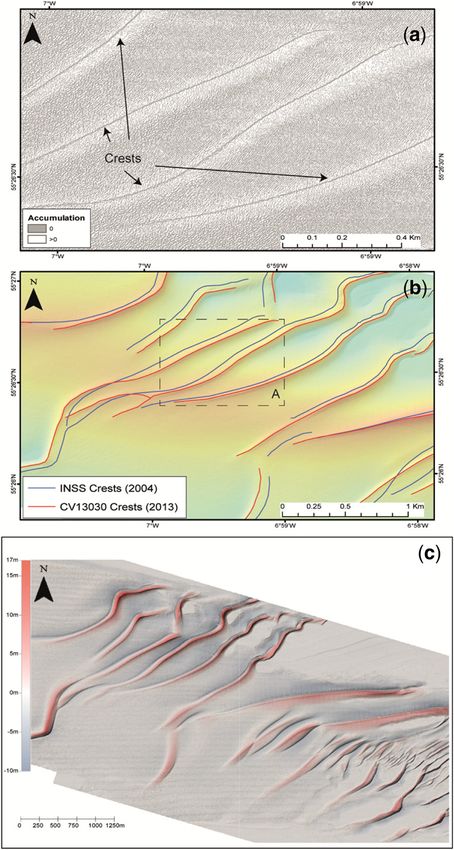
Downloaded from http://sp.lyellcollection.org/ by guest on April 7, 2021

                                               R. O’Toole et al.

East and Hook Head) as a readily identifiable sea-        the coastline’s response to a changing climate. In
floor feature, a bathymetric low, between areas of        addition, using modern bathymetric imagery to
bedrock. Studies have traced this palaeochannel fur-     enhance the understanding of our ancient and fasci-
ther offshore and indicate that the channel contained    nating heritage beyond the coastline and sharing
much higher water flows than the present day and so       that knowledge with the public promotes Ocean Lit-
may have been formed by discharges of meltwater,         eracy, which presently aims to raise awareness of the
flowing with great energy from the ice and out            ocean’s impact on our lives (NOAA 2013) at a vital
over the exposed shelf (Gallagher 2002).                 time for the protection of the marine environment.
    Along with the palaeochannel, the ridge features
interpreted from the bathymetry marked in Figure 4
have been suggested to be eskers, laid down              Case study 2: characterizing underwater
during glaciation in tunnels of meltwater below the      channels on the Celtic Sea shelf, Southern
ice (Tóth et al. 2016). As the ice retreated, these      Ireland
may have formed prominent subaerial landscape
features for a time before the sea transgressed north-   As part of the INFOMAR programme’s 2018 seabed
wards. So, in addition to the Carboniferous trans-       mapping campaign, the RV Celtic Voyager mapped
gression, examination of the seabed features in the      seabed adjacent to the Ireland/UK EEZ in the Celtic
study area suggests a story of more recent sea-level     Sea. Figure 5a shows the chart outlining the desig-
change too.                                              nated survey area prior to commencement of survey
    High-resolution bathymetry acquired in the           operations. Mapping was conducted over 74 charter
region, highlights additional channel features cutting   days and 3 separate surveys. It is an important area
through the bedrock (Fig. 4). Also interpreted from      for a number of commercial fish species. Figure 5b
the seafloor imagery is a meandering gap in the bed-      shows the final multibeam bathymetry survey cover-
rock with a ribbon-like geometry. This feature may       age for the campaign with prominent channels
be related to terrestrial drainage systems, much like    annotated.
the rivers we see on land today. This is inferred as         As with all INFOMAR seabed mapping cam-
a relic of the terrestrial landscape that post-dates     paigns conducted on the RV Celtic Voyager, geo-
the ice age and pre-dates the significant sea-level       physical datasets acquired included multibeam
rise. Sea-level rise lagged behind the receding ice      bathymetry, backscatter and sub-bottom profiler
(Edwards and Brooks 2008).                               data. Shaded relief and substrate slope angle prod-
    In summary, high-quality bathymetry data reveal      ucts are produced from the multibeam bathymetry
the exposed bedrock offshore Hook Head (Fig. 2),         data and ground-truth data from sediment grabs aug-
the lithology and structure of which can be extrapo-     mented the backscatter data. For these three surveys
lated from detailed geological mapping on land.          in 2018 the RV Celtic Voyager mapped a total area of
Here the stratigraphy reveals Cambrian deep-water        5650 km2 in water depths ranging from 78 to 124 m
sedimentation giving way to terrestrial conditions       as shown in Figure 5b.
in the Devonian. These are sequentially followed             Three large-scale channels are observed within
by fossiliferous lithologies laid down in Carbonifer-    this region of Ireland’s continental shelf (Fig. 5b).
ous shallow tropical seas. More recent potential         One of the channels, known colloquially as ‘The
Esker deposits result from the last ice age, now         Trench’, had not been previously well defined. As
drowned by recent sea-level rise. Further offshore,      a result of the survey campaign, ‘The Trench’ is
the deepening seabed disappears under a blanket of       now mapped in high resolution and charted with
recent Holocene marine sedimentation. By combin-         two additional channels close by. All three channels
ing terrestrial geological observations and studies      are detailed here with data acquisition methodology
with state-of-the art bathymetric seafloor imagery        and scientific results. They are significant geomor-
in the manner described, a picture of ancient and        phological features and form a part of the important
more recent coastal change and evolution can be          Nephrops fishery of the Celtic Sea Mud patch. The
generated.                                               Trench comprises 177 km2 of the 14 469 km2 Celtic
    In mapping the spatial distribution of probable      Sea Mud patch area currently surveyed for Nephrops
submerged landscape features to a high degree of         stock assessment. It is a fishery yielding landings in
accuracy and resolution, data products from the          the region of approximately 5000 tonnes annually
INFOMAR programme support research into past             over the last decade (Doyle et al. 2019) and, in 2018,
climate change. The dating and further interpretation    Irish landings were worth around €56 m (White et al.
and study of these features may help constrain the       2019) at first sale.
position of Ireland’s palaeocoastline at different           High-resolution multibeam bathymetry and
times in the geological record, thus helping to recre-   backscatter (Fig. 6) data were acquired and presented
ate past sea-level curves. Such information is impor-    along with the derived shaded relief images illus-
tant for informing models of future sea-level rise and   trated in Figure 7, while substrate slope angle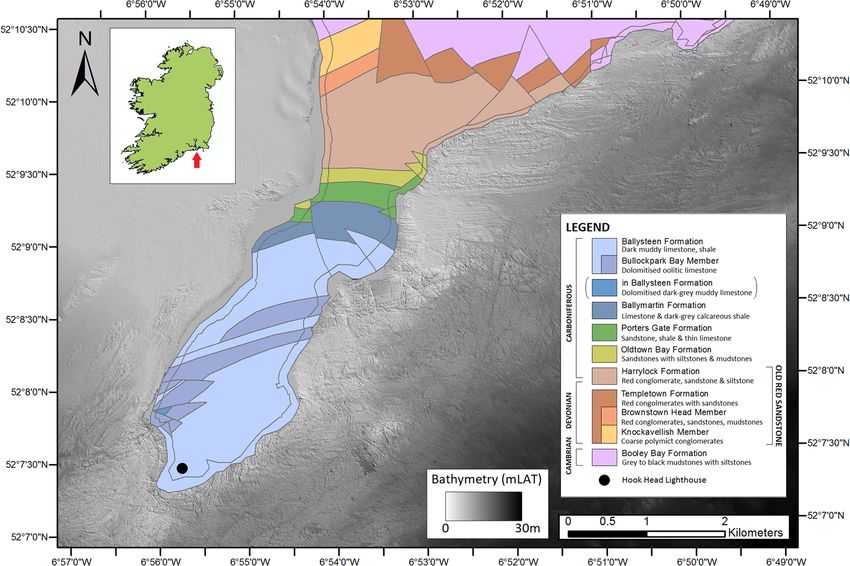
Downloaded from http://sp.lyellcollection.org/ by guest on April 7, 2021

                               Mapping coastal, shelf and deep-water environments

Fig. 5. (a) RV Celtic Voyager-designated survey area, Celtic Sea shelf, Southern Ireland and bathymetry chart of
mapped area (b).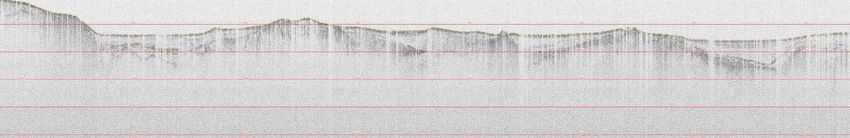
Downloaded from http://sp.lyellcollection.org/ by guest on April 7, 2021

                                                  R. O’Toole et al.

Fig. 6. Sub-bottom profiler lines overlain on backscatter for (a & b) Channel 1 and (c) Channel 2.

products documented in Figure 8 were derived from           This information provided valuable data for seafloor
the underlying bathymetry. Sub-bottom profiler data          classification and important auxiliary information for
(Fig. 9) from channels 1 and 2 have been analysed           a bathymetric survey. A hull-mounted pinger source
and interpreted resulting in overburden thickness           2 × 2 transducer array sub-bottom profiler operating
plots, which are displayed over the backscatter and         at 3.5 kHz was used for sub-bottom data acquisition.
shaded relief imagery respectively in Figures 6 and         The sweep time was varied appropriately with water
7. Ground-truth data and sub-bottom track lines of          depth to maximize ping rate and resolution. The
interpreted profiles are overlain on both the backscat-      pinger source is chosen as most effective in investi-
ter and shaded relief data. For this study, a combina-      gations of the top 20 or 30 m sub-seabed and where
tion of bathymetry, backscatter, sub-bottom profiler         sediments are fine to medium grained as readings
and ground-truthing data are analysed and inter-            indicated for this area.
preted in order to illustrate the impact of integrating         Ground-truthing stations for validating the multi-
multiple data sources for the characterization of a         beam interpretations were acquired using a Day grab
commercially and environmentally significant area            sampler. The Day grab was deployed from the star-
of Ireland’s marine territory.                              board side of the vessel and gave consistently full
    The standard survey line pattern selected for this      samples with no empty returns during the operation.
operation represented east–west reciprocal lines with       Grab-sample locations were selected based on expert
a line spacing of approximately 400 m. A Kongsberg          interpretation of the multibeam backscatter data and
EM2040 high resolution MBES mounted on a                    geographical spread when possible; however, oppor-
retractable pole was used for swathe acoustic acqui-        tunistic samples were also acquired at Sound Veloc-
sition. Backscatter acquired by multibeam sonars            ity Profile (SVP) stations occasionally. A total of ten
contains important information about the seafloor            grab samples were acquired within or proximal to
and its physical properties (Lurton et al. 2015).           the channels. Samples were photographed and
Downloaded from http://sp.lyellcollection.org/ by guest on April 7, 2021
Mapping coastal, shelf and deep-water environments
Fig. 7. Sub-bottom profiler lines overlain on shaded relief bathymetry for (a & b) Channel 1 and (c) Channel 2.
described. All samples will undergo particle size of fisheries management. They help plan the loca-
analysis, the results of which will be used to create tions of sampling stations for stock assessment sur-
substrate maps which become available through the veys and also can be used to correlate catch data
INFOMAR website as they are generated and final- with sediment type in order to estimate the abun-
ized. Substrate maps are important for the purposes dance of the stock. Currently, the map for the Celtic
Fig. 8. Celtic Sea channel slope analysis for (a) Channel 1 and (b) Channels 2 and 3.Downloaded from http://sp.lyellcollection.org/ by guest on April 7, 2021
R. O’Toole et al.
Sea is a broadscale European Nature Information from 103 to 124 m in Channel 2. Channel 3 runs
System (EUNIS) habitat map made up from interpo- from the north of the area in a south-southwesterly
lated benthic samples and known sediment types direction where it intersects with the elevated area
based on data from Vessel Monitoring System between Channels 1 and 2. Bathymetry varies from
(VMS) on targeted fisheries (e.g. Nephrops). This 87 to 106 m within this channel and it deepens
map is currently being updated using interpreted from north to south. Channel 3 spans approximately
high-resolution acoustic data from newly acquired 30 km. All three channels terminate in the same area.
MBES data and opportunistic samples. The new A number of other large-scale channels are also
map will be classified to Folk and will be refined observed in the multibeam bathymetry data.
into a broad benthic habitat map using bathymetry Sub-bottom profiler data for four selected chan-
and other environmental data as part of the pro- nel infill survey lines were played back through
gramme’s ongoing commitment to produce high- CodaOctopus GeoSurvey™, which is an advanced
quality data products from its mapping outputs. software package for processing and interpretation
Bathymetry grids, shaded relief and bathymetry of sub-bottom data. Seabed tracking, a bandpass fil-
geotiff images were created in Teledyne CARIS ter with low-cut 1000 Hz and high-cut 4700 Hz,
HIPS & SIPS™ software. Backscatter mosaics heave correction and a suitable display gain were
were created in QPS FMGT™ software. Geotiffs applied to the data. The bedrock horizon was digi-
and grids were imported into ESRI ArcGIS™ soft- tized on each profile using the tagging function in
ware where substrate slope maps can be created CodaOctopus GeoSurvey™. Two-way travel time
from the respective bathymetry grids using the ‘Sur- to the bedrock horizon was used to calculate over-
face Slope’ function in ArcToolbox™. burden thickness. Text files were exported contain-
Figure 5b displays the resulting multibeam bathy- ing position and overburden thickness. The files
metry data with the most prominent channels in the were imported into ArcGIS, overburden thickness
area annotated. Channel 1 stretches from the NE to was plotted and then overlain on multibeam back-
the SW in a sinuous shape spanning a distance of scatter (Fig. 6) and shaded relief data (Fig. 7).
nearly 50 km. Its margins are well defined for the Figure 9a and b show raw data for sub-bottom pro-
most part. Channel seafloor depth varies from filer lines 280 and 282 (Channel 1) and Figure 9c
approximately 100 to 120 m and its width varies and d show raw data for sub-bottom profiler lines
from 400 m to 2.5 km. The northern limit of this 138 and 141 (Channel 2). These four lines were
channel extends beyond the boundary of our data. selected for interpretation and analysis. All lines
Channel 2 is orientated along a NE to SW axis. It were acquired in the centre of the channels and par-
is approximately 18 km in length with well-defined allel to channel axes.
channel margins. An elevated area of substrate sepa- Figure 7a and b show the interpreted sub-bottom
rates it from Channels 1 and 3. Seafloor depth ranges profiler data for lines 282 and 280 respectively,
(a) Sub-Bottom Profiler Data
2-way travel time
Profile 138 Sediments 140 ms
Sediments
SW Bedrock Bedrock Bedrock NE 170 ms
15.0 km
(b)
2-way travel time
Profile 141
Sediments 160 ms
Bedrock Sediments
Bedrock
180 ms
NE SW
Bedrock
11.3 km
(c)
2-way travel time
Profile 280 130 ms
SW Bedrock NE 150 ms
19.9 km Bedrock
(d)
Profile 282 2-way travel time
Sediments Sediments
Sediments 150 ms
Bedrock
Bedrock Bedrock
170 ms
SW NE
7.8 km
Fig. 9. Sub-bottom profiler data for lines (a) 0138, (b) 0141, (c) 0280 and (d) 0282.Downloaded from http://sp.lyellcollection.org/ by guest on April 7, 2021
Mapping coastal, shelf and deep-water environments
overlain on multibeam shaded relief data. Each node bathymetry data, suggesting fine-grained sediments.
on the images represents the overburden thickness at Small localized areas of relatively high backscatter
those locations. Bedrock is evident throughout the returns are also evident within the channels and
entire length of both survey lines, mostly at depth along channel margins. Correlating backscatter
but sporadically as seabed outcrop. The maximum data with the bathymetry suggests that the high back-
overburden thickness on profile line 280 is 7.4 m scatter returns along channel margins and within
and 9.2 m on line 282. Greatest overburden thick- parts of the channels comprise bedrock.
ness correlates with topographic lows on the bedrock The substrate slope map of Channel 1 and sur-
horizon, where sediments infill these depressions. rounding areas is presented in Figure 8a. A slope
Figure 7c shows sub-bottom profiler lines 138 and scale of 0 to .10° is used with corresponding
141 overlain on multibeam shaded relief data. Out- green to red colour coding. The dark red colour indi-
cropping bedrock is signified by an absence of inter- cates a substrate slope of at least 10°. The substrate in
preted nodes. The survey track lines are shown in the broad area surrounding the channels is character-
black. Bedrock is evident throughout the entire ized by having a very gentle slope. These gently
length of both survey lines; mostly as sub-crop but sloping areas are shaded green. Channel margins
outcropping bedrock is common. The maximum are very well defined on the substrate slope map,
overburden thickness on line 138 is 17.8 m and showing up as yellow and red shading. The substrate
19.7 m on line 141. There is a correlation between slope angles along the channel margins, while well
overburden thickness and bathymetry on Figure 7c defined, are for the most part moderately sloping,
with greatest thickness occurring under the greatest with localized steep slopes. Channel margins with
water depths. Deepest water depths also coincide slopes of less than 10° are typical but localized
with topographic lows in the bedrock horizon. slopes greater than 20° are found within the area.
Digital imagery (Fig. 9) of the sub-bottom pro- The northern margin of Channel 1 contains the steep-
filer lines infers that bedrock forms the base unit of est slope angles and is best defined. Maximum slope
each survey line. Sub-bottom line 138 (Fig. 9a) has angles of over 20° are observed. Figure 8b is the sub-
a clearly defined bedrock horizon. Between the top strate slope map for Channels 2 and 3 and their sur-
of bedrock and base of the Quaternary is an uncon- rounds. Channel 2 is better defined than Channel 3 in
formity. Bedrock outcrops in two distinct sections terms of slope angles along channel margins. Chan-
on the northern half of the line. The bedrock is nel 3 margins are almost all less than 10° but slope
unconformably overlain by unconsolidated sedi- angles greater than 10° are evident along Channel
ments. This unit contains a number of internal reflec- 2 margins. Maximum slope angles of over 15° are
tors. It is the topmost unit except where bedrock found along Channel 2.
outcrops. Sub-bottom line 141 (Fig. 9b) shows In summary, INFOMAR hydrographic and geo-
the bedrock unconformity surface to be rugged in physical regional mapping surveys carried out in
character. The digital imagery also shows that the an area of the Celtic Sea, known to be an important
bedrock is unconformably overlain by the uncon- fisheries ground for Nephrops (Marine Institute
solidated sedimentary unit. This unit forms two 2009), observed large-scale channel seafloor features
large infills separated by outcropping bedrock. The on the multibeam and sub-bottom profiler data.
maximum thickness of the soft sediment unit is Analysis of sub-bottom profiler data acquired within
almost 20 m. Several internal reflectors are present Channels 1 and 2 shows unconsolidated sediments
within this unit. Sub-bottom line 280 (Fig. 9c) indi- with a maximum thickness of over 19 m and spora-
cates the top of bedrock surface on this profile is dic bedrock outcrop. The unconsolidated sediments
smoother in character than that of the previous two unconformably overlie bedrock. Multibeam bathy-
analysed profiles. Bedrock only outcrops near the metry data from Channels 1 and 2 indicate that
northern end of the profile and it is unconformably water depths exceed 120 m. Channel 3 is shallower,
overlain by an unconsolidated sedimentary unit else- attaining a maximum depth of 106 m. Relief from
where. This sedimentary unit attains a maximum channel tops to channel seafloor exceeds 30 m in
thickness of over 7 m. Sporadic internal reflectors places. Multibeam backscatter data show that the
are present in the unit. The sub-bottom line 281 pro- majority of channel substrate sediments exhibit a rel-
file (Fig. 9d) shows that bedrock outcrops at the atively low-intensity backscatter. Preliminary
southern end and in several locations along the inspection of grab samples from Channels 1 and 2
profile. The bedrock horizon is rather smooth, simi- shows that mud and sandy mud sediment composi-
lar to the adjacent profile 280. The unconsolidated tions are dominant. Substrate slope analysis indicates
sedimentary unit attains a maximum thickness of that the channel seafloors have predominantly gentle
over 9 m. slopes. Channel 1 margins show widespread slopes
The channel substrates appear as relatively low- of 10° or more and occasionally slopes of over 20°
intensity backscatter returns (Fig. 6). These low- are found. Channel 2 margins are mostly less than
intensity backscatter returns coincide with smooth 5° but slopes of over 10° are also noted. SlopesDownloaded from http://sp.lyellcollection.org/ by guest on April 7, 2021
R. O’Toole et al.
observed in Channel 3 are very gentle, mostly less can be gridded to produce comprehensive visualiza-
than 5° and its margins are less well defined than tions of seafloor features that can be used for both
Channels 1 and 2. qualitative and quantitative analysis (Guinan et al.
In conclusion, Nephrops are a common commer- 2009). Furthermore, these mapping endeavours pro-
cial species in the Celtic Sea, occurring in geograph- vide the ideal baseline data for any sediment
ically distinct sandy/muddy substrates where the dynamic study when coupled with repeated surveys
sediment is suitable for them to construct their bur- over the same area at different instances in time.
rows. VMS data from fishing vessels have histori- The understanding of how sediment moves over a
cally been used to determine the geographical continental shelf has critical relevance due to our
extent of the fishery, but in recent years the knowl- continuous interaction with and exploitation of the
edge generated through the interpretation of MBES marine environment (EU 2014). The evaluation of
backscatter and associated sediment data is being the overall sediment volume and its physical charac-
used to redefine this extent. This has improved the teristics is important for managing economic
efficiency and validity of the stock assessment and resources such as aggregates (Alder et al. 2010).
helped target new areas for underwater video tows, Equally important is our ability to monitor temporal
which are an essential part of the stock assessment. and spatial sediment movement since this has docu-
The analysis presented here demonstrates how the mented implications for many sectors such as ship-
composition of the seafloor and its associated ping, dredging (Knaapen and Hulscher 2002; Dorst
geomorphological and sedimentological properties et al. 2013) and management of coastal areas under
may be characterized and interpreted over regional normal and extreme hydrodynamic conditions (Sta-
scales using state-of-the-art seabed mapping technol- neva et al. 2009). These implications extend further
ogy and software processes resulting in an enhanced in the context of a developing renewable-energy sec-
understanding of the features and structure of Ire- tor where mobile sediments may pose a risk to
land’s continental shelf and the generation of knowl- renewable energy infrastructure through their inter-
edge to support the blue economy. actions on the seabed (Thiébot et al. 2015).
Comparing repeat surveys can be used to mea-
sure sediment movement from kilometre- to
Case study 3: mapping the mobile seabed of centimetre-scale and to reveal changes in surficial
Ireland’s north coast; a source of risk for sediment composition through MBES backscatter
locating potential renewable energy sites data (e.g. Németh et al. 2002; Ma et al. 2014). Addi-
tionally the above-mentioned measurements can be
Around the world, large sediment waves are still used to validate hydrodynamic simulations of
poorly understood seabed features despite being rel- water movement, often utilized to provide informa-
atively common in many shelf seas (Knaapen and tion about near-seafloor flow velocities (Sheng and
Hulscher 2002; Morelissen et al. 2003; Thiébot Yang 2010; Young et al. 2011; Feldens et al. 2012).
et al. 2015). Early attempts in the 1970s and 1980s In Ireland, very large sediment waves, capable of
to describe sediment movement on European conti- reaching heights of 30 m and able to migrate tens of
nental shelves relied largely on the interpretation of metres per year have been documented, in particular
side-scan sonar data (Kenyon and Stride 1970) and in the Irish Sea (Evans 2018) and around the Inisho-
the analysis of bedform asymmetry to determine wen peninsula (Fig. 10). This case study uses bathy-
transport potential and direction (Belderson et al. metry acquired during the INSS in 2004 and
1982). More recently, thanks to the advent of new INFOMAR in 2013 to focus on an area between
technologies such as MBES sensors coupled with the north Irish coast and Scotland, where underwater
improvements in GPS positioning, highly detailed morphologies vary widely from shallow platforms
investigations on sediment transport have been con- near the coastline in c. 20 m water depths to deep
ducted on continental shelves globally, in particular troughs up to c. 100 m as depicted in Figure 10.
thanks to large-scale national mapping initiatives Here strong hydrodynamic conditions have the
such as the INSS and the INFOMAR programmes potential to facilitate vast renewable-energy devel-
(Feldens et al. 2012; Denny et al. 2013). opment, but the presence of mobile sediments
The INFOMAR programme places a strong make this challenging unless sediment transport
emphasis on the acquisition of high-resolution mechanisms are well understood.
bathymetry data derived from MBES mapping sys- Baseline bathymetric data collected by both map-
tems to high degrees of horizontal and vertical accu- ping initiatives display a range of bedforms includ-
racy so that the resulting information meets ing large sediment waves, barchan dunes and
international hydrographic standards to support gravel waves, all with a range of amplitudes and
safe navigation of shipping (IHO 2008). The benefit crest morphologies (Evans et al. 2015; Fig. 10).
of adhering to these standards for measuring water Exposed bedrock, known to be Palaeoproterozoic
depth is that the resulting bathymetric data products granitic gneiss, is also present in the NE of the areaDownloaded from http://sp.lyellcollection.org/ by guest on April 7, 2021
Mapping coastal, shelf and deep-water environments
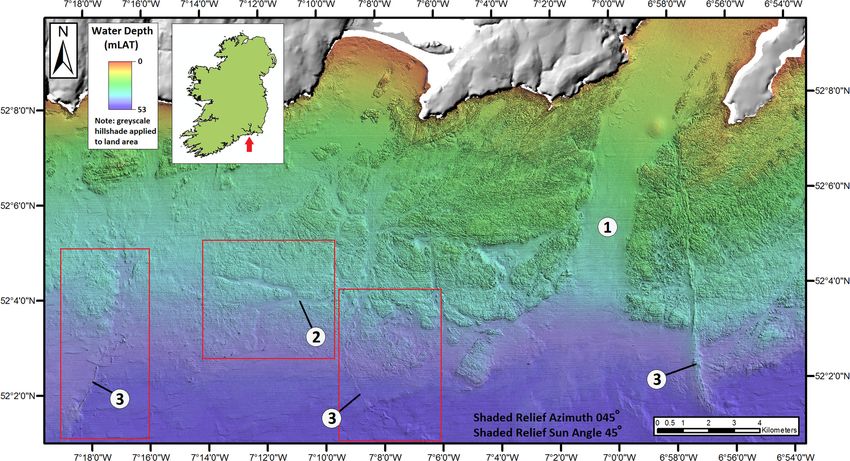
Fig. 10. Overview of study area selection. The sediment waves are clearly visible on the regional bathymetric grids.
To the west of the area, sea current energies south of Inishtrahull are some of the highest in Irish waters (.2 m s−1,
Rourke et al. 2010). Potential renewable energy sites are indicated (Rourke et al. 2010).
and forms part of the Inishtrahull Island rock com- boundaries. The use of multiple repeat surveys has
plex (Fig. 10) (Muir et al. 1994). also highlighted oscillation of sand waves at a spatial
Nine years after the original INSS survey, a joint scale longer than their wavelengths. This suggests the
collaboration between INFOMAR and Ulster Uni- need for shorter time intervals between successive
versity resurveyed these sites in light of future surveys and improved spatial data resolution for
marine plans for the development of renewable both hydrodynamic conditions and sediment distri-
energy infrastructure. The resulting high accuracy bution to improve the validity of inferences made
time-lapse bathymetric data were used to measure regarding sediment transport. In summary, the
horizontal and vertical changes in bedform dimen- study provides useful knowledge that will have to
sions. The analysis of multibeam backscatter and be taken into account for any future offshore develop-
sediment data enabled development of a better ment plans in the area and the results will also hold
understanding of sediment distribution, sediment relevance for other areas identified for the potential
wave composition and allowed inferences on the development of offshore renewable energy in Ireland
forces necessary to initiate and sustain sediment (DCENR 2014).
transport. All this information was then used in cor- In conclusion, comparison of repeat bathymetric
relation with existing hydrodynamic models to surveys from the INSS and INFOMAR programmes
examine the driving forces of sediment mobility in over a nine-year window highlights the advantages
this region. The results of this study indicate that of acquiring a high-precision baseline seafloor data-
the investigated area has highly mobile sediments set where subsequent repeat survey activity can be
with distinct migration directions controlled by used to measure changes in seafloor properties with
local hydrodynamic conditions (Fig. 11). a high degree of confidence. The study shows how
Initial findings indicate that sediment transport is geomorphological analysis of MBES-generated
not linear across the site with crest displacement fol- data provides further insight into the behaviour of
lowing a clockwise, rotational movement. Despite sedimentary bedforms within the study area. Analy-
the features being highly mobile, surface difference sis of high-precision MBES data coupled with con-
models also suggest that there has not been consider- temporary hydrodynamic models also allows for
able loss of sediment from the bedform over the nine- inferences to be drawn in terms of sediment dynam-
year lapse, adding weight to the assumption that ics, bedform boundaries and the likely requirements
while a bidirectional current is in effect across the for repeat surveys necessary for a comprehensive
bedform, hydrodynamic reworking of the sediment monitoring campaign within the study area. This
remains mostly confined within the bedform knowledge is particularly beneficial in the contextDownloaded from http://sp.lyellcollection.org/ by guest on April 7, 2021
R. O’Toole et al.
(Judge 2015) specifically under the remit of work
package 4 (WP4): Sea-floor Geology and Geomor-
phology. The Federal Institute for Geosciences and
Natural Resources, Germany (Bundesanstalt für
Geowissenschaften und Rohstoffe, BGR) coordi-
nated WP4, creating and sharing work-package
guidelines and technical documentation to steer pro-
ject partners with respect to the preparation of harmo-
nized, standardized data that adhere to Infrastructure
for the Spatial Information in Europe (INSPIRE)
standards. The ensuing 1:250 000-scale map of Ire-
land’s offshore geology represents the first attempt
to characterize the pre-Quaternary stratigraphy off-
shore Ireland (Fig. 12).
For the purpose of this mapping exercise, pre-
Quaternary is defined as the bedrock present directly
beneath any Quaternary cover. The area mapped, as
defined by EMODnet Geology, represents Ireland’s
EEZ with an additional 75 km buffer zone. The
map has been produced by consolidating available
Irish topographical and geological information into
one map. The 1:5 Million International Geological
Map of Europe and Adjacent Areas (IGME 5000)
map and data were used as an initial baseline dataset
(Asch 2005). The IGME 5000 map was completed
by the IGME 5000 project comprising 40 European
and adjacent countries. The project produced a geo-
logical database that includes information on pre-
dicted geology offshore Ireland.
INSS and INFOMAR high-resolution MBES
data define the bathymetry of the specified area at a
resolution of 111 m. These data were used in tandem
with the IGME 5000 predictive mapping of Ireland’s
offshore geology to constrain many of the obvious
morphological seabed features and larger geomor-
phological provenances. Ireland’s sedimentary
Fig. 11. Example of ‘flow accumulation’ data where
zero values represent crest (a). Digitized crests from the basins and troughs, highs and the Porcupine seabight
2004 (blue) and 2013 (red) surveys shows the illustrated in Figure 1 are realized by the INSS data-
displacement of sediment waves crests in a nine-years’ set. Large intrusive features of magmatic origin
time lapse (b) (Evans 2018). Surface difference terrain including seamounts and dykes are also identified
model derived comparing the 2004 v. the 2013 in the bathymetric data. While these kinds of features
bathymetry grids (c). Faded red indicates area where exhibit a geomorphological expression in the bathy-
sediment has accumulated while faded blue are areas metry, much of the pre-Quaternary bedrock geology
with sediment deficit. Grey indicates areas with of offshore Ireland lies buried beneath overlying
minimal sediment mobility.
marine sediments. Correlation of these geomorpho-
logical features identified within the bathymetry
of evaluating prospective renewable energy sites for data with available geological data, geophysical
suitability and risk, where the ability to identify and studies and the baseline IGME 5000 map formed a
monitor specific sedimentary seafloor features from key part of the interpretative process leading to the
seafloor mapping data may help with future site development of Ireland’s offshore geology map in
selection or guide design solutions for infrastructure Figure 12.
associated with offshore renewable energy devices. The geology of Ireland, as illustrated on the GSI’s
1:100 000 bedrock map of Ireland (GSI 2012)
Case study 4: mapping Ireland’s offshore defines the boundaries of terrestrial lithological
units. Geological units mapped along the coastal
geology zone that show obvious expression offshore on high-
The offshore geology map of Ireland has been resolution bathymetry, have been extrapolated out to
compiled for the EMODnet Geology project sea. Due to the request from the EuropeanDownloaded from http://sp.lyellcollection.org/ by guest on April 7, 2021
Mapping coastal, shelf and deep-water environments
Fig. 12. Ireland’s Offshore Geology Map (1: 250 000 scale), Coordinate Reference System: WGS84 (EPSG code: 4326).Downloaded from http://sp.lyellcollection.org/ by guest on April 7, 2021
R. O’Toole et al.
Commission that EMODnet datasets adhere to interpreted geological and geophysical data describe
INSPIRE standards; the nomenclature of onshore a chronological narrative that lends context to the
geology units mapped with national geological major geomorphological features we observe off-
nomenclature and stratigraphic units are transformed shore Ireland. Detailed Irish data and observations
in accordance with the INSPIRE vocabulary. These have most recently been incorporated into the first
vocabulary define a standardized approach to map- regional systematic compilation and coordinated
ping lithological unites, stratigraphic age, event interpretation of the NE Atlantic for the NAGTEC
environments and all relevant information recorded project (Hopper et al. 2014). Marine geological and
in the data attribution fields. geophysical datasets were used to build regional
For inshore waters, outcrops, boundaries and models and publish a comprehensive tectonostrati-
faults evident on the high-resolution bathymetry graphic atlas. The NAGTEC Atlas describes in detail
datasets guide the digitization of coastal geological the most recent interpretation of the evolution of
units. In deeper water, structural datasets are avail- the NE Atlantic and its conjugate margin pairs. It rep-
able principally due to extensive research and publi- resents a comprehensive reappraisal of historical
cation over the past three decades, largely fuelled by studies in the NE Atlantic from the earliest plate tec-
petroleum potential. Research and publications on tonic studies. Understanding of how the NE Atlantic
deep water (greater than 200 m) areas offshore Ire- region and its continental margins hold unique
land have focused on the crustal structure, tectono- information is important for many aspects of Earth
stratigraphy, sedimentary development, volcanic science, from global geodynamics, palaeoceano-
province and petroleum potential. Information graphy and environmental change (Péron-Pinvidic
gleaned from these publications has been incorpo- et al. 2017).
rated to further constrain the pre-Quaternary out- The overall seabed surface morphology offshore
cropping geology of Ireland’s offshore EEZ. A Ireland as illustrated by the PAD, INSS and INFO-
comprehensive literature review of previous work MAR bathymetric datasets, summarized in Figure 1,
has been conducted and elements of this work are vastly improved knowledge and understanding for
incorporated into the offshore geology map and the detail of Ireland’s continental shelf and Atlantic
summarized here. margin by allowing for a detailed visualization of
Information detailed in boreholes (Haughton large-scale seabed features and structures (Dorschel
et al. 2005), dredge samples (Tyrrell et al. 2013), et al. 2010). At the westernmost edge of European
INSS-acquired sub-bottom profiles, seismic profiles continent, this region has been affected by multiple
(Naylor and Shannon 2005) and deep-towed side- orogenic episodes throughout geological history
scan sonar (PIP 2004) are used to interpret, identify (Naylor and Shannon 2011). The broad continental
or track lithological units beneath Quaternary shelf (greater than 350 km) surrounding Ireland is
cover. Petroleum Affairs Division (PAD) and Petro- wide by mean-world standards. Gravity and mag-
leum Infrastructure Programme (PIP) seismic pro- netic data demonstrate that the Moho beneath Ire-
files (Morewood et al. 2005; O’Reilly et al. 2006) land lies 30 km below the terrestrial surface
as well as GSI gravity and magnetic data are summa- (Brock et al. 1991). The continental platform sur-
rized by research endeavours including the Rockall rounding Ireland connects the Irish landmass with
Studies Group (Readman et al. 1997; Rockall Stud- Europe to the east and slopes gently westward
ies Group 1998; Hopper et al. 2014). Combining the from terrestrial Ireland to the edge of the shelf
interpretations from these sources allows for reason- break. Along the shelf water depths are in excess
able educated assumptions of outcrop types, where of 300 m and here the seabed is generally devoid
other robust ground-truth samples were not avail- of major bathymetric features; it has a curved and
able. This material formed the basis of geological linear shelf edge (Naylor and Shannon 1982). The
edits performed on the baseline IGME 5000 dataset shelf edge is defined by steep cliffs that are incised
that ultimately resulted in the 1:250 000 map of by large canyon systems. Large steep canyons drop
Ireland’s offshore geology (Fig. 9). off from continental shelf depth of mean 350–
Offshore potential field data, refraction and 4500 m over a mean distance of 30 km, for all
reflection profiles, and well data (Brock et al. but the Porcupine Basin where the Porcupine Sea-
1991; Shannon 1991; Naylor et al. 1999, 2002; Res- bight etches a more gradual incision into the shelf
ton et al. 2001; Stoker et al. 2005; O’Reilly et al. edge descending from shelf edge to abyssal plane
2006; Shannon et al. 2007) provide a comprehensive over hyperextended crust. Along the Porcupine
account of the deep geology of Ireland and its conti- Basin’s axis stretching factors (the factor by
nental margin. This contextual information describes which the lithosphere has been thinned) increase
multiple episodes of tectonism through Phanerozoic southward deduced from subsidence data for Mid-
time (Naylor and Shannon 2011), including failed dle to Late Jurassic rifting (Tate et al. 1993).
rifting and subsequent break-up that ultimately Such lithospheric thinning characteristics are nor-
resulted in the opening of the Atlantic. These mally associated with the highly thinned crustYou can also read