Assessment of the global mobile broadband deployments and forecasts for International Mobile Telecommunications - Report ITU-R M.2243
←
→
Page content transcription
If your browser does not render page correctly, please read the page content below

Report ITU-R M.2243
                                (00/2011)

Assessment of the global mobile
   broadband deployments and
     forecasts for International
    Mobile Telecommunications

                               M Series
  Mobile, radiodetermination, amateur
          and related satellite services
ii Rep. ITU-R M.2243
Foreword
The role of the Radiocommunication Sector is to ensure the rational, equitable, efficient and economical use of the
radio-frequency spectrum by all radiocommunication services, including satellite services, and carry out studies without
limit of frequency range on the basis of which Recommendations are adopted.
The regulatory and policy functions of the Radiocommunication Sector are performed by World and Regional
Radiocommunication Conferences and Radiocommunication Assemblies supported by Study Groups.
Policy on Intellectual Property Right (IPR)
ITU-R policy on IPR is described in the Common Patent Policy for ITU-T/ITU-R/ISO/IEC referenced in Annex 1 of
Resolution ITU-R 1. Forms to be used for the submission of patent statements and licensing declarations by patent
holders are available from http://www.itu.int/ITU-R/go/patents/en where the Guidelines for Implementation of the
Common Patent Policy for ITU-T/ITU-R/ISO/IEC and the ITU-R patent information database can also be found.
Series of ITU-R Reports
(Also available online at http://www.itu.int/publ/R-REP/en)
Series Title
BO Satellite delivery
BR Recording for production, archival and play-out; film for television
BS Broadcasting service (sound)
BT Broadcasting service (television)
F Fixed service
M Mobile, radiodetermination, amateur and related satellite services
P Radiowave propagation
RA Radio astronomy
RS Remote sensing systems
S Fixed-satellite service
SA Space applications and meteorology
SF Frequency sharing and coordination between fixed-satellite and fixed service systems
SM Spectrum management
Note: This ITU-R Report was approved in English by the Study Group under the procedure detailed in
Resolution ITU-R 1.
Electronic Publication
Geneva, 2012
ITU 2012
All rights reserved. No part of this publication may be reproduced, by any means whatsoever, without written permission of ITU.
Rep. ITU-R M.2243                                                                       1

                                                    REPORT ITU-R M.2243

         Assessment of the global mobile broadband deployments and forecasts
                    for International Mobile Telecommunications1

                                                                                                                                              (2011)

                                                       TABLE OF CONTENTS
                                                                                                                                               Page

Overview ..................................................................................................................................       2

1        Introduction ....................................................................................................................        3

2        Traffic and user penetration information of existing mobile broadband deployments
         (until 2011) .....................................................................................................................       6
         2.1        Global IMT traffic from 2006 to 2011 ...............................................................                          6
         2.2        Global IMT subscriber information from 2006 to 2011 .....................................                                     7

3        Trends contributing to increased demand for mobile broadband ...................................                                         8
         3.1        New type of devices, such as smart phones, dongles, tablets .............................                                     8
         3.2        Mobile Internet usage is increasing ....................................................................                     10
         3.3        Huge increase of mobile software application offerings (Apps) ........................                                       10
         3.4        Video traffic is growing dramatically .................................................................                      10
         3.5        Media rich social networks go mobile ................................................................                        10
         3.6        Machine-to-machine traffic is growing and expanding to new applications ......                                               11
         3.7        More capable network – user experience improvement .....................................                                     11
         3.8        Cost reduction and price decrease ......................................................................                     12
         3.9        Several policy initiatives to promote mobile broadband ....................................                                  12
         3.10       Potential area to increase data traffic ..................................................................                   12
         3.11       Broader user-age demographics and its impact on traffic growth ......................                                        13

4        Mobile broadband forecasts up to 2020 and beyond ......................................................                                 13
         4.1        Reviewing the previous ITU market forecast study ...........................................                                 13
         4.2        Mobile data traffic forecast .................................................................................               15

1   Certain information in this Report is based upon material with the indicated publication/availability dates
    and does not necessary reflect published changes to these materials that might have occurred subsequent
    to the preparation date (19 October 2011) of this Report.
2                                                         Rep. ITU-R M.2243

                                                                                                                                            Page

5       Conclusions ....................................................................................................................      17

Abbreviations ...........................................................................................................................     19

Annexes

A1      List of related ITU-R Recommendations and ITU-R Reports .......................................                                       20

A2      Detailed information of existing mobile broadband implementation.............................                                         22

A3      Detailed information on usage and application trends of mobile broadband .................                                            45

A4      New mobile broadband forecasts ...................................................................................                    69

A5      Various measures to respond to increased mobile broadband traffic .............................                                       81

A6      International, regional and national mobile broadband initiatives .................................                                   84

Overview
This Report reviews both the market and traffic forecasts for International Mobile
Telecommunications (IMT) that were developed in previous study periods (extending from
2000-2007) and assesses the current perspectives and future needs of mobile broadband that would
be supported by IMT over the next decade (2012-2022). It also presents new traffic forecasts
provided by a number of industry sources for the forecast up to 2015 and one source for the forecast
between 2015 and 2020 taking into account new market trends and market drivers.
See also relevant portions of reports from the UN Broadband Commission2 as appropriate.
Figure 1 below indicates the fixed and mobile broadband penetrations in percentages for different
regions of the world. Most notable is Africa where fixed broadband is virtually non-existent and yet
mobile broadband is growing. The Americas in Figure 1 includes North, Central and South
America.

2   Recognizing the importance of mobile broadband, the ITU and UNESCO announced in May 2010 the
    establishment of UN Broadband Commission for digital development which will define strategies for
    accelerating broadband rollout worldwide and examine applications that could see broadband networks
    improve the delivery of a huge range of social services, from healthcare to education, environmental
    management, safety and much more. (See http://www.broadbandcommission.org).
Rep. ITU-R M.2243                                           3

                                                  FIGURE 1
                               Fixed and mobile broadband penetration in 20103

              Per 100 inhibitants
         45                                                               41.3
         40
                       Mobile Broadband
         35
                       Fixed Broadband
         30
                                                                                 23.8   24.1
         25

         20
                                                                                           14.1
         15
                             10.2                            11.2
         10                                 7.5                     8.3
                                                  5.5
          5     2.5                 1.9
                      0.2
          0
                 Africa     Arab States      Asia &           CIS*         Europe         The
                                             Pacific                                    Americas

                * CIS: Commonwealth of Independent States

New types of mobile devices, such as smartphones and tablets, and new user behaviours have
emerged. These developments were not foreseen in the last study period (before WRC-07), though
it appears these trends will continue into the future.
Application stores for various mobile platforms have created a large new market. The use of
mobile Applications has increased mobile broadband traffic significantly and would still increase it
dramatically.
According to the various new forecasts, it is indicated that global mobile data traffic in the year
2015 would be much higher than the traffic in the year 2010 and this growth according to one
source is estimated to continue to be strong between 2015 and 2020.
Based on the study of global mobile broadband deployments and forecasts for IMT, this Report
clearly indicates that the ITU-R should consider this increasing mobile broadband traffic demand in
the next study period.
In this report, at several places, there are statistics and information relating to the development of
IMT which may indicate the situation in specific geographical regions, geographical locations,
and/or group of countries. These statistics should not be considered reflecting the actual situation in
other geographical regions, geographical locations, and/or group of other countries.

1        Introduction
Mobile communications including mobile broadband communications have been playing very
positive roles in economic and social developments of both developed and developing countries.
Over the past 25 years, the ITU has been coordinating the development of global broadband mobile

3   Source: ITU World Telecommunication/ICT Indicators Database.
4                                          Rep. ITU-R M.2243

telecommunication system and due to these efforts on IMT technologies, there has been successful
and impressive growth of mobile communications and we see also the early uptake of mobile
broadband.
IMT encompasses both IMT-2000 and IMT-Advanced collectively based on Resolution ITU-R 56.
IMT-2000 provides access by means of one or more radio links to a wide range of
telecommunications services supported by the fixed telecommunications networks
(e.g. PSTN/Internet) and other services specific to mobile users.
Since the year 2000, IMT-2000 has been continuously enhanced and. IMT-2000 Recommendation
ITU-R M.1457 has been updated continuously. Some new features and technologies were
introduced to IMT-2000 which enhanced its capacity.
International Mobile Telecommunications – Advanced (IMT-Advanced) is a mobile system that
includes the new capabilities of IMT that go far beyond those of IMT-2000 and also has capabilities
for high-quality multimedia applications within a wide range of services and platforms providing
a significant improvement in performance and quality of current services. IMT-Advanced systems
support low to high mobility applications and a wide range of data rates in accordance with user and
service demands in multiple user environments. Such systems provide access to a wide range of
telecommunication services including advanced mobile services, supported by mobile and fixed
networks, which are generally packet-based.
As of February 2011 there are globally 5.3 billion mobile subscriptions amongst the planet’s
6.9 billion people. Globally, it is estimated that 3.7 billion people out of the total of 6.9 billion
people are connected and can be instantly in touch with each other at home, in the office or during
travel. Also, more than 90% of the world’s population is under the coverage of mobile networks,
which compared with the global Internet penetration of 30%, represents a huge potential for mobile
broadband to become a major access enabler to Internet.
According to the ITU Statshot Issue 7, August 2011,4 in 2010, almost 100 economies had mobile
cellular penetration over 100% – and 17 economies5 had penetration rates above 150% as depicted
in Figure 2.

4   ITU Statshot Issue 7, August 2011, see http://www.itu.int/net/pressoffice/stats/2011/03/index.aspx.
5   From the same source in above footnote, the 17 economies are: Anguilla, Finland, Maldives, Kuwait, St
    Kitts & Nevis; Oman, Russia, Suriname, Libya, Vietnam, Cayman Islands, Antigua & Barbuda, Panama,
    Montenegro, Saudi Arabia, Hong Kong (China) and Macao (China).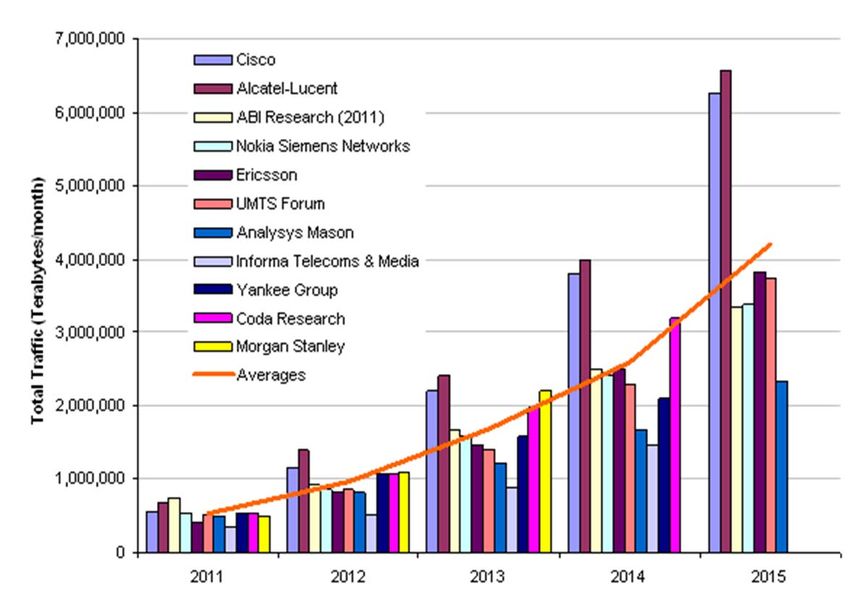
Rep. ITU-R M.2243                                          5

                                                FIGURE 2
                                 Mobile penetration for various economies

                           (Source: ITU Statshot Issue 7, August 2011)

In some developing countries, the broadband access to the Internet is performed via mobile
networks such as IMT. This type of internet access is spreading very fast. IMT services and
applications are opening up new opportunities for connectivity and services, e.g. location based
services will assist consumers to be aware of local circumstances and use that information to their
benefit.
The mobile broadband manufacturing industry is continuously evolving towards more efficient
radiocommunication technologies, coupled with an all-IP open Internet network architecture.
Through innovations like beam forming antenna systems, interference mitigation, multiple and
aggregated carriers, power control, repeaters and scheduling schemes, etc., efficiency of spectrum
usage has been achieved. Although some of these enhancements in the IMT radiocommunication
technologies are enabling operators to further increase their capability and capacity within their
operating spectrum, it is foreseen that these new demands, especially, for much higher bit rate
service, will require additional actions in the future, further leading to reduced costs to achieve
greater affordability.
6                                         Rep. ITU-R M.2243

2           Traffic and user penetration information of existing mobile broadband deployments
            (until 2011)

2.1         Global IMT traffic from 2006 to 2011
Since WRC-07, the demand for mobile data services has grown significantly, with a reported 522%
increase in total worldwide mobile data traffic between 2008 and 20106 as illustrated in Figure 3.
This is placing increasing pressure on mobile networks to accommodate the continued growth in
demand for services.

                                                   FIGURE 3
                                  Global mobile traffic during years 2008-2010

By 2010 mobile data traffic was three times the volume of the entire global internet traffic in the
year 20006. The dramatic increase has been driven by new services enabled by new devices and
business models; most notable was mobile video traffic which grew to 50% of all mobile data
traffic by 20107.
The current growth rates of mobile data traffic resemble those of the fixed network from 1997
through 2001, when the average yearly growth was 150%. In the case of the fixed network, the
growth rate remained in the range of 150% for 5 years6. The top 1% of mobile data subscribers
generate over 20% of mobile data traffic, down from 30% one year ago. Mobile data traffic has
evened out over the last year and now matches the 1:20 ratio that has been true of fixed networks
for several years. Similarly, the top 10% of mobile data subscribers now generate approximately
60% of mobile data traffic, down from 70% at the beginning of the year8 .

6   Cisco Visual Networking Index: Global Mobile Data traffic Forecast Update 2010–2015 (2011) available
    at http://www.cisco.com/en/US/solutions/collateral/ns341/ns525/ns537/ns705/ns827/white_paper_c11-
    520862.html.
7   Ibid.
8   Ibid.
Rep. ITU-R M.2243                                          7

Additionally, smart phones represent only 13% of total global handsets in use today, but they
represent over 78% of total global handset traffic. In 2010, the typical smart phone generated
24 times more mobile data traffic (79 MB per month) than the typical basic-feature cell phone
(which generated only 3.3 MB mobile data traffic per month)9.

2.2          Global IMT subscriber information from 2006 to 2011
As of February 2011 there are globally 5.3 billion mobile subscriptions amongst the planet’s
6.9 billion people and more than 1.2 billion10 people among the global population are connected via
3G network (18% penetration). Figures 4 and 5 depict both mobile subscriptions worldwide and
active mobile broadband subscriptions, respectively11. Annex 2 provides more detailed information
for existing mobile broadband implementation.

                                                      FIGURE 4
                                           Mobile subscriptions (worldwide)

             3000     millions

             2000

             1000

                0
                         2005        2006           2007           2008           2009       2010
                    Africa   Arab States     Asia & Pacific       CIS         Europe   The Americas

9    Ibid.
10   The 1.2 billion number is the sum of 677M global WCDMA subscriptions (including HSPA) from the
     UMTS Forum, http://www.umts-forum.org/: and 561M CDMA2000 (including EV-DO) from the CDMA
     Development Group, http://www.cdg.org/.
11   ITU, Key ICT indicators for developed and developing countries and the world (totals and penetration
     rates), available at webpage http://www.itu.int/ITUD/ict/statistics/at_glance/KeyTelecom2010.html,
     October 2010 and definition of the terms can be found at webpage http://www.itu.int/ITU-
     D/ict/handbook.html.
8                                             Rep. ITU-R M.2243

                                                      FIGURE 5

                              Active mobile broadband subscriptions (millions) per region

        350

        300

        250
                                                                                            Afri ca

        200                                                                                 Arab States
                                                                                            Asi a & Paci fi c
        150
                                                                                            CIS

        100                                                                                 Europe
                                                                                            The Ameri cas
          50

            0
                    2007            2008              2009             2010

3          Trends contributing to increased demand for mobile broadband

3.1        New type of devices, such as smart phones, dongles, tablets
A wide range of enhanced devices that incorporate cellular connectivity have entered the market
during the past three years, including smartphones, USB dongles, tablets, e-book readers and
gaming consoles. These devices offer larger screen sizes and high resolution and hence increase
data consumption and encourage the use of traffic-intensive applications such as video calling.
As a result, these devices have been a key driver of increased mobile broadband traffic.
Smartphones
In 2008, basic mobile voice phones accounted for 70% of total traffic (1 319 Petabytes (PB)
per year) while in 2010, smart phones represent 13% of total global handsets in use, but they
represent over 78% of total global handset traffic and an average smart phone generated
significantly more mobile data traffic (79 Mb per month) than the basic-feature mobile phone.
Touch-screen smartphones (launched from around 2007) have been a key driver of mobile data
traffic growth, offering users the ability to browse standard websites on their mobile device for the
first time. The volume of smartphone data carried by cellular networks is growing very rapidly,
driven predominantly by increases in device penetration, but also by increases in average usage12

12   A significant proportion of smartphone traffic is generated indoors; accordingly, we estimate that between
     80% and 90% of this traffic is routed over Wi-Fi and fixed broadband networks (included here in the data
     supplied).
Rep. ITU-R M.2243 9
In developed markets, a smartphone generates about 50 times more data per month than a basic
phone13. This includes all data generated and consumed by the device – including that offloaded
onto a Wi-Fi network. For example, in Western Europe a smartphone generates 73 MB of data
traffic per month, compared to an average of 1.22 MB per month for a basic phone, which equates
to a ratio of 60:1 for the two device types.
In absolute terms the volume of traffic generated by smartphones remains small compared to tablets
and laptops. One notable development will be 3D displays, which is anticipated to become well
established on smartphones by 2013 and it is estimated that these 3D smartphones could generate
many times more traffic than established user applications.
Connected devices
A wide range of new, connected devices, including tablets, e-readers and gaming devices, have
emerged in the last three years and are already beginning to have an impact on mobile traffic
volumes. A tablet generates as much as 500 times the data traffic of a basic mobile phone14.
For example, in Western Europe a tablet generates a total of 740 MB per month compared to
1.22 MB per month for a basic phone.
Other device developments
Table 1 provides an overview of other technology developments that are set to increase user
demand for mobile data:
TABLE 1
Technology developments that are set to increase user demand for mobile data
Development Remarks
Virtualisation Could enable users to partition one mobile phone into two separate devices – for
example, to create a virtual business phone on a personal smartphone (or vice versa).
This could reduce the cost of smartphone ownership by negating the need to purchase
secondary devices, and thus drive take-up.
Multitasking The ability to run multiple applications concurrently, including the possibility of using
multiple frequency bands simultaneously.
Introduction The introduction of graphical processing units (GPUs) will enhance the performance of
of GPUs video applications and thus promote mobile video consumption. The overall user
experience of such applications is currently limited by network capacity.
Introduction The introduction of multiprocessor units (MPUs) will replace standalone GPUs and,
of MPUs mobile along with virtualisation, is expected to reduce handset costs.
cloud The demand for mobile cloud services is expected to grow since the users are
increasingly adopting more services that are required to be accessible. These services
require synchronisation of data across multiple devices with a centralised storage access
in the cloud.
13 Analysis Mason (UK, 2010).
14 Ibid.10 Rep. ITU-R M.2243 3.2 Mobile Internet usage is increasing Basically, people expect and would like to use any Internet application on their mobile devices in the same manner as they do in fixed connection. Additionally, mobile devices enable new applications such as location based services. Mobile Internet took off in 2007 and by 2009; there were 95 million mobile Internet users in Europe and 55 million mobile Internet users in USA. The recent take-up of smart phones, which is tailored for mobile Internet experience, is also a key driving force in the significant development of the mobile Internet market. Most mobile broadband systems are extensions of the Internet services and focused on entertainment. In February 2011, more than 90% of the world’s population was under the coverage of mobile networks which, compared with the global Internet penetration of 30%, represents a huge potential for mobile broadband to become a major access enabler to Internet. For the majority of people in developing countries, the first access to the Internet is performed via mobile broadband networks using IMT technologies in most instances. This continuous and seamless mobile connection is enabled by small and capable mobile terminals using IMT Technologies or PCs with dongles and tablets. This type of Internet access via mobile terminals is spreading very rapidly. 3.3 Huge increase of mobile software application offerings (Apps) Between 2008-2010 alone, over 300,000 mobile Apps have been developed for smartphones. The most used mobile Apps are games, news, maps, social networking, music and more recently medical Apps. Many stakeholders are now offering mobile Apps through commercial online stores and application stores for various mobile platforms and thus have created a large new market, with an estimated 11 billion downloads by February 2011. It is estimated that global downloads will reach 77 billion in 2014 and will be worth US $35 billion. The majority of mobile Apps are planned with the assumption that users are online and connected, consequently increasing mobile broadband traffic. 3.4 Video traffic is growing dramatically Mobile video generally refers to real time entertainment consumption of video streaming, generic Flash video and other various webcasting. By year 2010, YouTube and Flash have generated the majority of mobile video traffic. However video sharing has also emerged as a new way to consume audiovisual content, and has particularly been adopted by fixed Internet users. For many viewers, consuming a video no longer just means watching it, but also sharing it with their community, commenting on it, blogging about it, tagging it, etc. This is why the online video market is largely dominated by community-based sites. Moreover, uploading videos on one’s social networking profile is also becoming a way to share video. Hence, community networks (like Facebook) are also video viewing sites. For the coming years, video will be responsible for most mobile data traffic growth through streaming or downloading with a cumulative average growth rate (CAGR) exceeding 100% between 2009 and 2014 and it is predicted that video will account for 66% of mobile data traffic by 2014. 3.5 Media rich social networks go mobile Since the middle of the last decade, social networks have seen ever-intensifying usage explosion, huge traffic growth and a greater portion of online time devoted to them. They represent a mass- market phenomenon, with almost 70% of Internet users worldwide visiting a social network
Rep. ITU-R M.2243                                           11

(July 2009). Out of the 770 million people who logged onto an online community that month
(up 18% compared to the previous year), almost half visited Facebook.
The role of social network sites is evolving rapidly from their informal, chat-based roots. They are
now used for a host of applications, from breaking global news, product marketing and political
campaigning to the coordination of natural disaster relief.
On the mobile networks, social networking is experiencing a surging popularity akin to that seen on
the fixed networks and is for the time being among the fastest growing mobile applications.
According to Allot, Facebook increased its traffic consumption by 200% during the first half of
2010 while Twitter grew by 310% in the same timeframe. This growth can be explained by easy
access to such services through smart phones but also the ability to access the services at any time:
users with mobile Facebook applications installed on their smart phones are twice as active as the
average Facebook user. In April 2010, it is estimated that more than 75% of smart phone users
accessed social network sites. In the future it is expected that social networking applications will
continue to drive mobile data consumption.
Also, the impact of social network applications on mobile network traffic is increasing. For example
in UK, half of mobile web traffic is from Facebook use. On the other hand, the integration of
location-based functions with social networks can lead to new applications on mobile networks that
will generate lots of mobile data traffic.

3.6     Machine-to-machine traffic is growing and expanding to new applications
The next big wave to increase the mobile data demand will be machine-to-machine (M2M)
applications and devices, and M2M is expected to be one of the fastest growing segments.
The growth of the M2M market has been driven by markets such as fleet management, industrial
asset management, point of sales, security and healthcare. The amount of M2M connections could
be several orders of magnitude larger than the world population.
In terms of traffic, the M2M share will depend on related applications. For instance, smart utility
meters dedicated to equip homes consume some hundreds of kilobytes/sec while surveillance video
monitoring will consume tens of Megabytes/sec.
In addition, new applications such as Animal-Machine (A-M), Human-Machine (H-M),
and Animal-Humans (A-H) are very likely to add more traffic. These applications are either in
development or early stages of introduction and therefore their impact on data traffic is unknown.
Some of the machine-to-machine traffic may be asymmetric more towards uplink than downlink
e.g. in on-line security closed circuit television (CCTV) camera uploads to server, wireless sensor
networks, animal to human etc. Traffic requirements for such usage may also differ in timing and
geographical location, which may have a lesser impact on network.
In the future, agricultural sciences would benefit vastly from the ability to communicate information
remotely. Veterinary sciences, controlling the spread of pestilence/disease in crops and animal
husbandry are all likely to gain from this development.

3.7     More capable network – user experience improvement
The introduction of new high-bit rate mobile networks from 2007 onwards has increased service
bit-rates and improved reliability. This has led to enhanced mobile broadband user experience as for
example users can view more internet pages in less time. The difference between user experience in
the mobile environment and fixed (cable) environment is not that big anymore as mobile networks
can offer high user bit-rates.
The introduction of IMT-Advanced networks will also provide better user experience by having
substantially reduced latency and have the potential to provide multi-player gaming on the network.
12                                         Rep. ITU-R M.2243

These networks and devices will also provide better and equitable experience in cell edge and
interfering environment by having enhanced interference mitigation and/or cancellation techniques.
This will also provide better signal strength using co-ordinated multipoint (CoMP) to provide
multi-cast services.

3.8       Cost reduction and price decrease
With innovative technologies, both capital and operational expenditures of mobile network
operators could be lowered. A next generation wireless network could further enhance data traffic
capacity and network flexibility while reducing an operator’s total costs for network deployment
and operation. With the cost reduction, operators may offer affordable prices to subscribers with
various choices. For instance, a flat-rate mobile data service, in which the user pays a single fixed
monthly fee for virtually all the data access they want is already one of driving forces in several
countries to increase data traffic.

3.9       Several policy initiatives to promote mobile broadband
The industry has been working on mobile broadband technologies for over a decade and with the
current supportive administrations approach, the mobile broadband services are expanding the
benefits to all. Many administrations are promoting mobile broadband with their national broadband
plans (see Annex 6).
To realize these national plans, United Nations (ITU/UNESCO)15 mention that a new vision is
needed of reduced regulatory burdens, innovative incentives and coordinated efforts by all links
in the broadband value chain, in order to unleash opportunities for commercial deployments.

3.10      Potential area to increase data traffic
The demand for mobile cloud services is expected to grow exponentially since the users are
increasingly adopting more services that are required to be accessible. The consequence is that the
volume of mobile content they generate cumulatively grows. Multimedia services captured on
mobile devices will overwhelmingly carry the greatest cloud computing and storage demand and
the average size of these media files will grow substantially as camera pixel resolution continues to
increase (ARC Chart16 predicts that mobile-generated content will consume 9,400 PB of cloud
services by 2015).
It is expected that e-health, e-education and other e-government services will also be accessed by
mobile devices, which will contribute to improvements in social welfare.
Furthermore, cloud services are getting a lot of attention since, among other benefits, they save
costs for enterprises. These cloud services require guaranteed data communication between the
clients and the connected data centres hosting IT servers. As the number of mobile users connecting
through the mobile network to the cloud increase, the mobile data traffic will continuously grow.
As mobile software applications advance due to increasing processing power, mobile data traffic is
expected to increase.

15   See the ITU and UNESCO’s Broadband Commission for Digital Development Report “Broadband: A
     Platform for Progress”. Available: http://www.broadbandcommission.org/report2.pdf.
16   ARC Chart Research Report on the mobile cloud: Market analysis and forecasts, June 2011.
Rep. ITU-R M.2243 13
3.11 Broader user-age demographics and its impact on traffic growth
The age of the users and consequently the way of using Internet has changed over the last years,
resulting in an increasing demand. There are two main streams which can be manifested:
– The age of the users is extending at both ends of the human live-cycle: more and more
elderly people have started using the Internet and the younger generation is getting
educated to the Internet through school and kindergarten at a very young age.
– In particular the new, younger generation is using the Internet for pre-school games, online
education, net-homeworking for learning and studying more.
Annex 3 addresses this trend with some specific figures based on one country. It is worthwhile to
note that although the figures do not show people below the age of 15, the importance of this group
is increasing dramatically.
4 Mobile broadband forecasts up to 2020 and beyond
4.1 Reviewing the previous ITU market forecast study
Figure 6 summarises the previous study period (2003-2007) activities done by ITU-R in order to
achieve the vision of IMT on Recommendation ITU-R M.1645, targeting to identify IMT spectrum
at WRC-07.
FIGURE 6
Overview of earlier ITU-R studies (2003-2007)
Report ITU-R M.2072 Recommendation ITU-R M.1768
Report ITU-R M.2074
Future services/ Spectrum
Future technology
estimation
Market analyses assumptions
methodology
Resolution
Spectrum ITU-R 56 (RA-07)
Spectrum calculations (tool)
survey Name:
IMT-Advanced
Spectrum requirements
Candidate Report ITU-R M.2078 Spectrum
bands sharing studies
Report ITU-R M.2079 Reports ITU-R M.2109,
Proposal for WRC-07
M.2110, M.2111, M.2112,
Draft CPM text CPM Report
M.2113, M.2116
Resolution ITU-R 57 (RA-07) - Principles
WRC-07: WRC-07 Final Acts
ITU Radio Regulations (Edition of 2008)
2008-2011: Development of standards for IMT-Advanced14 Rep. ITU-R M.2243
Figure 6 also shows that there were three main areas of activity for studies performed between 2003
and 2007; on the left of the figure are the market analyses, forecasts and status of spectrum, on the
right-hand side of the figure are the technical analyses, and the centre of the figure shows the
activities that brought it all together starting with a spectrum estimation methodology and the
calculations that considered the market analyses and technology forecasts. Various documents that
were prepared, but are not formal ITU-R publications such as the spectrum survey and the spectrum
estimation tool, are available online17.
Report ITU-R M.207218 provides market and traffic forecasts which were created based on the
various contributions from administrations and organizations in response to the Questionnaires
(Circular Letter CACE/326). Report ITU-R M.2072 also provides market related parameters with
their values. The findings of Report ITU-R M.2072 were based on internal and external studies to
the year 2020 as well as detailed data on the traffic forecasts in different parts of the world.
Contributions submitted towards Report ITU-R M.2072 included forecasts for different regions and
areas; from global forecasts, to individual countries. There was not a direct correlation between all
of the submitted forecasts, so from a global perspective of Report ITU-R M.2072 actually reported
a range of estimates.
Prior to WRC-07, Report ITU-R M.2078 calculated spectrum requirement estimates (a lower and
higher market settings) based on the data in Report ITU-R M.2072 and other sources19 referred to in
that report. In Figure 7 below, the range of the forecast for global traffic represented by Report
ITU-R M.2072 is depicted by the blue area. Also included for comparison are the actual traffic
figures (brown line) from the CISCO Report, as well as that report’s forecast (red line).
17 http://www.itu.int/ITU-R/index.asp?category=study-groups&rlink=estimate-spectrum&lang=en.
18 “World mobile telecommunication market forecast”, (2005).
19 There was one aggressive estimate “The demand for future mobile communication markets and services
in Europe (FMS)”, http://fms.jrc.ec.europa.eu/pages/about.htm, but it used different units and was based
on regional information; therefore, it is not easy to compare it to other estimates in Report ITU-R M.2072.Rep. ITU-R M.2243 15
FIGURE 7
ITU traffic estimates done at year 2005 (Report ITU-R M.2072)
The global estimates from Report ITU-R M.2072 (2005) were quite conservative taking into
account the actual mobile traffic rise from 2007 to 2010. It should be noted that the actual data
traffic is many times greater (more than 5) than some of the estimates in Report ITU-R M.2072.
Moreover, the actual traffic being experienced by the operators today is even greater than some of
the forecasts in Report ITU-R M.2072 for the year 2020.
One Report ITU-R M.2072 forecast also anticipated that in 2015 data traffic would be equal to
voice traffic for the first time, but, in reality, the proportion of traffic from mobile data already
exceeded mobile voice in 2009.
4.2 Mobile data traffic forecast
Having seen the trends identified in previous section, there are several forecasts of global data
traffic as depicted in Figure 8.
This figure illustrates a range of forecasts which have been published from various multiple external
sources, and the average curve which results from this set of individual forecasts. For many
sources, forecasts in Figure 8 are based on the most up-to-date reports which were updated over the
time span between the end of 2010 and May 201120.
20 Cisco Visual Networking Index: Global Mobile Data Traffic Forecast Update, 2010-2015.16 Rep. ITU-R M.2243
FIGURE 8
Mobile global data traffic estimates from 2011 to 2015 based on multiple sources
It can be seen from Figure 8 that there are some similarities in short term estimates, but variations in
the long term forecasts. Some discrepancies are related to different assumptions assumed in each
forecasts.
Based on existing mobile broadband growth and new trends, several new traffic estimates,
as depicted in Figure 8 from multiple sources, have been concluded which forecast extensively
more mobile broadband traffic compared to estimates done before WRC-07.
Moreover, when looking at the traffic forecasts over the next decade, one source (UMTS Forum)21
anticipates total mobile traffic of more than 127 Exabytes (EB) in 2020 that represents a 33 times
increase compared with 2010 figures.
According to the same source, Asia will represent 34.3% of total world mobile traffic while Europe
and The Americas (including North, Central and South America) represent 22% and 21.4%,
respectively as depicted in Figure 9.
21 UMTS Forum Report: Mobile Traffic forecasts: 2010-2020, Report 44, January 2011.Rep. ITU-R M.2243 17
FIGURE 9
Regional traffic forecasts for 2020
Finally, when looking deeper into the future beyond 2020, the same source anticipates global
mobile traffic of 350 EB in 2025 (worldwide) representing a 174% increase compared to 2020.
However, it should be noted that the 2025 forecasts here are given in order to show mobile traffic
trends, but that the model used was designed for 2010-2020. Given this uncertainty this information
should be considered as informative only at this stage.
5 Conclusions
Mobile communications including mobile broadband communications have been playing important
roles in the economic and social developments of both developed and developing countries, such as
growth of economy, mitigation of digital divide, improvement of life quality, and facilitation of
other industries. Rapid uptake of smart phones, tablets and innovative mobile applications created
by users has resulted in a tremendous increase in the volume of mobile data traffic which was not
foreseen before WRC-07. The current data traffic (in year 2010) is more than 5 times greater than
some of the estimates for Report ITU-R M.2072. Moreover, the actual traffic being experienced by
some operators today (year 2011) is even greater than some of the 2020 forecasts given in Report
ITU-R M.2072.
Developing countries will also play an important role in the next period, due to their large markets
and relatively low deployment levels of IMT up until now. With the introduction of higher
capability networks and enhanced devices, even more user friendly interfaces will emerge to make
mobile applications more generally accessible.18 Rep. ITU-R M.2243
New traffic forecasts are provided by a number of industry sources for the forecast up to 2015 and
one source for the forecast between 2015 and 2020 taking into account new market trends and
market drivers.
This Report reviews both the market and traffic forecasts for IMT that were developed in previous
study periods (2000-2007) and assesses the current perspectives of the future needs of mobile
broadband to be supported by the IMT for the next decade (2012-2022).
Based on the study of global mobile broadband deployments and forecasts for IMT, this Report
clearly indicates that the ITU-R should consider this increasing mobile broadband traffic demand.
The following 6 Annexes are attached to this document:
Annex 1 List of related ITU-R Recommendations and ITU-R Reports
Annex 2 Detailed information on existing mobile broadband implementations
Annex 3 Detailed information on usage and application trends of mobile
broadband
Annex 4 New mobile broadband forecasts
Annex 5 Various measures to respond to increased mobile broadband traffic
Annex 6 International, regional and national mobile broadband initiativesRep. ITU-R M.2243 19
Abbreviations
ACMA Australian Communications and Media Authority
App / Apps (Software) Application/-s
BS Base station
CA Carrier aggregation
CAGR Cumulative average growth rate
CCTV Closed circuit television
CoMP Coordinated multi point
eICIC Enhanced inter cell interference coordination
GDP Gross domestic product
GPU Graphical processing unit
HSDPA High speed data packet access
HSPA High speed packet access
IMT International Mobile Telecommunication
ISDN Integrated services digital network
M2M Machine-to-machine
MIMO Multiple input multiple output
MPU Multi processor unit
RATG Radio Access Technology Group
RFID Radio frequency identification
WRC World Radio Conference
PSTN Public switched telecommunications network
UGC User generated content
UN United Nations20 Rep. ITU-R M.2243
Annex 1
List of related ITU-R Recommendations and ITU-R Reports
Recommendation ITU-R M.687: International Mobile Telecommunications-2000 (IMT-2000)
Recommendation ITU-R M.816: Framework for services supported on International Mobile
Telecommunications-2000 (IMT-2000)
Recommendation ITU-R M.819: International Mobile Telecommunications-2000 (IMT-2000)
for developing countries
Recommendation ITU-R M.1034: Requirements for the radio interface(s) for International
Mobile Telecommunications-2000 (IMT-2000)
Recommendation ITU-R M.1457: Detailed specifications of the terrestrial radio interfaces of
International Mobile Telecommunications-2000 (IMT-2000)
Recommendation ITU-R M.1645: Framework and overall objectives of the future development
of IMT-2000 and systems beyond IMT-2000
Recommendation ITU-R M.1768: Methodology for calculation of spectrum requirements for the
future development of the terrestrial component of IMT-2000
and systems beyond IMT-2000
Recommendation ITU-R M.1801: Radio interface standards for broadband wireless access
systems, including mobile and nomadic applications, in the
mobile service operating below 6 GHz
Recommendation ITU-R M.1822: Framework for services supported by IMT
Draft new Recommendation ITU-R M.[IMT.RSPEC]: Detailed specifications of the terrestrial radio
interfaces of International Mobile Telecommunications – Advanced (IMT-Advanced). [Editor’s
note: This Recommendation is still under the approval process].
Report ITU-R M.2040: Adaptive antennas concepts and key technical aspects
Report ITU-R M.2072: World mobile telecommunication market forecast
Report ITU-R M.2074: Radio aspects for the terrestrial component of IMT-2000 and
systems beyond IMT-2000
Report ITU-R M.2078: Estimated spectrum bandwidth requirements for the future
development of IMT-2000 and IMT-Advanced
Report ITU-R M.2079: Technical and operational information for identifying
Spectrum for the terrestrial component of future development
of IMT-2000 and IMT-Advanced
Report ITU-R M.2109: Sharing studies between IMT-Advanced systems and
geostationary satellite networks in the fixed-satellite service in
the 3 400-4 200 and 4 500-4 800 MHz frequency bands
Report ITU-R M.2110: Sharing studies between radiocommunication services and
IMT systems operating in the 450-470 MHz band
Report ITU-R M.2111: Sharing studies between IMT-Advanced and the radiolocation
service in the 3 400-3 700 MHz bandsRep. ITU-R M.2243 21
Report ITU-R M.2112: Compatibility/sharing of airport surveillance radars and
meteorological radar with IMT systems within the
2 700-2 900 MHz band
Report ITU-R M.2113: Sharing studies in the 2 500-2 690 MHz band between
IMT-2000 and fixed broadband wireless access systems
including nomadic applications in the same geographical area
Report ITU-R M.2116: Characteristics of broadband wireless access systems
operating in the land mobile service for use in sharing studies22 Rep. ITU-R M.2243
Annex 2
Detailed information of existing mobile broadband implementation
A2.1 Introduction
This Annex is covering some detailed information on current mobile implementations including
information on subscriptions and infrastructure, penetration of subscriptions, traffic information on
data and voice, growth and coverage on a regional and country basis.
Some particular detailed information to take notice of is that with regard to current mobile
implementations, as of mid-2011 there are globally about 6 billion mobile subscriptions and at the
end of 2010 there were almost 4 billion mobile cellular subscriptions in the developing world.
A2.2 Global information on mobile broadband implementations
Subscriptions, as of mid-2011 there are globally about 6 billion22 mobile subscriptions amongst the
planet’s 6.9 billion people. At the end of 2010 there were almost 4 billion mobile cellular
subscriptions23 in the developing world with active SIM cards. Globally, it is estimated that
3.7 billion people out of the total of 6.9 billion people are connected to the global network meaning
that they are connected all the time and can be instantly in touch with each other at home, in the
office or during travel. The number of IMT users is strongly growing in the regions of Asia-Pacific,
Europe and North America. In other part of the world, e.g., in Africa, most of the new broadband
users are IMT user, although the absolute number is not so high. In August 2011 1.535 billion24
people among the global population of 6.9 billion people are connected via IMT mobile broadband
networks.
Penetration, in February 2011 IMT broadband systems had achieved 18% user penetration globally.
LTE network migration is being initially driven by operators in Western Europe and
North America, which account for a combined 70%25 of global LTE connections in 2010.
Traffic, at mid-2010, there were already more than 5 billion mobile users worldwide (excluding the
machine-to-machine (M2M) market) as shown in the Figure A2.1 below.
22 GSA/Informa Telecoms & Media 5.214 billion (GSM, HSPA and LTE), CDG 738 million (cdma2000
and EV-DO) and WiMAX 20 million.
23 ITU Statshot http://www.itu.int/net/pressoffice/stats/2011/03/index.aspx.
24 UMTS Forum 799 million and CDG 738 million = 1.535 billion on 2011-08-15.
25 GSMA.Rep. ITU-R M.2243 23
FIGURE A2.1
Mobile subscriptions and mobile density (worldwide)
As more and more users are connected via mobile communication systems, the traffic also grows
very fast in recent years exponentially. By 2010 mobile data traffic was three times the size of the
entire global internet in 200026, 27. The dramatic increase was driven by new services enabled by
new devices and business models; most notably was mobile video traffic which grew to 50% of all
mobile data traffic by 201026.
“The current growth rates of mobile data traffic resemble those of the fixed network from 1997
through 2001, when the average yearly growth was 150%. In the case of the fixed network, the
growth rate remained in the range of 150% for 5 years”. The global mobile data traffic report
referred in the above text also states that “The top 1% of mobile data subscribers generates over
20% of mobile data traffic, down from 30% one year ago. According to a mobile data usage study
conducted by Cisco, mobile data traffic has evened out over the last year and now matches the
1:20 ratio that has been true of fixed networks for several years. Similarly, the top 10% of mobile
data subscribers now generate approximately 60% of mobile data traffic, down from 70% at the
beginning of the year26”.
Additionally, “Smartphones represent only 13% of total global handsets in use today, but they
represent over 78% of total global handset traffic. In 2010, the typical smartphone generated
24 times more mobile data traffic (79 Mb per month) than the typical basic-feature cell phone
(which generated only 3.3 Mb per month of mobile data traffic)26.
26 Cisco Visual Networking Index: Global Mobile Data traffic Forecast Update 2010–2015 (2011) available
at http://www.cisco.com/en/US/solutions/collateral/ns341/ns525/ns537/ns705/ns827/white_paper_c11-
520862.html.
27 Global mobile data traffic in 2010 (237 Pb per month) was over three times greater than the total global
Internet traffic in 2000 (75 Pb per month); Cisco Sys.24 Rep. ITU-R M.2243
TABLE A2.1
Global Internet traffic and mobile data traffic growths
FIGURE A2.2
3G users, by Quarter/region (Source: Informa)
1,000,000,000,000
Total Traffic (MB pa)
900,000,000,000
Simple Voice
800,000,000,000 Messaging
Browsing
700,000,000,000 Location Based
M-Commerce
600,000,000,000
Images/personalistion
500,000,000,000 Games
Music
400,000,000,000 Video
300,000,000,000 Gambling
Mobile Office
200,000,000,000 Mobile Workforce
Business Email
100,000,000,000
VoIP
-
2,007 2,008 2,009 2,010
Growth, driven by the maturation of IMT, the number of deployed IMT-2000 networks continues to
grow, and increases rapidly in recent years. In the last 3 years, more licenses for IMT-2000 were
issued. Today the coverage of IMT networks has expanded to a similar level of second generation
(2G) networks. In Figure A2.3 below, for the 2G and IMT-2000 (often referred to as third
generation, 3G) the number of new licenses by year are shown.Rep. ITU-R M.2243 25
FIGURE A2.3
2G/3G number of new licenses by
300
No. of new 3G licenses
No. of new 2G licenses
250 No. of accumulated 2G&3G licenses (after 2003)
200
150
100
50
0
2003 2004 2005 2006 2007 2008 2009
Year
In Figure A2.4 below, the IMT users in different regions and countries are shown on a quarterly
basis between the years 2008 and 2010.
FIGURE A2.4
IMT users, by quarter per region
250,000,000
200,000,000
Africa
150,000,000 Americas
Asia Pacific
Europe
100,000,000 Middle East
USA/Canada
50,000,000
0
Q2
Q3
Q4
Q1
Q2
Q3
Q4
Q1
08
08
08
09
09
09
09
10
20
20
20
20
20
20
20
2026 Rep. ITU-R M.2243
Coverage, more than 90%28 of the world’s population is under the coverage of mobile networks,
which compared with the global Internet penetration of about 30%29 represents a huge potential for
mobile broadband to become a major access enabler to Internet. For the majority of people in
developing countries, the first and only access to the Internet is performed via an IMT network.
This type of internet access is spreading very fast.
The latest IMT technologies are capable of providing theoretical connection speed ranging between
3.6 Mbps and 100 Mbps, with authentic measurements using commercial devices in different
places, in at least one metropolitan area showed an average downlink speed of 41.5 Mbps, which is
on par with DSL type wired networks.
The total IMT population coverage has increased over recent years but is heterogeneous, depending
on the country. Indeed, the first areas with mobile broadband coverage were cities where the density
of population is highest. Other areas are now being covered and refarming enable operators to use
the bands below the frequency 1 GHz, which provides properties for larger cell radius than the
bands around the frequency 2 GHz.
A2.3 Regional specific information, Region 1
Europe
Subscriptions and infrastructure, when the issue of mobile service spectrum for IMT was
considered by WRC-07, there were less than 30 million UMTS/HSPA connections in Europe.
Today (January 2011) there are 115 million. According to wireless intelligence, relevant figures on
HSPA and LTE-network deployments:
− There are currently 147 HSPA networks in Europe, including 40 HSPA+ networks.
− There are already 15 live LTE networks.
Penetration, the following Table A2.2 provides a summary of user penetration of mobile broadband
(penetration as percent of the total population) can be drawn:
28 https://communicationsdirectnews.com/do.php/100/41984?7649: “UN Report Finds Global Mobile
Coverage at More Than 90%” (October 20, 2010).
29 http://www.internetworldstats.com/stats.htm.Rep. ITU-R M.2243 27
TABLE A2.2
Mobile broadband user penetration
Country User penetration (%) Notes (Response from questionnaire)
Andorra 5.4 4 500 users
Austria 15.4 1 291 000 mobile broadband users in Q4/2009
Croatia 6.4 289 000 mobile broadband users by mid-2010
Cyprus 1.1 1.1% in January 1st 2010
Czech Rep. 3.5 3.53% in December 2009
Denmark 29.6 1 636 000 subscriptions end 2009
Estonia 19 active Mb users = 18% - 19% Q1 2010
Finland 17 908 000 users on 31/12/2009
France 39 24.4 million active multimedia customers on 30/06/2010
Germany 23.2 19 millions in 2009
Iceland 6.2 19 755 out of 317 630 end of year 2009
Ireland 12 540,546 in Q3 2010
Latvia 17.6 391 000 in January 2010
Malta 15.1 62 345 on 01/2010
Netherlands 30.8 4 594 000+533000 in December 09
Poland 6.4 2 460 105 mobile broadband subscriptions by 30.06.2010
Portugal 19.5 By 15.02.2010
Russia 6 By 15.10.2010
Slovak Rep. 5 Approx. 5 %.
Sweden 63 From http://www.statistik.pts.se/pts2009/index.html
Switzerland 23 1 813 700 users on 31/12/2008
NOTE 1 – ‘.’ denotes the integer/decimals separator, i.e. 1.5 TB = 1 500 GB.
NOTE 2 – Some difference between countries is due to the fact that the definition of mobile
broadband differs country by country.
The evolution of the mobile broadband user penetration is indicated in the Figure A2.5 in
percentage of the total population.28 Rep. ITU-R M.2243
FIGURE A2.5
Evolution of mobile broadband user penetration
NOTE 1 − The definition of mobile broadband changed in Sweden and therefore the temporary
decline in Swedish penetration curve.
NOTE 2 − Some difference between countries is due to the fact that the definition of mobile
broadband differs country by country.
Traffic, in 2010, a Questionnaire to CEPT Administrations related to mobile broadband
deployments was done in order to gather information in terms of traffic statistics and mobile
broadband penetration rates. In responses received in CEPT Questionnaire, there were some
variations of definition of mobile broadband. Also, there were some variations related to the unit
used with received information; for example, instead of per subscriptions, responses indicated
traffic (and penetration) per subscriber, per customer or per connection. This also can lead to some
slight variation in figures.Rep. ITU-R M.2243 29
TABLE A2.3
Mobile broadband total traffic statistics per country (per month)
Country Total Traffic (TB/month) Notes (Response from questionnaire)
Germany 2 792 33.5 million Gb in 2009
Sweden 2 787 (893 000 × 2 622 + 418 000 × 1 065) Mb/month
Netherlands 2 339 2 339 794 000 Mb in December 09
Austria 1 667 5 000 000 Gb in Q4/2009
Finland 1 667 10 000 TB in H2 2009
Denmark 771 4 626 million Mb in H2 2009
Ireland 660 602 379 +57 626 Gb/month in Sept. 09
Portugal 199
Slovak Rep. 121 5% penetration, 15 Mb per subscription per day
Switzerland 58 701 715 000 000 kilobytes in 2008
Estonia 41 123 million Mb in Q1 2010
Croatia 31
Russia 27 October 2010; the data is only relevant to UMTS in 2.1 GHz
Iceland 19 224 017 299 Mb in 2009
Malta 7 83 924 Gb in 2009
Andorra 0 42 218 360 000 Bytes/bonth
NOTE 1 − 1 TB (Terabyte) =1 000 GB (Gigabyte) =8 000 Gbits.
NOTE 2 − Traffic is rounded to the nearest integer.
FIGURE A2.6
Evolution of mobile broadband traffic30 Rep. ITU-R M.2243
In order to get the daily traffic per subscription, the overall country traffic has to be calculated per
day. Then that has to be divided by the amount of mobile broadband subscriptions. Table A2.4
depicts daily traffic statistics per county:
TABLE A2.4
Mobile broadband daily traffic statistics (from 2009-2010)
Country Mobile broadband traffic per day
Sweden 61 MB
Finland 61 MB
Hungary 45 MB
Denmark 43 MB
Austria 42 MB
Ireland 42 MB
Iceland 31 MB
Estonia 18 MB
Croatia 16 MB
Slovak Republik 15 MB
Germany 4.8MB
Netherlands 2.3MB
NOTE 1 − Traffic is rounded to the nearest integer.
There is a lot of variation between CEPT countries, depending on several issues e.g. pricing
(flat rate) offers from operators. Also, there were some variations of definition of Mobile
Broadband and variations related to the unit used with received information. TeliaSonera released
figures on data use on their networks in November 2010. These TeliaSonera figures benchmark
closely to other user figures from around the world showing:
− An average smartphone user consumes upward of 375 MB of data per month
12.5 MB/day.
− 3G modems use an average of 5 Gb of bandwidth per month 167 MB/day.
− LTE user are consuming 15 Gb of data per month 500 MB/day.
Other information, the following has been reported publicly by operators:
− The CEO of one major international operator has confirmed that the amount of data traffic
is set to grow by a factor of 10 in the next 2 years30.
30 Orange CEO, Stephane Richard, reported in NamNews 10/12/2010, speaking at Le Web conference in
Paris, “he said mobile internet traffic will increase ten-fold in the next two years due to the increased sales
of smartphones using Google's operating system Android”.You can also read