How Transparency Can Help the Middle East and North Africa - WORLD BANK MIDDLE EAST AND NORTH AFRICA REGION MENA ECONOMIC UPDATE APRIL 2020
←
→
Page content transcription
If your browser does not render page correctly, please read the page content below

WORLD BANK MIDDLE EAST AND NORTH AFRICA REGION
MENA ECONOMIC UPDATE APRIL 2020

How Transparency
Can Help the
Middle East and
North Africa

WORLD BANK MIDDLE EAST AND NORTH AFRICA REGION

MENA ECONOMIC UPDATE APRIL 2020

How Transparency Can Help the Middle
East and North Africa
2020 International Bank for Reconstruction and Development / The World Bank
1818 H Street NW, Washington DC 20433
Telephone: 202-473-1000; Internet: www.worldbank.org
Some rights reserved
1 2 3 4 23 22 21 20
This work is a product of the staff of The World Bank with external contributions. The findings, interpretations, and conclusions
expressed in this work do not necessarily reflect the views of The World Bank, its Board of Executive Directors, or the governments they
represent. The World Bank does not guarantee the accuracy of the data included in this work. The boundaries, colors, denominations,
and other information shown on any map in this work do not imply any judgment on the part of The World Bank concerning the legal
status of any territory or the endorsement or acceptance of such boundaries.
Nothing herein shall constitute or be considered to be a limitation upon or waiver of the privileges and immunities of The World
Bank, all of which are specifically reserved..
Rights and Permissions

This work is available under the Creative Commons Attribution 3.0 IGO license (CC BY 3.0 IGO) http://creativecommons.org/licenses/
by/3.0/igo. Under the Creative Commons Attribution license, you are free to copy, distribute, transmit, and adapt this work, including
for commercial purposes, under the following conditions:

Attribution—Please cite the work as follows: Arezki, Rabah; Lederman, Daniel; Abou Harb, Amani; El-Mallakh, Nelly; Fan, Rachel
Yuting; Mohammed Islam, Asif; Nguyen, Ha; Zouaidi, Marwane. 2020. “How Transparency Can Help the Middle East and North
Africa.” Middle East and North Africa Economic Update (April), Washington, DC: World Bank. Doi: 10.1596/978-1-4648-1561-4.
License: Creative Commons Attribution CC BY 3.0 IGO

Translations—If you create a translation of this work, please add the following disclaimer along with the attribution: This translation
was not created by The World Bank and should not be considered an official World Bank translation. The World Bank shall not be
liable for any content or error in this translation.

Adaptations—If you create an adaptation of this work, please add the following disclaimer along with the attribution: This is an
adaptation of an original work by The World Bank. Views and opinions expressed in the adaptation are the sole responsibility of the
author or authors of the adaptation and are not endorsed by The World Bank.

Third-party content—The World Bank does not necessarily own each component of the content contained within the work. The
World Bank therefore does not warrant that the use of any third-party-owned individual component or part contained in the work
will not infringe on the rights of those third parties. The risk of claims resulting from such infringement rests solely with you. If you
wish to re-use a component of the work, it is your responsibility to determine whether permission is needed for that re-use and to
obtain permission from the copyright owner. Examples of components can include, but are not limited to, tables, figures, or images.
All queries on rights and licenses should be addressed to World Bank Publications, The World Bank Group, 1818 H Street NW,
Washington, DC 20433, USA; e-mail: pubrights@worldbank.org.

ISBN (electronic): 978-1-4648-1561-4
DOI: 10.1596/978-1-4648-1561-4
Cover: Billion Photos / Shutterstock
HOW TRANSPARENCY CAN HELP THE MIDDLE EAST AND NORTH AFRICA
Table of Contents
Acknowledgements iv
Abbreviationsv
Prefacevi
Chapter I: The Dual Shocks of the Novel Coronavirus and the Oil Price Collapse 4
I.1 The spread of Covid-19 4
I.2 The Collapse of Oil Prices 6
I.3 Toward a Sequencing of Policy Responses to the Dual Shocks 8
I.4 Quantifying the Effects of the Dual Shocks 9
I.5 MENA’s Chronic Low-Growth Syndrome 14
I.6 Enhancing MENA’s Transparency Can Accelerate Growth 15
Chapter II: External Imbalances, Fiscal Sustainability, and Data Transparency in MENA 20
II.1 Current Account Sustainability 20
II.2 Fiscal Sustainability: Lack of Transparency Obfuscates Existing Methods of Analysis 26
Chapter III: Data Gaps, Definitions, and the Measurement of Labor Market Outcomes 27
III.1 The Measurement of Unemployment in MENA 27
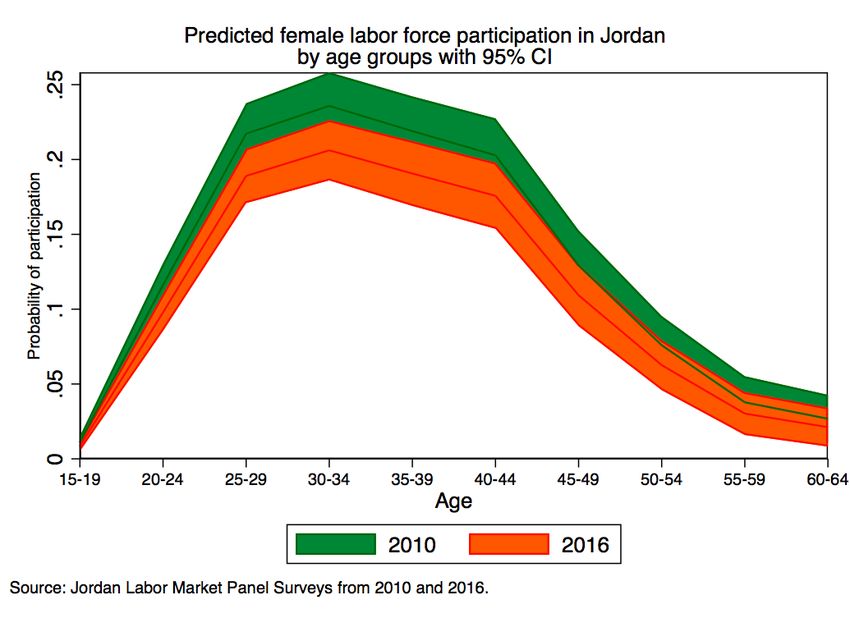
III.2 Female Labor-Force Participation: A Generational Issue 33
III.3 The Missing Piece: Measuring Informality in MENA 38
III.4 Conflict and Female Labor Force Participation 39
Chapter IV. Summary of Findings 41
References42
Appendix 44
Appendix A: Estimating the Relationship between Statistical Capacity and Economic Growth 44
Appendix B: MNACE’s Current Account Model 46
Appendix C: Fiscal Sustainability 50
TABLE OF CONTENTS i
MIDDLE EAST AND NORTH AFRICA REGION ECONOMIC UPDATE APRIL 2020

List of Figures
Overview: How Transparency Can Help the Middle East and North Africa

Chapter I: The Dual Shocks of the Novel Coronavirus and the Oil Price Collapse
       Figure I.1 Negative Supply and Demand Shocks in MENA                                                          6
       Figure I.2 Global Oil Demand Forecasts for 2020                                                               6
       Figure I.3 Brent Oil Price and Futures                                                                        7
       Figure I.4 Rough Calculations of the Income Effect of the Oil-Price Collapse across MENA Economies            7
       Figure I.5 Correlates of the Costs of the Crisis: Growth Downgrades, Oil Export Exposure and Health Security 12
       Figure I.6 Fluid Estimates of the Costs of the Crisis — Changes in World Bank Growth Forecasts               13
       Figure I.7 MENA’s Chronic Low-Growth Syndrome                                                                14
       Figure I.8 Regional Development and Statistical Capacity                                                     17
       Figure I.9 Statistical Capacity Index across MENA                                                            18

Chapter II: External Imbalances, Fiscal Sustainability, and Data Transparency in MENA
       Figure II.1 Unexplained Current Account Balances for MENA countries                                          22
       Figure II.2 The Relationship between Primary Fiscal Balances and Past Debt – MENA and the Rest of the
       World since 1990                                                                                             26

Chapter III: Data Gaps, Definitions, and the Measurement of Labor Market Outcomes
       Figure III.1 Unemployment Rates by Urban and Rural Locations                                                 32
       Figure III.2 Unemployment Rates by Education                                                                 32
       Figure III.3 Unemployment Rates by Age Groups                                                                33
       Figure III.4 Female labor force participation rates                                                          33
       Figure III.5 Predicted Female Labor Force Participation in Egypt by Age Groups                               34
       Figure III.6 Predicted Female Labor Force Participation Rates by Age Groups (GMD)                            34
       Figure III.7 Women’s Educational Attainment by Age Cohorts                                                   36
       Figure III.8 Labor Force Participation Rates in the United States since 1890                                 39
       Figure III.9 Labor Force Participation in Yemen, 1990-2019                                                   39

Chapter IV. Summary of Findings

ii                                                                                                        LIST OF FIGURES
List of Tables
Chapter I: The Dual Shocks of the Novel Coronavirus and the Oil Price Collapse
Table I.1. Standard Deviation of Private-Sector Forecasts for 2020 GDP Growth across MENA Economies 9
Table I.2. Uncertain Forecasts: World Bank’s Growth, Current Account and Fiscal Balance Forecasts 10
Table I.3. Changing Estimates of the Costs of the Crisis: World Bank Growth Forecasts Relative to
October 2019 11
Chapter II: External Imbalances, Fiscal Sustainability, and Data Transparency in MENA
Table II.1. Primary and Structural Fiscal Balances versus Debt-Stabilizing Primary Fiscal Balances in
MENA, 2018 and 2019 24
Table II.2 Debt Reporting in MENA Countries 26
Chapter III: Data Gaps, Definitions, and the Measurement of Labor Market Outcomes
Table III.1. Definitions of Employment and Unemployment from the U.S. BLS, the French INSEE and the ILO 27
Table III.2. Consistency of Employment and Unemployment Definitions across MENA 28
Table III.3. Definitions of Employment and Unemployment 29
Table III.4. Unemployment Rates in Egypt in 2018 30
Table III.5. Unemployment Rates in Jordan in 2016 30
Table III.6. Unemployment Rates in Tunisia in 2014 31
Table III.7. Decomposing the Gap in FLFP Rates between Younger and Older Cohorts 37
Table III.8. Informal Employment in Egypt, Jordan and Tunisia 38
Appendix A: Estimating the Relationship between Statistical Capacity and Economic Growth
Table A1. Macro-economic Loss in GDP due to Statistical Capacity Index Decline in MENA (2005-2018) 45
Table A2. Definitions of the Statistical Capacity Measure 45
Appendix B: MNACE’s Current Account Model
Table B1. Summary Statistics 47
Table B2. MNACE Model Estimates of the Fundamental Drivers of Current Account Balances 49
Appendix C: Fiscal Sustainability
Table C1. The Relationship between Primary Balance and Debt 52
List of Boxes
Chapter I: The Dual Shocks of the Novel Coronavirus and the Oil Price Collapse
Box I.1. Transparency and the Statistical Capacity Index 16
Chapter III: Data Gaps, Definitions, and the Measurement of Labor Market Outcomes
Box III.1. The World Bank’s Global Micro Database and household data for seven MENA countries 35
LIST OF TABLES AND BOXESMIDDLE EAST AND NORTH AFRICA REGION ECONOMIC UPDATE APRIL 2020 Acknowledgements The Middle East and North Africa (MENA) Economic Update is a product of the Office of the Chief Economist for the Middle East and North Africa Region (MNACE) of the World Bank Group. The report was written by Rabah Arezki (Regional Chief Economist), Daniel Lederman (Deputy Chief Economist, Team Leader), Nelly El-Mallakh, Asif Mohammed Islam, Amani Abou Harb, Rachel Yuting Fan, Ha Minh Nguyen, and Marwane Zouaidi. The team received invaluable comments on preliminary results that appear in Chapters II and III from our World Bank MENA macroeconomists—including Kevin Carey and Eric Le Borgne (Practice Managers), Khaled Alhmoud, Sara B. Alnashar, Sona Varma, Bledi Celiku, Damir Cosic, Wissam Harake, Majid Kazemi, Dalia Al Kadi, Naoko C. Kojo, Wael Mansour, Ashwaq Natiq Maseeh, Khalid El Massnaoui, Mamadou Ndione, Harun Onder, Saadia Refaqat, Abdoulaye Sy, Hoda Youssef, and other participants at a technical workshop held on January 21, 2020 in Washington D.C. Subsequently the team received invaluable feedback from Amatalalim Al-Soswa (Sr Consultant, MNACE, World Bank), Robert Bou Jaoude (on behalf of World Bank staff from our Cairo Office), and particularly Johannes Hoogeveen (Practice Manager, EMNPV) who shared academic literature on the link between data transparency and development outcomes. The team is indebted to Najy Benhassine (MENA Regional Director) for his critique of the econometric models presented in this report; Anna Bjerde (MENA Director for Strategy and Operations) for encouraging us to clarify the link between transparency on the one hand and poor fiscal and labor-market outcomes on the other hand; and Ferid Belhaj (MENA, Vice President) for pushing the team to quantify the potential economic costs of lack of transparency. Our Country Directors, Jesko Hentschel, Kanthan Shankar, and Marina Wes demanded deeper and broader analyses of the role of transparency in development and World Bank operations. The authors also gratefully acknowledge the comments and constructive criticism received from other participants in a meeting of the World Bank’s MENA Regional Leadership Team held on March 11, 2020. We thank Swati Raychaudhuri for providing administrative support and James L. Rowe Jr for editing the manuscript. Help from Translation and Printing & Multimedia Unit from The World Bank’s Global Corporate Solutions is acknowledged. Last but not least, Nate Rawlings, Ashraf Al-Saeed, and Radhia Achouri provided editorial assistance on the Overview. Without their constant prodding the report’s messages would have ended up even more murky than they are. All remaining errors and omissions are the authors’ responsibility. iv ACKNOWLEDGEMENTS
HOW TRANSPARENCY CAN HELP THE MIDDLE EAST AND NORTH AFRICA

Abbreviations
BLS             United States Bureau of Labor Statistics
CAPMAS          Egypt’s Central Agency for Public Mobilization and Statistics
CPI             Consumer Price Index
EAP             East Asia and the Pacific
ENCDM           National Survey on Household Consumption and Expenditure
FLFP            Female Labor Force Participation
GCC             Gulf Cooperation Council
GDP             Gross Domestic Product
GHS             Global Health Security Index
GMD             Global Micro Database
HIES            Households Income and Expenditure Survey
IEA             International Energy Agency
ILO             International Labor Organization
ILOSTAT         International Labor Organization Statistics
INSEE           France-Institut Nationale de la statistique et des etudes economiques
IMF             International Monetary Fund
MENA            Middle East and North Africa
MNACE           Middle East and North Africa Chief Economist Office
MPO             Macro and Poverty Outlook
OPEC            Organization of the Petroleum Exporting Countries
PPP             Purchasing Power Parity
SDG             Sustainable Development Goals
SOE             State-owned enterprises
SSA             Sub-Saharan Africa
UAE             United Arab Emirates

ABBREVIAITONS                                                                           v
Preface
As the Coronavirus pandemic sweeps across the Middle East and North Africa (MENA), uncertainty and fear are gripping
the streets. While citizens have turned to their governments to act, decades of lack of transparency has bred distrust
and undermined our State credibility. People cannot be certain if daily reporting and updates are true. As someone
aptly described the leadership response to the Coronavirus: “When you lose people's trust, even when you tell the truth,
people won't believe you.”

As if the spread of a global pandemic during a time of social unrest were not enough, more than any other region of the
world, MENA is confronting two distinct but related shocks. Alongside the spread of the virus, oil prices collapsed, putting
pressure on incomes and fiscal accounts of oil exporters, and indirectly but heavily affecting the developing economies
of the region that rely on worker remittances, foreign direct investment, and transfers from their high-income neighbors
of the Gulf Cooperation Council.

The World Bank Group is committed to helping governments weather the dual shocks with the intention of leaving no one
behind. We have put together a Covid-19 emergency financing facility of 14 billion dollars, and we are working tirelessly
to ramp up our operations in a time of rising financing needs. On March 25, the World Bank Group committed 160
billion dollars when David Malpass presented our plans to our Board of Directors. This will finance support operations
over the next 15 months tailored to the needs of each country, but with a strong poverty focus and an emphasis on
policy-based financing and protecting the poorest households and the environment. In addition, on March 24 the World
Bank and the International Monetary Fund asked for debt relief for the poorest countries, a plea that was repeated in
President Malpass’s statement delivered to the Group of 20 on March 26.

As we fight the spread of the novel virus across the world, policies designed to contain the spread and mitigate its
impact on public health systems, such as the closing of large swaths of the economy, are clearly having at least short
term recessionary consequences with potentially grave social costs beyond the deterioration of public health. We are
committed to help by offering financing and technical expertise.

Yet soon, together with our partners in MENA, we will come out of emergency mode. The question is whether we will
come out stronger than ever, with a hopeful vision for a brighter future for MENA. To bring a new hope to our citizens, we
must learn and change. After all, when the virus arrived in the region, and I mean all of it – its leaders, its entrepreneurs,
its educated youth, the broader civil society – all of the region, was already engaged in difficult debates about the past
and future development of their countries. All aspects of society seemed to be at stake, from the nature of political
systems to technical aspects of social and macroeconomic policies.

With this report, a product of our regional Chief Economist Office, we aim to contribute to an emerging constructive yet
candid public discourse about what we can do better together after the immediate recessionary impacts of the shocks
wither away. I cannot think of anything more important in terms of its scope and reach, than to begin immediately
to discuss the transparency with which public sectors operate. After all, if there is a single lesson to draw from the
pandemic, it is that transparency in the provision of public information can save lives and improve economic outcomes,
partly by enhancing societal trust in the state. It is unfortunate that the region has under-performed for years if not
decades in the transparency department.

                                                                                                                       PREFACE
In fact, as shown in this report, since the beginning of the 21st century, growth of output per capita across MENA has been lower than what is typical for economies with the same levels of development. The authors argue that if the region had grown at the typical rate observed in the rest of the world, the region would be at least 20 percent richer than it is today. The lack of data and transparency in the region could be at least partly responsible for the region’s chronic low-growth syndrome. Indeed, as this report demonstrates, MENA stands out as the only region of the world to experience an absolute decline in their index of data transparency (the “statistical capacity index”) between 2005 and 2018. Many MENA countries have either lagged in their capacity to generate data or have prevented access to data. But reliable data and transparency not only help improve public policies over time but also enhance people’s trust in the state. Lack of transparency hurts even more when systems are under stress by potent threats such as the ongoing pandemic. The authors argue that the region’s declining data transparency has resulted in losses of income per person ranging between 7% and 14%. It is thus plausible that the lion’s share of income losses accumulated during the 21st century relative to the typical growth rates of the rest of the world were due to lack of transparency. Although there is no ironclad econometric model, and as a trained lawyer I cannot opine about such technical matters, the evidence in this report deserves serious attention. Lack of data and transparency hinders credible analyses of many important issues, including the performance of state- owned enterprises, public procurement, the allocation of precious assets such as land, the attraction of private foreign investment, and even obfuscate the maladies affecting the macroeconomies and labor markets of our countries. Since economic policies will only be as good as the information they are based on, logic dictates that lack of transparency in MENA deters effective policy making. I, for one, firmly believe that evidence-based policy debates can accelerate the pace of long-term economic development. This report makes a valiant effort to both raise issues of lack of transparency and to show how key pieces of information are missing in the regional policy dialogue. It is difficult to think of more important long-term challenges for the region than raising the pace of economic growth, solving fiscal vulnerabilities, and improving the performance of labor markets across MENA. Yet, the authors argue, in these areas we see either missing information or ambiguity in the published indicators. In short, this report sheds light in dark corners of crucial ongoing economic policy debates. The grievances that sparked protests across the region can only be addressed by rebuilding trust. The Coronavirus pandemic has put in stark relief what is at stake: Nothing less than human lives and prosperity. Now more than ever, a new social contract is needed, and the process of healing starts with transparency and accountability. The report makes a compelling case that transparency can, in turn, lead to growth and prosperity across MENA in the years and decades to come. I invite you to study this report and decide for yourselves if more sunlight is needed to bring a prosperous future to MENA with enhanced societal trust in the state. Ferid Belhaj Vice President Middle East and North Africa Region The World Bank Group PREFACE
MIDDLE EAST AND NORTH AFRICA REGION ECONOMIC UPDATE APRIL 2020

Overview: How Transparency Can Help the Middle East and
North Africa

The Middle East and North Africa (MENA) region is, once again, consumed by social unrest. The inability of many
governments to deliver quality, affordable public services – from healthcare and education to water and electricity –
erodes the possibility of improvement. Corruption and mismanagement are twin culprits, and the public perception that
the state cannot improve things has created an urge to impose a new system of accountability.

People are taking to the streets to express their frustration and demand change. In the words of one protester criticizing
the ruling elites: “It’s been the same people for 30 years. The main point of this revolution is to do something for the
poor—jobs, services, education.”1

Perhaps the most important word is “revolution.” The surge of societal frustration is not surprising. After all, MENA has
struggled with low growth, macroeconomic fragility, and stagnant labor markets for decades.

This report brings attention to one of the root causes of that frustration—the lack of transparency in the region, defined
as the paucity of published data that meets the minimum accepted international standards regarding definitions of key
economic and social indicators. The report provides technical analyses of the region’s notable lack of transparency and
how it relates to the challenges of low growth, macroeconomic fragility, and stagnant labor markets.

Lack of transparency hurts even more when systems are under stress by potent threats such as the ongoing Covid-19
pandemic. The ramifications of the lack of trust, forged by limited transparency, come into stark relief when citizens are
confused about what to believe. And as we have seen several times over many decades, regaining credibility is not easy.
As one citizen in the region aptly described the leadership response to Covid-19: “When you lose people's trust, even
when you tell the truth, people won't believe you.”2

Losing credibility during a crisis such as a pandemic can be deadly. The lack of transparency across MENA has taken
several forms—from a dearth of overall data, to a lack of accessibility and questionable accuracy of data that does exist.
The situation has been allowed to fester and become deeply embedded in various institutions within the region. Now, it
may have severe consequences.

One area where we will likely see the effects of Covid-19 is economic growth, at least in the near future. Due to the dual
shocks of the spread of the virus and lower oil prices, World Bank economists expect output of MENA to decline in 2020.
This is in sharp contrast to the growth forecast of 2.6 percent published in October 2019. The growth downgrade of
3.7 percentage points is arguably a measure for the costs associated with the dual shocks of Covid-19 and the oil price
collapse. Moreover, such estimates of the costs are highly uncertain and likely to change over the course of the year as
new information comes to light. The report provides an analysis of recent growth forecasts by both private-sector and
World Bank economists.

Perhaps more importantly, since the beginning of the 21st century, growth of output per capita across MENA has been
lower than typical growth for economies with the same levels of development. Had MENA’s growth of output per capita

1   Reuters, 2019. “Lebanon a 'beautiful idea' in need of a reboot, say protesters” (November 7, 2019).
2   https://www.pbs.org/newshour/show/in-iran-government-distrust-rises-amid-deadly-outbreak-of-novel-coronavirus

1                                                                                                                                         OVERVIEW
HOW TRANSPARENCY CAN HELP THE MIDDLE EAST AND NORTH AFRICA

been the same as that of a typical (median) peer economy over the past two decades, the region’s real output per capita
would be at least 20 percent higher than what it is today. And this benchmark is, by definition, mediocre.

A large part of MENA’s low growth is arguably due to a lack of data and transparency. Many MENA countries have either
lagged in their capacity to generate data or have prevented access to data, both of which lead to poor policies. Just as lack
of data about the spread of a virus hampers public policy and societal responses, lack of data and imprecise indicators of
public debt and unemployment hamper policy actions to deal with these long-standing development challenges.

This report argues that reliable data and transparency can help improve public policies over time and enhance people’s
trust in the state. In fact, since 2005, the report finds a strong empirical association between statistical capacity –
including the regular publication of microeconomic and macroeconomic information – and economic growth. That effect
appears to be at least as large (if not larger) than the empirical association between education and growth. Moreover,
the evidence from five models suggests that an observed decline in MENA’s transparency between 2005 and 2018 is
associated with an expected loss of the region’s income per capita ranging from 7 to 14%.

MENA’s macroeconomic fragility has also come to the forefront during recent years. The report presents a battery of tests
on current account and fiscal account vulnerabilities in the region and the rest of the world; however, the credibility of
these analyses critically depends on data transparency. MENA countries generally do not report net public debt, a crucial
metric to assess debt sustainability. Even for gross public debt, MENA countries vary greatly in their reporting standards.
World Bank economists and other external analysts do not have access to vital information about many types of public
debt. Thus, any assessment of the sustainability of the region’s public debt needs to be interpreted with a grain of salt.

With that in mind, considering the lack of transparency in debt indicators, the analyses presented in this report suggest
that MENA countries continue to face notable macroeconomic challenges. First, three developing MENA economies
appear to have unsustainable current account deficits, which in turn are due to low GDP per working age population.
In other words, low growth has brought external macroeconomic fragility to some MENA economies. Second, in 2019,
11 MENA countries appeared to be on unsustainable fiscal paths—that is, the primary fiscal balances were insufficient
to stabilize their reported gross debt-to-GDP ratios. On the other hand, we did find some encouraging evidence (also
imperfect, due to data constraints) that suggests that MENA’s developing countries, as a group, have been on a more
sustainable fiscal path than the rest of the world, on average, in recent years. Either way, for good or for bad, the
lack of transparency of debt indicators in MENA limits our ability to reach firm conclusions about the region’s fiscal
vulnerabilities.

The labor market is another area where MENA faces both notable challenges and constraints imposed by lack of
transparency in the form of imprecise indicators of labor-market outcomes. Among the challenges are persistently high
reported unemployment rates and low rates of female labor force participation. These issues are related to countries’
unsustainable current account imbalances and fiscal paths because the low employment of the working age population
is associated with both external imbalances and inadequate revenue bases.

One of the chief constraints regarding labor markets is the lack of uniformity in the definition of "employment". A review
of MENA’s standards and definitions of labor-market outcomes shows that countries rely on varying and often uncertain
definitions of employment, which in turn affect indicators of unemployment and informality – with little harmonization
– either across the region, or with respect to international standards. In fact, for countries with independent sources of

OVERVIEW                                                                                                                   2
MIDDLE EAST AND NORTH AFRICA REGION ECONOMIC UPDATE APRIL 2020

nationally representative labor-force data for recent years (Egypt. 2018; Jordan, 2016; and Tunisia, 2014), the authors
were not able to replicate the official reported unemployment rates. This report argues that the differences are not
innocuous because the discrepancies disproportionately distort the role of women and rural areas in national labor
markets. It suffices to say that it would be desirable to have access to all countries’ official labor force surveys in order
to have an informed dialogue about definitions and methods.

In turn, the report assesses the key challenge of raising MENA’s female labor force participation, which is critical to
increasing GDP per working age people. The evidence (relying on internationally accepted definitions of employment
and unemployment) suggests that female labor force participation might be a generational issue, as young women tend
to have high rates of labor market participation. A large part of the difference is due to education. Because younger
women are increasingly more educated than previous generations, they are more likely to join the labor force. In our
analyses, education explains between 5 and 12 percentage points of the difference in labor force participation across
generations, while we found that family structure (such as marriage and children) is less important. These findings are
good news for MENA’s future. It is noteworthy that these findings are not due to imprecise indicators, since the analyses
rely on internationally accepted and harmonized definitions of female employment and unemployment. The question is
whether the region can afford to wait for the national rate of female labor force participation to rise with the advent of
new generations of educated young women.

Likewise, historical evidence from an advanced economy and recent evidence from Yemen indicate that female labor
force participation tends to rise during periods of armed conflict, when fewer men are in the labor force. It is plausible
that the increase in female labor force participation might be a thin silver lining in conflict economies; however, it
remains to be seen whether female labor force participation will remain high after peace arrives, as it did in the United
States after World War II.

The grievances that sparked protests across the region can only be addressed by rebuilding trust. A new social contract starts
with transparency and accountability, which could, in turn, lead to growth, more robust analyses of fiscal sustainability,
and improved policies for tackling the macroeconomic and employment challenges that have been allowed to fester for
years—if not decades. Through transparency, prosperity with societal trust can be achieved across MENA in the years
and decades to come.

3                                                                                                                    OVERVIEW
HOW TRANSPARENCY CAN HELP THE MIDDLE EAST AND NORTH AFRICA

CHAPTER I: THE DUAL SHOCKS OF THE NOVEL CORONAVIRUS AND THE
                      OIL PRICE COLLAPSE

    Chapter I takeaways:
    •     Economies in the Middle East and North Africa face unprecedented dual shocks from the spread of the novel
          coronavirus (Covid-19) and the collapse of oil prices.
    •     The spread of Covid-19 causes severe negative demand and supply shocks.
    •     The fall in oil prices depresses income in the MENA region. It is directly felt by oil exporters and indirectly by oil
          importers through reduced remittances, foreign investment, and sovereign lending.
    •     A preliminary estimate of the crisis’ economic costs in 2020 is 3.7% of regional output.
    •     The estimate remains tentative because the costs will depend on both policy and societal responses to the dual
          shocks.
    •     But MENA has suffered from a low-growth syndrome for decades when compared to the rest of the world in terms
          of GDP per capita growth rates.
    •     The region’s low long-term growth rates are partly attributable to the region’s declining data transparency.

Economies in the Middle East and North Africa (MENA) face unprecedented dual shocks from the spread of Covid-19 and
the collapse in oil prices. As the world struggles with an emerging recession, MENA was already facing social discontent
manifested in street protests. The dual shocks bring negative supply, demand and income shocks, further aggravating
pre-existing economic and social challenges.

I.1 The spread of Covid-19

Chinese authorities first alerted the World Health Organization (WHO) of a new coronavirus infection on December 31,
2019. This new virus, Covid-19, can produce flu-like symptoms that sometimes are more severe with a higher chance of
death than the flu.

Besides the human toll, the virus affects MENA economies via four channels: the deterioration of public health, falling
global demand for the region’s goods and services, declines in MENA’s domestic supply and demand, and importantly,
falling oil prices.

ÌÌThe Deterioration of Health

The virus has spread to more than 177 countries and territories—with over 360,000 cases and more than 15,000 deaths
as of March 23, 20203 . The pandemic has caused severe disruptions of economic activity across the globe. The virus
has already spread to MENA countries, of which Iran, has been hardest hit with more than 23,000 reported cases and
1,400 deaths as of March 23. Other MENA countries have also reported infections. Governments are closing schools and
imposing restrictions on businesses and public gatherings. These efforts, while believed necessary to slow the spread

3       https://www.worldometers.info/coronavirus/

CHAPTER I                                                                                                                          4
MIDDLE EAST AND NORTH AFRICA REGION ECONOMIC UPDATE APRIL 2020 of the virus—especially because of limited real-time information on its magnitude and spread—will undoubtedly hurt economic activity. The ability to contain the virus depends on the strength of the public health systems of the MENA countries and their health policy responses. Public health policy responses, in turn, depend on the number of infections and where they are spreading. The outbreak can be in clusters, with some places becoming hot spots. Transparency of data and sharing of information are vital as governments and citizens must work together to change social behaviours to flatten the infection curve. Otherwise public health systems could be overwhelmed. Consequently, societies subject to opaque information- sharing by the state are also among the most vulnerable to a pandemic. This is evident in the relative success of South Korea in containing the virus. As South Korea’s Foreign Minister Kang Kyung-wha put it in an interview: “The basic principle is openness, transparency, and fully keeping the public informed” (BBC, 2020). The MENA region is particularly vulnerable. MENA scores second-lowest among all regions in the overall Global Health Security Index4, while ranking last in both “epidemiology workforce” and “emergency preparedness and response planning”. The situation is more dire in conflict-affected environments. Wars in Syria and Yemen will almost certainly impede the proper functioning of their health systems. ÌÌFalling Global Demand Global economic difficulties and the disruption of global value chains will reduce demand for the region’s goods and services, most notably oil and tourism. The implications of collapsing oil prices are discussed in section I.2. The tourism sector in MENA is affected in two ways. First, many MENA countries and many other nations are imposing travel restrictions. Second, the global economic slowdown and social distancing efforts imply fewer tourists travelling to other countries, including within the MENA region. Moreover, the sharp drop of global travel will further depress already tanking oil prices. ÌÌDeclines in MENA’s Domestic Supply and Demand The spread of Covid-19 also generates a negative demand shock from the abrupt reduction in regional business activities and travel due to concerns about the spread of the virus. In addition, uncertainty associated with the spread of the virus and aggregate demand could further dampen the region’s investment and consumption. Collapsing oil prices further depress demand in MENA; the oil and gas sector is the most important one in many of the region’s economies. Finally, potential financial market volatility could have real effects and further disrupt aggregate demand in the region. Similar effects were observed in the 1918 Spanish Flu pandemic in the United States. Correia and others (2020) find that the Spanish Flu pandemic also created both negative supply and demand shocks. Localities in the United States that had higher mortality rates also had larger declines in manufacturing activity, bank assets and spending on durable goods. Perhaps more importantly from a policy perspective, the evidence from 1918 indicates that localities that implemented 4 https://www.ghsindex.org/ 5 CHAPTER I
HOW TRANSPARENCY CAN HELP THE MIDDLE EAST AND NORTH AFRICA

  Figure I.1 Negative Supply and Demand Shocks in MENA                       tougher containment and mitigation policies such as social
 P                                                                           distancing and limitations on social interactions were
                                   S1                                        also the localities that experienced the fastest economic
                                                S0                           recoveries afterwards. The related issue of the sequencing
                                                                             of policy responses is explored further in section I.3.

                                                               The negative demand and supply shocks are illustrated in
                        D1               D0                    Figure I.1. Original demand and supply curves are D0 and
                                                               S0 and the original output is Q0. Because of the spread of
                 Q1        Q0                       Q          the virus to the region, both curves shift left, generating a
                                                               new equilibrium output Q1, which implies a reduction of
                                                               output and income even though the net impact on price
inflation is ambiguous (Figure I.1 is drawn to reflect a scenario in which prices fall). The extent of the declines in supply
and demand is uncertain. The drop-offs depend on the disclosure of information about the spread of the virus and the
health policy responses by the countries. Consequently, any forecasts or estimates of future economic activity must be
treated with great caution and are likely to change as new information comes to light.

I.2 The Collapse of Oil Prices

The oil price collapse exacerbates the impact of Covid-19 and brings severe negative income shocks to many MENA
economies. After tallies of death rates in China         Figure I.2 Global Oil Demand Forecasts for 2020
were reported, oil prices declined sharply. Because      1400       KBD
of China’s increasingly important role in global         1200

commodity markets, any setbacks to its economy are       1000
                                                           800
expected to significantly reduce global demand. In
                                                           600
addition, the global fear and uncertainty regarding        400
the spread of virus is likely to hurt investment           200

decisions in China and in other countries, further           0

weighing on demand prospects and lowering oil             -200
                                                                    Aug-19       Sep-19     Oct-19       Nov-19       Dec-19      Jan-20    Feb-20 Mar-20
prices. The March 2020 report from the International
                                                       Source: International Energy Agency
Energy Agency (IEA) projected that in 2020 global Note: Horizontal axis indicates different vintages of IEA’s 2020 global demand forecasts.
oil demand growth would fall for the first time since
2009 (see Figure I.2). The IEA in March forecasts a 0.09 million barrel per day (mbd) decline daily demand in 2020, 1.1
mbd lower than its forecast a month earlier.

In response to falling demand for oil, the Organization of the Petroleum Exporting Countries (OPEC) on March 5 proposed
a 1.5 mb/d production cut for the second quarter of 2020—of which 1 mb/d would come from OPEC countries and 0.5
mb/d from non-OPEC but aligned producers, most prominently Russia. The following day, Russia rejected the proposal,
prompting Saudi Arabia—the world’s largest oil exporter—to boost production to 12.3 mb/d, its full capacity. Saudi
Arabia also announced unprecedented discounts of almost 20 percent in key markets (Arezki and Fan, 2020). The boost
in supply, coupled with falling demand, resulted in a collapse in oil prices, to as low as $31.1 a barrel on the following

CHAPTER I                                                                                                                                              6
MIDDLE EAST AND NORTH AFRICA REGION ECONOMIC UPDATE APRIL 2020
Figure I.3 Brent Oil Price and Futures
(U.S. dollars a barrel; expiration dates on x-axis)
90
Spot Brent oil price
9/25/19
80
1/21/20
3/9/20 70
3/18/20
60
50
40
30
Dec 2022
20
Jan-2018 Jul-2018 Jan-2019 Jul-2019 Jan-2020 Jul-2020 Jan-2021 Jul-2021 Jan-2022 Jul-2022
Source: Bloomberg, L.P.
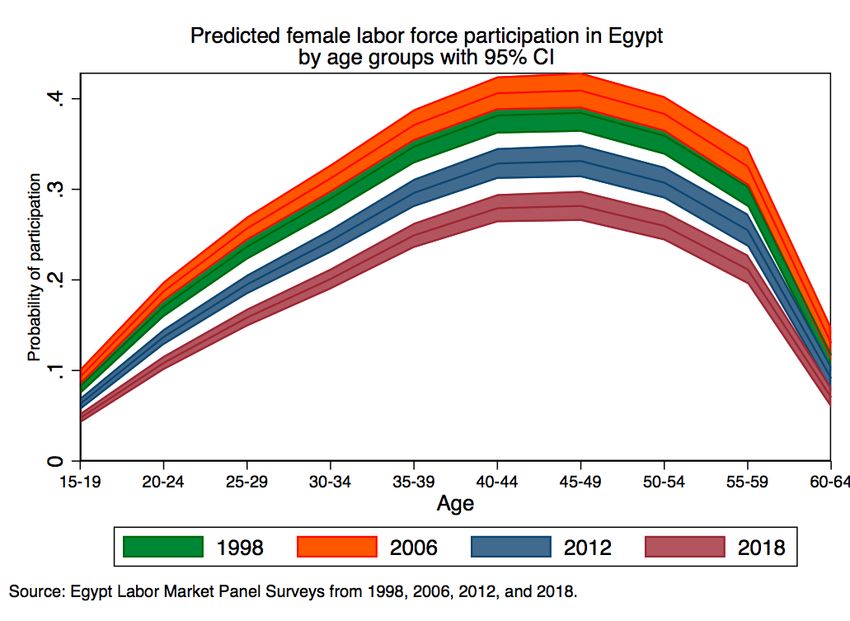
Note: The black line indicates the spot price of Brent crude oil. The colored lines illustrate the futures prices of Brent crude oil on, respectively, September 25, 2019; January 21, 2020; March 9, 2020, after the
disintegration of the OPEC+ alliance; and March 18, 2020.
Monday, March 9, and to about $25 a barrel as of March 18 (see Figure I.3). The upward pointing futures curve suggests
the market still expects oil prices to recover, but slowly—reaching about $43 per barrel by the end of 2022. But, of
course, such forecasts are uncertain.
The oil price collapse produced a massive Figure I.4 Rough Calculations of the Income Effect of the Oil-Price Collapse
direct negative income effect for MENA across MENA Economies
oil exporters. It also hurt oil importers,
even though as a general rule, lower
10%
prices are good for oil-importing
economies and bad for oil exporters. 5%
A simple way to get a sense of the size
0%
of the real income effect is to multiply
the difference between production and -5%
consumption (net oil exports) as a share -10%
of GDP by the percentage point decrease
in the oil price (see Figure I.4). Based -15%
on a hypothetical scenario in which oil -20%
prices stay 48 percent below their 2019
-25%
level, Kuwait, whose net oil exports
Iran, Islamic Rep.
Lebanon
Kuwait
Algeria
Bahrain
Djibouti
Tunisia
Saudi Arabia
United Arab Emirates
Egypt, Arab Rep.
Qatar
Iraq
Oman
Yemen
Morocco
Jordan
account for 43 percent of GDP, would
experience a decline in real income
of about 20 percent of GDP, while oil-
importer Morocco would experience an
increase in real income equivalent to 3
percent of GDP. Source: Authors’ calculations based on data from the World Economic Outlook database.
Note: Oil prices are from March 13, 2020 with a forecast of $33.4 per barrel for 2020, 48% lower than the price of 2019 ($64 per barrel).
However, in MENA it is likely that lower
oil prices will also indirectly hurt oil
7 CHAPTER IHOW TRANSPARENCY CAN HELP THE MIDDLE EAST AND NORTH AFRICA importers through reduced foreign direct investment, remittances, and grants from the region high-income exporters. The economic fortunes of MENA’s oil importers and exporters are connected. The two shocks of Covid-19 and oil price collapse are intertwined, yet distinct. On one hand, the demand component of the oil shock is linked to the sharp reduction in oil consumption stemming from the negative supply and demand shocks associated with the spread of Covid-19. The speed of that recovery will depend on how swiftly and decisively governments take measures to mitigate the economic and financial dislocations from the health crisis. On the other hand, the supply component of the oil shock is likely to persist and keep downward pressure on oil prices for some time. I.3 Toward a Sequencing of Policy Responses to the Dual Shocks To deal with the dual shocks, a two-pronged approach can be pursued. One is immediate and related to the health emergency. The other concerns forward looking policy reforms. Authorities could sequence and tailor their responses to the severity of the shocks. That is, it might be desirable to focus first on responding to the health emergency and the associated economic contraction. Fiscal consolidation and structural reforms associated with the persistent drop in oil prices and pre-existing challenges are also very important, but with proper external support, can wait until the health emergency subsides. After the crisis, budget-neutral reforms such as debt transparency and reforms of state-owned enterprises will also come to the fore. In responding to Covid-19, fiscal authorities could prioritize health spending—including producing or acquiring test kits, mobilizing and paying health workers, adding health-care infrastructure, and preparing for vaccination campaigns. The authorities could use target cash transfers on vulnerable households and support the private sector, including informal firms (see Arezki and Nguyen, 2020). During this time, it is paramount to reach the large number of workers in the informal sector, which provides no safety net. Chapter III provides estimates of the informal labor force in MENA, which can be as high as 70 percent of the labor force. Many of them work hand-to-mouth. Given the large number of informal workers and borrowing constraints in many developing countries in MENA, targeted assistance is vital and should be larger relative to the economy than similar efforts in advanced economies. Successful models of quickly deploying technology to fight Covid-19 and target assistance can be analyzed and replicated5. Freeing information flows, increasing transparency, and data disclosure to reduce leakages, are crucial elements in targeted cash transfers—which are essential to ensuring a flattening of the spread of the virus, hastening the economic recovery, and limiting the rise in poverty. To reduce the risk of financial instability, the relevant policy authorities in the MENA region can reduce interest rates and inject liquidity into the banking system. Where inflation is low, liquidity injection and targeted cash transfers could even be financed by “helicopter money,” that is, essentially, money printed by central banks (Gali, 2020). The battle against the spread of the novel coronavirus and its economic and social consequences will be made more difficult by empty government coffers. Many MENA countries are facing large balance of payments and fiscal deficits. Many also carry high sovereign-risk premiums. For those countries, additional foreign borrowing on private markets will be difficult. Moreover, countries with fixed exchange rates will find it difficult to use helicopter money because of the tension between money-printing and maintenance of a peg. The region will need much international support to help it navigate an extremely rough patch. 5 See Foreign Affairs (2020) for the experience of Taiwan. CHAPTER I 8
MIDDLE EAST AND NORTH AFRICA REGION ECONOMIC UPDATE APRIL 2020

I.4 Quantifying the Effects of the Dual Shocks

One key indicator of the expected costs of the dual shocks is arguably the change in growth expectations relative to
previous growth forecasts prior to the the dual shocks. However, while it is relatively straightforward to predict that
MENA’s growth will decline, it is much more difficult to forecast future growth precisely. For one thing, economists
generally have difficulties forecasting severe economic downturns (An and others 2018). For another, rare and large
negative shocks, so-called “black swan” events, are even harder to predict than run-of-the-mill recessions (Vegh and
others 2018). During crisis periods, the variance across different forecasts tends to grow larger, reflecting economists’
diverging thinking about future economic developments in situations where anything can seem plausible. Table I.1
shows the standard deviation of private sector forecasts for a set of MENA countries’ output growth in 2020—made
in March 2020, after the pandemic and the collapse of oil prices, and in December 2019, before the pandemic. For
most countries, projected 2020 GDP growth rates were revised downward while the standard deviation (an indicator of
forecast uncertainty) increased.

  Table I.1. Standard Deviation of Private-Sector Forecasts for 2020 GDP Growth across MENA Economies

                                                                                  Consensus Forecasts                            Standard Deviation
                                                                        March         December                         March         December
                                                                                                        Difference                                    Difference
                                                                      forecasts       forecasts                      forecasts       forecasts
Algeria                                                                     1.5          1.7             -0.23         0.7             0.6               0.07
Egypt                                                                       5.5          5.6             -0.05         0.3             0.4              -0.02
Iraq                                                                        3.4          3.8             -0.39         2.1             1.7               0.39
Jordan                                                                      2.3          2.3             -0.05         0.2             0.3              -0.01
Lebanon                                                                    -1.2          1.1             -2.27         3.1             1.0               2.09
Morocco                                                                     3.0          3.0             -0.05         0.5             0.5              -0.01
Tunisia                                                                    2.3           2.1              0.17         0.7             0.9              -0.13
Bahrain                                                                    1.7           2.0             -0.26         0.5             0.7              -0.17
Kuwait                                                                     1.9           2.2             -0.31         0.8             0.7               0.13
Oman                                                                       2.0           2.4             -0.43         1.1             1.5              -0.42
Qatar                                                                      2.0           2.5             -0.45         0.6             0.4              0.14
Saudi Arabia                                                               1.6           2.0             -0.43         0.5             0.4              0.13
UAE                                                                        2.0           2.4             -0.40         0.6             0.4              0.23
Source: Authors’ calculations based on data from Focus Economics (2020).

Given the dual shocks to the region, World Bank economists downgraded the growth forecast for MENA in 2020 by 3.7
percentage points relative to our forecast published in October 2019 (see Tables I.2 and I.3). The growth downgrade
of 3.7 percentage points is arguably a rough measure of the expected costs of the dual shocks, because they are the
dominant developments since October 2019.

Nevertheless, it cannot be overstated that the forecasts remain fluid. To illustrate the uncertainty surrounding the
forecasts, Table I.3 shows the differences between two recent rounds of World Bank’s forecasts separated by less than
two weeks (in March 19, 2020 and April 1, 2020 respectively) with the October 2019 forecasts. For most countries, the
new forecasts in April 1, 2020 are substantially lower than those done in March 19, 2020, reflecting adjustments due to
newly available information.

9                                                                                                                                                        CHAPTER I
Table I.2. Uncertain Forecasts: World Bank’s Growth, Current Account and Fiscal Balance Forecasts
Real GDP Growth Real GDP per capita Growth Current Account Balance Fiscal Balance
CHAPTER I
(percent) (percent) (percent of GDP) (percent of GDP)
2018 2019e 2020f 2021f 2022f 2018 2019e 2020f 2021f 2022f 2018 2019e 2020f 2021f 2022f 2018 2019e 2020f 2021f 2022f
MENA 1.1 0.3 -1.1 2.1 2.8 -0.6 -1.1 -2.6 0.4 1.5 4.1 1.2 -7.2 -4.6 -3.4 -3.0 -4.7 -9.7 -8.0 -7.0
Developing MENA 0.2 -0.2 -1.8 2.3 3.1 -1.3 -1.5 -3.4 0.7 1.6 -0.8 -3.1 -6.8 -5.2 -4.9 -2.8 -5.4 -10.0 -8.6 -8.0
Oil Exporters 0.4 -0.5 -1.6 1.7 2.3 -1.4 -2.0 -3.2 0.0 1.0 6.3 2.6 -7.8 -4.8 -3.3 -2.1 -4.2 -10.3 -8.4 -7.3
GCC 2.0 0.9 -0.4 1.8 2.5 0.1 -0.8 -1.9 0.1 1.4 8.5 5.1 -7.6 -4.0 -1.7 -3.2 -4.0 -9.3 -7.4 -5.9
Bahrain 1.8 1.8 -2.5 3.0 2.3 1.3 1.8 -2.5 -3.4 2.3 -5.9 -3.0 -9.2 -7.3 -5.3 -11.9 -10.6 -16.6 -12.5 -10.2
Kuwait 1.2 0.7 0.0 1.6 2.2 -0.2 -0.5 -1.2 0.2 0.8 15.1 8.1 -6.4 -5.2 -3.0 -3.0 -13.6 -25.6 -19.8 -14.7
Oman 1.8 0.5 -3.5 2.7 2.5 -2.3 -3.0 -6.3 0.4 2.5 -5.5 -5.2 -15.2 -11.4 -7.7 -7.9 -6.9 -17.9 -14.5 -12.0
Qatar 1.5 1.4 0.4 1.5 2.4 -0.6 -0.4 -1.3 -0.2 0.7 8.7 2.6 0.0 1.9 2.8 2.2 1.3 -3.0 -1.0 0.0
Saudi Arabia 2.4 0.3 0.2 2.1 2.6 0.6 -1.4 -1.4 0.5 1.1 9.0 5.4 -10.3 -5.4 -5.3 -5.9 -4.2 -7.5 -6.4 -6.4
United Arab 1.7 1.7 -1.1 1.2 2.3 0.2 0.3 -2.4 0.0 2.3 9.1 7.5 -5.7 -2.5 3.9 1.2 -1.6 -7.0 -5.5 -3.0
Emirates
Developing Oil -2.4 -3.1 -3.9 1.4 1.9 -4.0 -4.2 -5.5 -0.3 0.2 2.4 -1.9 -8.3 -6.1 -5.9 -0.2 -4.5 -11.9 -10.2 -9.8
Exporters
Algeria 1.4 0.9 -3.0 1.1 1.8 -0.3 -0.7 -4.5 -0.3 0.3 -9.8 -10.2 -18.8 -17.0 -17.0 -9.6 -11.5 -16.3 -16.5 -14.8
HOW TRANSPARENCY CAN HELP THE MIDDLE EAST AND NORTH AFRICA
Iran -4.7 -8.2 -3.7 1.3 1.5 -5.7 -9.1 -4.6 0.4 0.7 5.3 -0.4 -2.5 -2.1 -1.9 -1.4 -5.1 -6.5 -6.8 -7.1
Iraq -0.6 4.4 -5.0 1.9 2.7 -3.3 3.5 -8.3 -1.6 -0.8 6.9 2.5 -12.1 -5.9 -5.7 11.2 3.0 -19.4 -12.3 -11.4
Developing Oil 3.8 3.5 0.6 3.3 4.5 2.2 1.9 -0.8 1.9 3.2 -6.6 -5.0 -4.8 -4.0 -3.7 -7.4 -6.7 -7.6 -6.4 -5.9
Importers
Djibouti 8.4 7.5 1.3 9.2 8.2 6.8 5.9 -0.1 7.7 6.7 13.4 18.5 16.5 18.4 18.4 -2.5 -0.5 -2.9 -2.1 -2.0
Egypt 5.3 5.6 3.7 3.8 5.8 3.4 3.7 1.9 2.1 4.1 -2.4 -3.6 -3.7 -3.4 -3.3 -9.7 -8.1 -8.2 -7.3 -6.5
Jordan 1.9 2.0 -3.5 2.0 2.2 0.1 0.5 -4.5 1.3 1.9 -7.0 -2.9 -3.9 -3.7 -3.3 -3.4 -4.7 -4.4 -4.1 -3.4
Lebanon -1.9 -5.6 -10.9 -6.3 -3.4 -2.5 -6.1 -11.4 -6.8 -2.1 -24.3 -12.5 -7.0 -6.5 -7.5 -11.0 -10.6 -12.1 -11.4 -12.0
Morocco 3.0 2.3 -1.7 5.5 4.2 1.9 1.2 -2.7 4.4 3.1 -5.5 -4.6 -7.5 -4.2 -3.2 -3.7 -3.6 -6.0 -3.3 -3.1
Tunisia 2.7 1.0 -4.0 4.2 2.2 1.6 -0.4 -4.8 3.2 1.3 -11.2 -8.8 -7.2 -7.0 -6.8 -4.8 -4.1 -5.0 -3.8 -2.9
West Bank & Gaza 1.2 0.9 -2.5 2.1 2.4 -1.4 -1.7 -5.0 -0.5 -0.3 -10.2 -9.9 -7.3 -6.3 -6.0 -2.5 -4.4 -6.1 -3.9 -3.8
Memorandum
Libya 15.1 2.5 -19.4 NP 1.4 13.4 1.0 -20.5 20.7 0.3 21.4 11.6 -29.3 -9.0 -8.2 -7.0 1.7 -36.7 -2.6 -2.5
Sources: Authors’ calculations based on data from World Bank Macro and Poverty Outlook. Data are as of April 1, 2020.
Note: e=estimate, f=forecast and NP=not presented. Data are rounded up to a single digit. Data for Egypt correspond to its fiscal year (July-June). Libya, Syria and Yemen are not included in the regional and sub-regional averages due to lack of reliable data.
10MIDDLE EAST AND NORTH AFRICA REGION ECONOMIC UPDATE APRIL 2020
Table I.3. Changing Estimates of the Costs of the Crisis: World Bank Growth Forecasts Relative to October 2019
Percentage points
Difference (March 19, Difference (April 1,
October Forecast
Real GDP Growth, percent 2020 - October 2019) 2020 - October 2019)
2019e 2020f 2021f 2019e 2020f 2021f 2019e 2020f 2021f
MENA 0.6 2.6 2.9 -0.3 -2.1 -0.3 -0.2 -3.7 -0.8
Developing MENA 0.0 3.0 3.1 -0.2 -2.8 -0.5 -0.2 -4.8 -0.7
Oil Exporters -0.4 2.1 2.3 -0.2 -2.4 -0.3 -0.1 -3.7 -0.7
GCC 1.1 2.2 2.7 -0.3 -1.4 -0.2 -0.2 -2.6 -0.9
Bahrain 1.8 2.1 2.3 -0.1 -1.3 -0.7 0.0 -4.6 0.7
Kuwait 1.5 2.5 2.8 -0.8 -2.5 -1.2 -0.8 -2.5 -1.2
Oman 0.3 3.5 4.0 0.2 -3.3 -3.0 0.2 -7.0 -1.3
Qatar 2.0 3.0 3.2 -0.6 -1.6 -0.9 -0.6 -2.6 -1.7
Saudi Arabia 0.5 1.6 2.2 -0.2 -0.8 1.3 -0.2 -1.4 -0.1
United Arab Emirates 1.8 2.6 3.0 -0.3 -1.8 -1.7 -0.1 -3.7 -1.8
Developing Oil Exporters -3.3 1.8 1.7 0.1 -4.1 -0.4 0.1 -5.7 -0.3
Algeria 1.3 1.9 2.2 -0.4 -3.2 -0.9 -0.4 -4.9 -1.1
Iran -8.7 0.1 1.0 0.5 -1.9 0.1 0.5 -3.8 0.3
Iraq 4.8 5.1 2.7 -0.4 -9.0 -0.8 -0.4 -10.1 -0.8
Developing Oil Importers 4.1 4.4 4.6 -0.6 -1.2 -0.6 -0.6 -3.8 -1.3
Djibouti 7.2 7.5 8.0 0.3 -0.5 0.2 0.3 -6.2 1.1
Egypt 5.6 5.8 6.0 -0.1 -0.3 -0.4 -0.1 -2.1 -2.2
Jordan 2.2 2.3 2.5 -0.2 -0.4 -0.3 -0.2 -5.8 -0.5
Lebanon -0.2 0.3 0.4 -5.4 -8.1 -6.1 -5.4 -11.2 -6.8
Morocco 2.7 3.5 3.6 -0.4 -1.8 0.0 -0.4 -5.2 1.9
Tunisia 1.6 2.2 2.6 -0.6 -1.4 -0.8 -0.6 -6.2 1.6
West Bank & Gaza 1.3 -1.1 -0.4 -0.4 0.0 2.5 -0.4 -1.4 2.5
Source: Authors’ calculations based on data from World Bank Macro and Poverty Outlook and Arezki et al. (2020).
Note: Libya, Syria and Yemen are not included in the regional and sub-regional averages due to lack of reliable data.
As with any economic forecasts during periods of unexpected and large negative shocks, these forecasts have large
margins of error. This speaks to the possibility of different future states of the world – “multiple equilibria” in technical
jargon. Depending on the future spread of the virus, the health policy responses, societal responses, and future
developments in global oil markets, several plausible scenarios could emerge for any or all MENA economies. The actual
growth rates could reflect different equilibria than the ones presented here. The uncertainty about the future is further
exacerbated by incomplete current information about the spread of the novel coronavirus—which could be due to lack
of testing, lack of disclosure, or both.
With this caveat, we examine whether the World Bank’s growth downgrades correlate with a country’s exposure to oil
exports—measured as net crude oil exports as a fraction of GDP in 2019—and a country’s Global Health Security (GHS)
index—which captures its capability to prevent and mitigate epidemics and pandemics, including compliance with
international norms and the reporting of health information6.
6 The index was jointly developed by the Nuclear Threat Initiative, the Johns Hopkins Center for Health Security, and the Economist Intelligence Unit. Data were released in 2019. The
index consists of six categories: prevention; detection and reporting; rapid response; health system; compliance with international norms; and risk environment (see https://www.
ghsindex.org/).
11 CHAPTER IHOW TRANSPARENCY CAN HELP THE MIDDLE EAST AND NORTH AFRICA
Fifteen countries are included. 7 Overall, growth downgrades between April 1, 2020 and October 2019 are positively
correlated with the GHS Index and not significantly correlated with oil export exposure. In other words, for countries
with a stronger capability to prevent and mitigate pandemics, economic growth is expected to fall relatively less than for
countries not so well situated (see the partial correlation scatterplots in Figure I.5). The fact that the downgrades are not
significantly correlated with oil export exposure could reflect the fact that even oil importers in MENA can suffer from
the decline in oil prices, as mentioned above. However, a similar exercise conducted with the March 19 forecasts showed
a negative relationship between the growth downgrades and oil export exposure. This relationship disappeared with the
April 1 forecasts.
Figure I.5. Correlates of the Costs of the Crisis: Growth Downgrades, Oil Export Exposure and Health Security
Panel A: Growth Downgrades and Health Security Index Panel B: Growth Downgrades and Oil Export Exposure
4
4
Saudi Arabia
Egypt
Kuwait
2
Qatar Algeria
2
Egypt Qatar
United Arab Emirates Kuwait
Saudi Arabia
Iran
0
Algeria Bahrain Morocco
Lebanon Jordan Djibouti
Tunisia
0
Iran
Tunisia Bahrain
Djibouti United Arab Emirates
-2
Lebanon
Morocco
Oman -2 Jordan
-4
Iraq
Iraq Oman
-6
-4
-20 -15 -10 -5 0 5 10 15 -.3 -.2 -.1 0 .1 .2 .3 .4
Health residual Oil residual
Growth residual Fitted values Growth residual Fitted values
Source: Authors’ calculations based on data from World Bank Macro and Poverty Outlook.
The evidence suggests that the changes in the World Bank’s forecasts are systematically related to initial pre-existing
conditions, particularly each economy’s health system. It cannot be overstated, however, that all economic forecasts from
any source are highly uncertain. This said, the challenge of low growth was not brought to MENA by the dual shocks. The
region has been suffering from low-growth syndrome for decades.
An important and related question is whether the growth slowdown will be transitory or permanent. In general, a transitory
economic shock that does not permanently affect other economic variables will imply a transient growth downgrade,
leading to a fast recovery afterwards. This would be a “V-shaped” pattern. If instead, the shocks are permanent or if
transitory shocks interact with domestic conditions to make the impact permanent, then the over-time path of growth
could follow an “L” shape.
In the current context, as mentioned above, the spread of the virus could have potentially catastrophic, but transitory,
effects on public health . However, it could have more durable effects on the economy if it interacts with existing
economic vulnerabilities. On the other hand, the oil price collapse might be more long-lasting if it reflects permanent
structural changes in the global oil market due to technological progress (e.g., shale and renewables) and consequent
changes in the market power of OPEC+.
7 The Global Health Security Index is not available for West Bank and Gaza. Oil export data are not reliable for Libya.
CHAPTER I 12You can also read