Employment, Utilization, and Development of Airborne Laser Scanning in Fenno-Scandinavian Archaeology-A Review - MDPI
←
→
Page content transcription
If your browser does not render page correctly, please read the page content below
remote sensing
Article
Employment, Utilization, and Development of
Airborne Laser Scanning in Fenno-Scandinavian
Archaeology—A Review
Ole Risbøl 1, *, Daniel Langhammer 2 , Esben Schlosser Mauritsen 3 and Oula Seitsonen 4,5
 1    Department of Archaeology and Cultural History, NTNU University Museum, 7012 Trondheim, Norway
 2    The County Administrative Board of Gotland, 621 85 Visby, Sweden; daniel.langhammer@lansstyrelsen.se
 3    ARKVEST, Ringkøbing-Skjern Museum, 6900 Skjern, Denmark; esm@arkvest.dk
 4    Archaeology, University of Oulu, 90570 Oulu, Finland; oula.seitsonen@gmail.com
 5    Archaeology, University of Helsinki, 00014 Helsinki, Finland
 *    Correspondence: ole.risbol@ntnu.no

 Received: 2 March 2020; Accepted: 24 April 2020; Published: 30 April 2020

 Abstract: This paper gives a presentation of how airborne laser scanning (ALS) has been adopted
 in archaeology in the North over the period 2005–2019. Almost two decades have passed since
 ALS first emerged as a potential tool to add to the archaeologist’s toolbox. Soon after, it attracted
 the attention of researchers within archaeological communities engaged with remote sensing in
 the Fenno-Scandinavian region. The first archaeological ALS projects gave immediate good results
 and led to further use, research, and development through new projects that followed various
 tracks. The bulk of the research and development focused on studying how well-suited ALS is for
 identifying, mapping, and documenting archaeological features in outfield land, mainly in forested
 areas. The poor situation in terms of lack of information on archaeological records in outfield areas
 has been challenging for research and especially for cultural heritage management for a long period of
 time. Consequently, an obvious direction was to study how ALS-based mapping of cultural features
 in forests could help to improve the survey situation. This led to various statistical analyses and
 studies covering research questions related to for instance effects on detection success of laser pulse
 density, and the size and shape of the targeted features. Substantial research has also been devoted
 to the development and assessment of semi-automatic detection of archaeological features based
 on the use of algorithms. This has been studied as an alternative approach to human desk-based
 visual analyses and interpretations of ALS data. This approach has considerable potential for
 detecting sites over large regions such as the vast roadless and unbuilt wilderness regions of northern
 Fennoscandia, and has proven highly successful. In addition, the current review presents how ALS
 has been employed for monitoring purposes and for landscape studies, including how it can influence
 landscape understanding. Finally, the most recent advance within ALS research and development
 has been discussed: testing of the use of drones for data acquisition. In conclusion, aspects related to
 the utilization of ALS in archaeological research and cultural heritage management are summarized
 and discussed, together with thoughts about future perspectives.

 Keywords: review; remote sensing; airborne LiDAR; mapping; archaeology; Fenno-Scandinavia

1. Introduction
     Airborne laser scanning (ALS) is a remote sensing technique where short pulses of near-infrared
light are emitted towards the ground from a sensor mounted on an aircraft. The pulses are distributed
to both sides of the flight direction by a mirror tilting back and forth at an angle of typically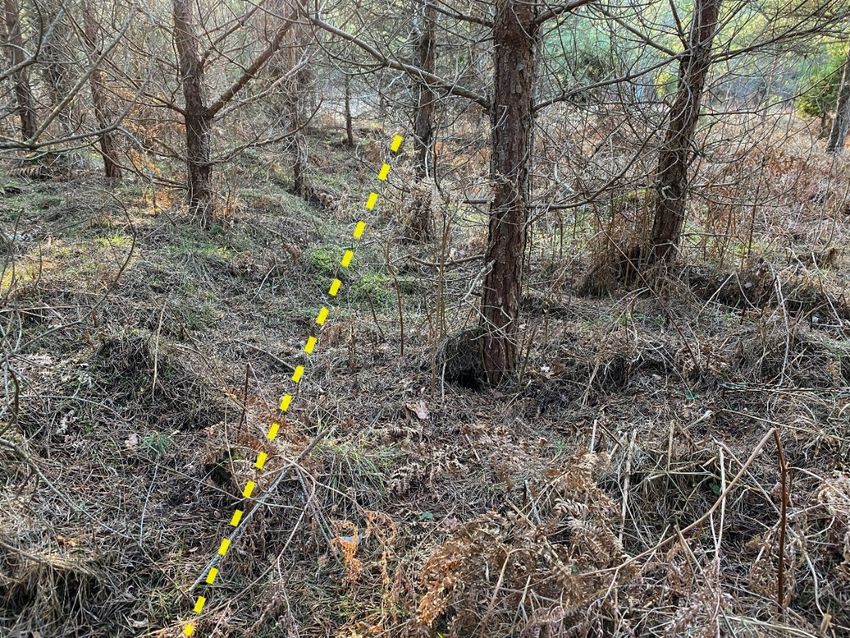
Remote Sens. 2020, 12, x FOR PEER REVIEW 2 of 41
angle). This causes the ALS data to be collected in a corridor under the aircraft that is normally
Remote
betweenSens.100 12, 1411
2020,and 1000 m wide. The light pulses are reflected back to the sensor from what is hit 2 ofon
41
the ground, whether it be vegetation, buildings, or terrain, among other options. The position of each
reflection100
between can then
and 1000bemcalculated
wide. Theinlight
three dimensions
pulses (3D) using
are reflected back toknowledge of thewhat
the sensor from plane’s position
is hit on the
and orientation in space as well as the scan angle and the time it takes from
ground, whether it be vegetation, buildings, or terrain, among other options. The position of eachthe pulse to leave the
sensor until
reflection canthe
thenreturns are recorded
be calculated in dimensions
in three the sensor. These data knowledge
(3D) using consist of millions of points
of the plane’s stored
position andin
a point cloud and can be used to create digital surface models (DSMs). In such models
orientation in space as well as the scan angle and the time it takes from the pulse to leave the sensor one can choose
to filter
until theout the pulses
returns reflectedinfrom
are recorded vegetation
the sensor. or data
These buildings
consistandofbe left with
millions of apoints
detailed terrain
stored in amodel
point
of the bare ground. Such terrain models devoid of vegetation are very suitable
cloud and can be used to create digital surface models (DSMs). In such models one can choose to filter for analyzing,
interpreting,
out the pulsesand visualizing
reflected conditionsoronbuildings
from vegetation the ground
andin be3Dleftfrom
with all angles and
a detailed aspects
terrain model ranging
of the
from a frog’s to a bird’s perspective.
bare ground. Such terrain models devoid of vegetation are very suitable for analyzing, interpreting,
The visualizing
and history of the use of (ALS)
conditions on theinground
archaeology is brief:
in 3D from If one and
all angles wereaspects
to define a year
ranging zero,
from that year
a frog’s to a
wouldperspective.
bird’s be the year 2000, when the first ALS images for archaeological purposes were presented in
The history
September at theofAerial
the use of (ALS) in archaeology
Archaeological Research Group is brief: If one in
meeting were to defineScotland
Aberdeen, a year zero,
[1,2] that
The
year would be the year 2000, when the first ALS images for archaeological purposes
dissemination of results from the utilization of ALS in archaeology immediately gained interest were presented
in September at the Aerial Archaeological Research Group meeting in Aberdeen, Scotland [1,2] The
among archaeologists engaged in remote sensing, who began to explore the potential of this new
dissemination of results from the utilization of ALS in archaeology immediately gained interest
laser-based
among technology.engaged
archaeologists Initiallyin
ALS data sensing,
remote collected who
for other
began purposes
to explore(mainly flood analysis)
the potential of this were
new
utilized, buttechnology.
laser-based soon archaeologists
Initiallystarted to commission
ALS data collected for their ownpurposes
other flight missions to areas
(mainly floodofanalysis)
specific
were utilized, but soon archaeologists started to commission their own flight
archaeological interest [3–6]. Since then, the use of ALS has seen exponential growth in archaeology,missions to areas
of specific archaeological interest [3–6]. Since then, the use of ALS has seen exponential growth
becoming commonplace across the world. This review covers the countries of Denmark, Norway,
in archaeology, becoming commonplace across the world. This review covers the countries of
Sweden, and Finland—an area also known as Fenno-Scandinavia or Fennoscandia. The definition of
Denmark, Norway, Sweden, and Finland—an area also known as Fenno-Scandinavia or Fennoscandia.
Fenno-Scandinavia
The can vary slightly,can
definition of Fenno-Scandinavia butvary
in this context,
slightly, butthe
interm is used to
this context, refer
the termto is
the areatocovering
used refer to
the area covering
Finland plus the Finland plusScandinavian
three the three Scandinavian
countriescountries
Denmark, Denmark, Norway,
Norway, andandSweden
Sweden (see (see
https://en.wikipedia.org/wiki/Fennoscandia with references)
https://en.wikipedia.org/wiki/Fennoscandia with references) (Figure 1). (Figure 1).
Figure 1.
Figure 1. The
TheFenno-Scandinavian
Fenno-Scandinaviancountries.
countries.The
Thegeographical
geographicalpositions of the
positions sitessites
of the presented in this
presented in
article
this are are
article indicated on this
indicated map.map.
on this This isThis
a matter of Eidsvoll:
is a matter Figure 3,Figure
of Eidsvoll: Glumsø 3, Østerskov: Figure 4;
Glumsø Østerskov:
Aränget:
Figure Figure 5Figures
4; Aränget: and 6; 5Kastelli, Kilpisjärvi,
and 6; Kastelli, and Helsinki:
Kilpisjärvi, FigureFigure
and Helsinki: 7; Sundre: Figures
7; Sundre: 8 and
Figure 8 and9;
Figure 9; Gollevarre: Figure 10; and Rapola; Figure 11. Illustration: Magnar Mojaren Gran, NTNU
University Museum.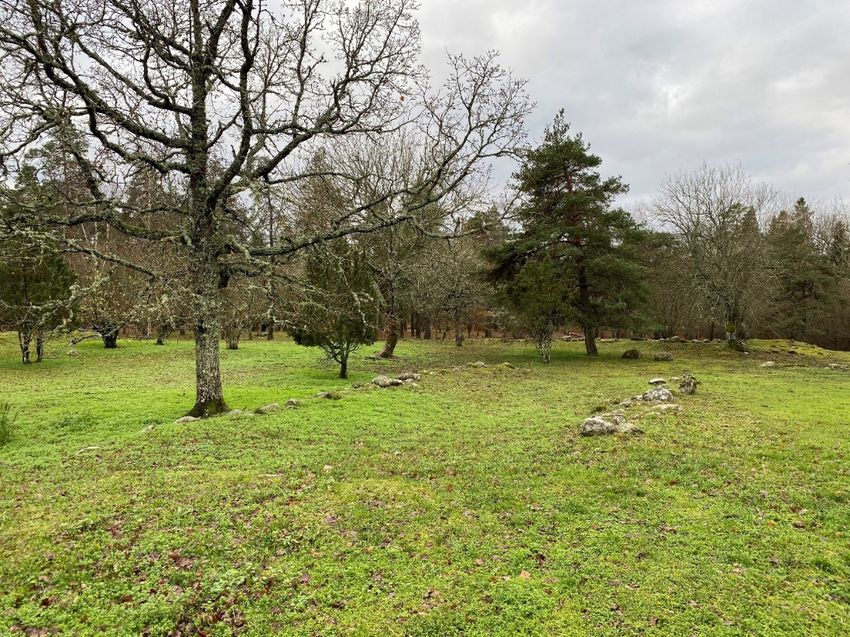
Remote Sens. 2020, 12, 1411                                                                         3 of 41

      In the Fenno-Scandinavian region, the first archaeological ALS campaign was conducted in 2005 in
a forested area measuring 10 km2 in Hedmark, south-eastern Norway [6], with the good results it
yielded leading to several ALS projects across Norway in the following years. The first published
study using ALS data for archaeological purposes in Denmark dates back to 2010 [7], and involved a
presentation of mappings and studies from a project that was conducted over the course of several
years with respect to Celtic Iron Age field systems on the islands of Sjælland, Møn, and Lolland-Falster.
A national 0.45-point/m2 data set was incorporated into the project at a late stage as a source of
comparison to already known field systems, but not in the search for new ones [8,9]. The project was
based on decades of fieldwalking in forested areas by the late archaeologist Viggo Nielsen.
      The pioneering work conducted by Norwegian archaeologists in combination with the growing
application of ALS in other fields shaped early developments in Swedish archaeology. In 2006, the first
tentative steps towards exploring the use of ALS as a tool for cultural heritage management were
taken by the County Administrative Board of Dalarna in collaboration with the Swedish Forest Agency.
The project included ALS data regarding 36,000 hectares in the municipality of Leksand in the county
of Dalarna [10]. The core of the study focused on problems pertaining to the quality of the specific
data set used (as well as the terrain model representations derived from it) in relation to the types
of sites visible in the data, plus data anomalies that might result in misinterpretations. In Finland,
the archaeological application of ALS started in 2009 as open-access data became available from the
Finnish National Land Survey (FNLS). The first archaeological projects were initiated by researchers
from the University of Helsinki and the National Heritage Agency (NHA), the results of which
were published in the following years [11,12]. Owing to fact that point clouds and ALS-generated
digital elevation models (DEMs) were available as open-access data in Finland from the beginning,
no specifically archaeological scanning campaigns were undertaken in the country until 2018 when the
first drone-based ALS was conducted.
      After 15 years of ALS in Fenno-Scandinavian archaeology, we deem it timely to take stock and
evaluate our role in the overall development of ALS archaeology, stating our current position and
indicating some probable future perspectives. Thus, the objective of this article is to collate the use of
archaeological ALS in Fenno-Scandinavia in order to illuminate its contribution to ALS’s employment
in archaeology. It is our aim to share Fenno-Scandinavian ALS with a broader audience by providing a
synthesized overview of the current state of knowledge. This overview will also include ALS research
and development material that has been published in one of the Scandinavian languages or in Finnish,
and consequently has only been available for a limited audience. We anticipate that this review will
advance knowledge in general and perhaps even inspire archaeologists or students without experience
in remote sensing, and thereby potentially broaden the remote sensing community. The reasoning
behind this review paper is further to identify existing gaps and point out some future research
directions. Thus, the aim of the review is:

•     To promote and convey how ALS has been used for archaeological purposes in the
      Fenno-Scandinavian region
•     To put this into an international context
•     To identify knowledge gaps
•     To point out some future perspectives

     The introduction of ALS in archaeology has provided an unprecedented possibility to work with
extremely detailed three-dimensional (3D) digital terrain models (DTMs) that may have considerable
value in archaeology, such as by identifying various monuments and features that are visible above
ground but are hence far unrecognized. If one were to point to a single factor behind the successful
employment of ALS in archaeology, it would be its unequalled capability to penetrate vegetation.
This quality has rendered it possible to make remarkably detailed mappings of entire landscapes from
above, including parts of the landscape that are covered by vegetation. Our knowledge about past
human impacts on forested areas is inadequate compared to that of agricultural landscapes and in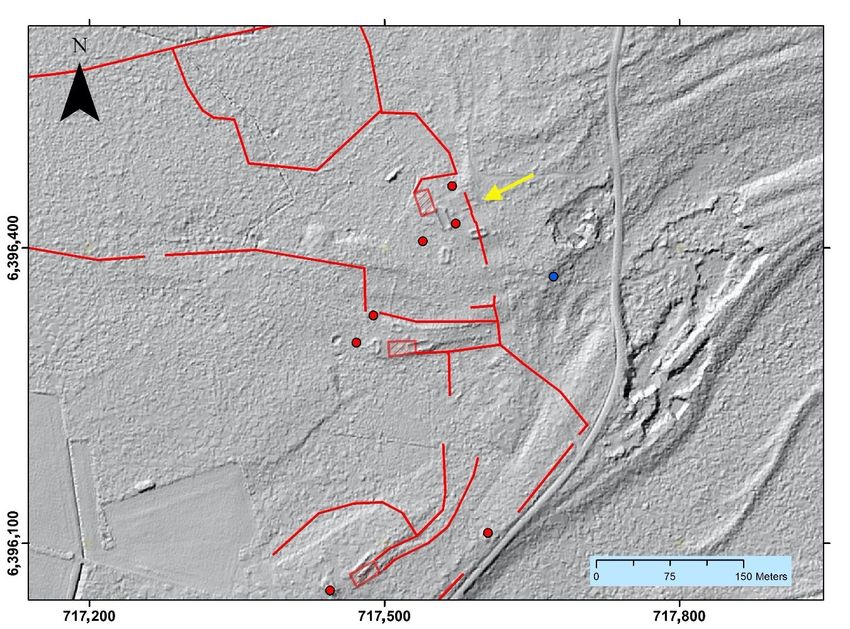
Remote Sens. 2020, 12, 1411                                                                          4 of 41

many countries these areas have received little attention from archaeologists, despite the fact that
cultural features and remains are often better preserved in forests than in areas subjected to agricultural
activities [13,14]. Thus, the main impetus for archaeologists to employ ALS is the potential it offers in
terms of enhanced knowledge about archaeology in forested areas [15–18]. This essentially implies
the improvement of cultural heritage databases to contain all parts of the environment in a more
balanced manner.
     This assertion about a biased dichotomy between forested outfield areas and agricultural land
in terms of past human impacts does not imply that the survey situation in arable land is clear or
adequate. Rather, the point is that the likelihood that visible, elevated, non-buried archaeological
features and monuments are listed in cultural heritage databases is much higher if they are situated
in agricultural landscapes than in outfield areas. This is a result of skewed survey intensity (see
also below). In Sweden, specialized surveys within Skog & historia (Forest & History), a national
project based on job creation measures, have helped to reduce this bias to some extent, with the project
contributing to an additional 200,000 sites in forest areas [19].
     Another major advantage of ALS is the fact that it provides an overview of the landscape and
the sites located within it from a bird’s-eye perspective, which is something that is difficult and
time-consuming to obtain with a worm’s-eye view from the ground. This is valid for general outfield
use but is especially relevant when it comes to extensive sites visible in the data, such as Celtic fields,
an example discussed in further detail below.
     With this as a background, the state of the art concerning the use of ALSin Fenno-Scandinavian
archaeology will be established in the following section through a review of published literature from
the Fenno-Scandinavian region. The review is structured in such a way that results from Norway are
discussed first, followed by achievements from Denmark, Sweden, and Finland. Where a country
is omitted it is because no development has occurred in that country within the specific ALS topic
addressed in the concerned section. The review section will be followed by a summary and discussion
(additionally comprising future perspectives), before some concluding remarks to finish.

2. Literature Review

2.1. Method
      The state of the art in this review was not established through a systematic search of electronic
literature databases; instead, the overview was developed thanks to the authors’ intimate knowledge
of ALS use and of scholars involved in this field in their respective countries. Each author has been
engaged in remote sensing and ALS practice for many years in their respective country. This fact,
in combination with the modest number of archaeologists involved in ALS research and development
in the Fenno-Scandinavian countries, has ensured that the state-of-the art review includes all essential
published contributions to Fenno-Scandinavian ALS employment in archaeology. Thus, this review
can be defined as a meta-analysis rather than an analysis based on systematic database searches.
      Included in this review are published works of any kind, such as papers, book chapters, and reports.
No distinction has been made regarding languages and references: Norwegian, Danish, Swedish,
and Finnish as well as English publications have been included. The time span from the earliest
publication to the latest is 2006 to 2019. Further, there are a few references to Fenno-Scandinavian
publications currently in press.

2.2. ALS Data Availability
     There is reason to believe that the availability of ALS data to the archaeological community is
of importance with regard to its adoption in this discipline. This also pertains to the quality (i.e.,
the resolution) of data. These circumstances vary among the Fenno-Scandinavian countries and a short
account of availability and quality is given here (Table 1).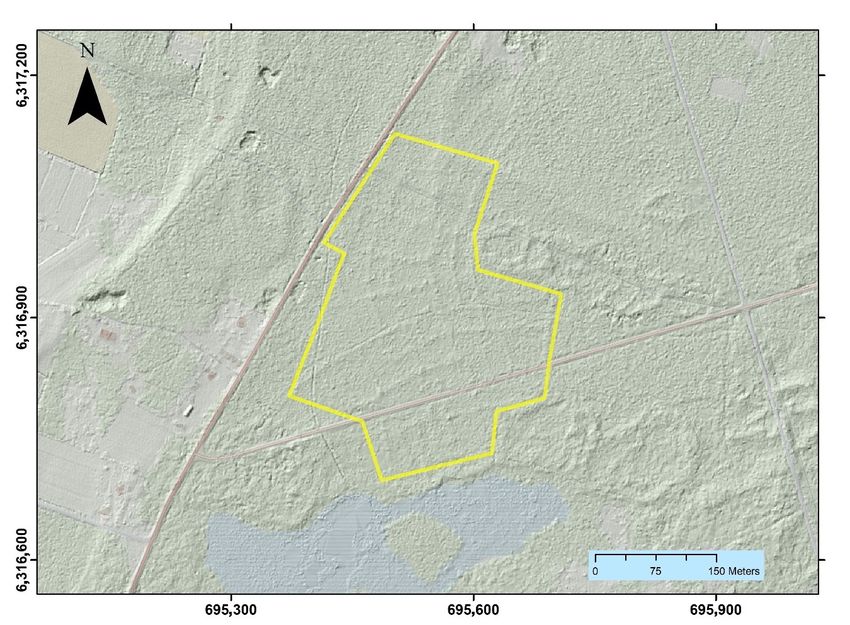
Remote Sens. 2020, 12, 1411                                                                                     5 of 41

      Table 1. Overview of national airborne laser scanning (ALS) coverage in Norway, Denmark, Sweden,
      and Finland. The table also shows when the data were acquired as well as their resolution and availability.

               Country        Acquisition Year        Points/m2        Grid Size (m)       Open Access
              Norway             2011–2013               0.01                10                  Yes
              Norway             2016–2022                 2                  1                  Yes
              Denmark            2005–2007                0.45               1.6                 Yes
              Denmark            2014–2015                4–5                0.4                 Yes
              Sweden             2009–2019               0.5–1                1                  No
              Sweden            2018–present              1–2                 -                  Yes
               Finland            2008–2019               0.5                 2                  Yes

      In Norway, a coarse national height model with a resolution of 10 × 10 m (equaling 1 point/100 m2 )
has been available for many years, but a detailed national elevation model with 2 points/m2 is currently
being prepared. National coverage scanning started in 2016 and is expected to be completed in 2022 [20].
The data are being made freely available on a continuous basis as they are collected [21]. Aside from
mountainous areas mapped by photogrammetry (in total measuring approximately 39,000 km2 ),
the national elevation model is based on ALS (covering in total approximately 286,000 km2 ). Prior to
the launch of the national coverage campaign, many small, medium-sized, and quite large ALS projects
were carried out across the country, mainly by local and regional authorities as well as by various
industries and administrations. Including a pilot project related to the national coverage, approximately
57,000 km2 of Norway were scanned using ALS from 2005 through to 2015 [22]. The greater part of
these data was made available for the public administration and academia.
      In Denmark, two national ALS surveys of the country were performed. The first was commissioned
by the state in 2005, with a 0.45-point/m2 resolution stored in a 1.6-m grid [23]. These data were made
available to all archaeological museums in 2009 and from 2010 to the general public, along with all
other governmental geodata [24]. In 2014, only nine years after the first scan, a new national ALS
survey was conducted, this time with a resolution of 4–5 points/m2 [25]. The hillshades are easily
accessible on web geographic information system (GIS) platforms such as the one provided by the
Danish Geodata Agency [26].
      In Sweden, a national ALS-generated height model has been in production since 2009, with the
major parts of the country scanned by 2013. The work has continued with complementary laser
scanning of areas such as the mountainous inlands [27]. During this period, different products have
been released based on the point clouds. These include raster images at a 2-m resolution produced
from about 2010. The release of a web map service (WMS) for hillshades and slopes produced at a 1-m
resolution from about 2014 and a web coverage server (WCS) from 2015 [28,29] made ALS accessible to
archaeologists with no or limited experience in GIS and LAS data. Public web-based map applications
are easy to access, for example the national database for archaeological sites Fornsök [30] or web
maps provided by the National Forest Agency that allow the user to set sun parameters. In this short
period of time, ALS availability has affected archaeological surveys, landscape analyses, and heritage
management. Since 2018, additional scanning at a higher resolution has focused on forest areas,
producing a point cloud of 1–2 points/m2 [31]. In contrast to previous products associated with costs,
unless the organization is part of a national geodata agreement, these new data are licensed under CC0,
a Creative Commons tool for releasing material into the public domain. It constitutes an interesting
development at the National Mapping Agency, offering some hope for additional open access ALS
products in the future.
      In Finland, the FNLS started producing ALS point cloud data in 2008 and made them available
for universities and other scientific institutions in 2009. Since 2012, all such material has been available
with open access through these organizations’ websites [32]. The FNLS ALS data are unfortunately
rather coarse, with a mean density of 0.5 points/m2 , limiting their usability in archaeology. The FNLS
is currently producing an open-access DEM with 2-m resolution from the ALS data. This is based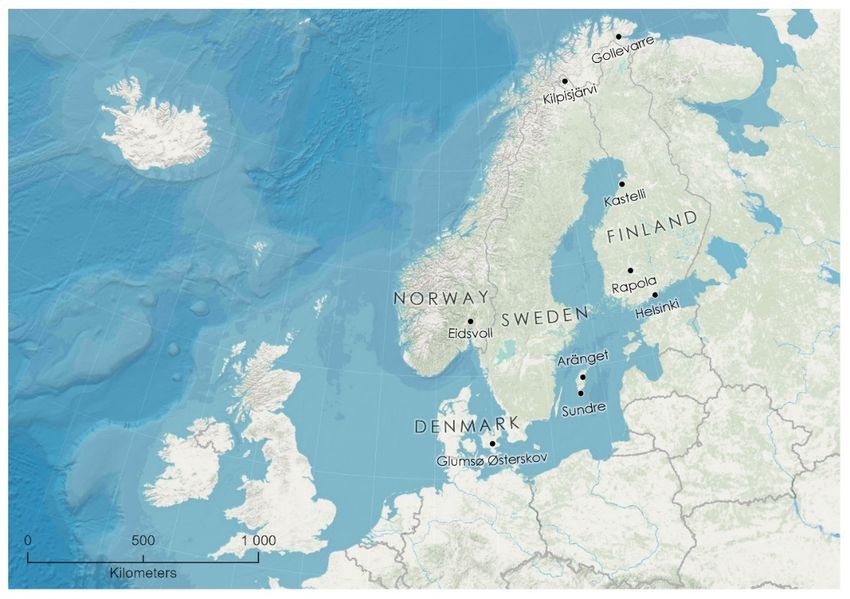
Remote Sens. 2020, 12, x1411
FOR PEER REVIEW 66of
of 41
ALS data. This is based on an ongoing scanning campaign covering the whole country, which should
on completed
be an ongoinginscanning campaign covering
2020. Subsequently, the FNLSthe whole
will country,
launch which should be
new high-resolution completed
ALS mapping. in 2020.
Subsequently, the FNLS will launch new high-resolution ALS mapping.
To recapitulate, there is reason to believe that ALS availability across Fenno-Scandinavia is
To recapitulate,
contributing greatly tothere is reason toexisting
archaeologists’ believetoolkits
that ALS availability
by offering across
detailed Fenno-Scandinavia
spatial data that simplyis
contributing greatly to archaeologists’
were not available or affordable before. existing toolkits by offering detailed spatial data that simply
were not available or affordable before.
2.3. Archaeologies, Topographies, and Landscapes
2.3. Archaeologies, Topographies, and Landscapes
The Fenno-Scandinavian countries are quite diverse in terms of size, topography, and land
The Fenno-Scandinavian countries are quite diverse in terms of size, topography, and land cover.
cover. Most relevant in this regard is the uneven distribution of arable land versus forested areas
Most relevant in this regard is the uneven distribution of arable land versus forested areas (Figure 2).
(Figure 2). This is important because it is reflected in how and where ALS is utilized as a tool in
This is important because it is reflected in how and where ALS is utilized as a tool in archaeology in
archaeology in the different countries, for example, in built up areas, areas of bare rock, glaciers,
the different countries, for example, in built up areas, areas of bare rock, glaciers, heathlands, bogs etc.
heathlands, bogs etc.
Landuse
90
80
70
60
50
40
30
20
10
0
Norway Denmark Sweden Finland
Forest % Agricultural Land % Other types of land use % *
Figure
Figure 2.
2. AAbar
bardiagram
diagramshowing thethe
showing distribution of forest,
distribution agricultural
of forest, land,land,
agricultural and and
otherother
typestypes
of land
of
use.
land use.
In
In addition
additiontotoinland
inland waters, permanent
waters, permanent snow, and glaciers,
snow, the bulk
and glaciers, theofbulk
the land cover
of the land in cover
Norway in
is made is
Norway upmade
of forests, open firm
up of forests, open ground, and and
firm ground, areasareas
withwith
barebarerock, gravel,
rock, gravel,and
andblock
block fields.
fields.
Altogether, these outfield
Altogether, these outfield categories
categories represent
represent more
more than
than 95%
95% of
of the
the land
land cover, of which
cover, of which aa little
little more
more
than
than 37% is forested land, only 4% is agricultural land, and the rest comprises built-up areas [33].
37% is forested land, only 4% is agricultural land, and the rest comprises built-up areas [33].
Both
Both agricultural
agricultural and
and outfield
outfield land
land have
have been
been utilized
utilized by
by humans
humans for various purposes
for various purposes throughout
throughout
history.
history. Today,
Today, aa large
large proportion
proportion of
of the
the visible
visible archaeological
archaeological monuments
monuments and and features
features are
are found
found in in
outfield
outfield areas, while monuments and features situated in farming areas have to a greater extent been
areas, while monuments and features situated in farming areas have to a greater extent been
plough-levelled.
plough-levelled. In InNorway
Norwayall allmonuments,
monuments,features,
features,andandsites
sitesare
areautomatically
automatically protected
protected bybylawlaw if
they predate the Reformation, which took place in 1537. This applies to all kinds
if they predate the Reformation, which took place in 1537. This applies to all kinds of human traces of human traces
irrespective
irrespective ofof their
theirpreservation
preservationcondition.
condition.ForForSami
Sami cultural
culturalheritage,
heritage, legal protection
legal protectionis valid for for
is valid all
monuments, features, and sites predating 1917 (the year of the first Sami national meeting held in
Trondheim in February 1917).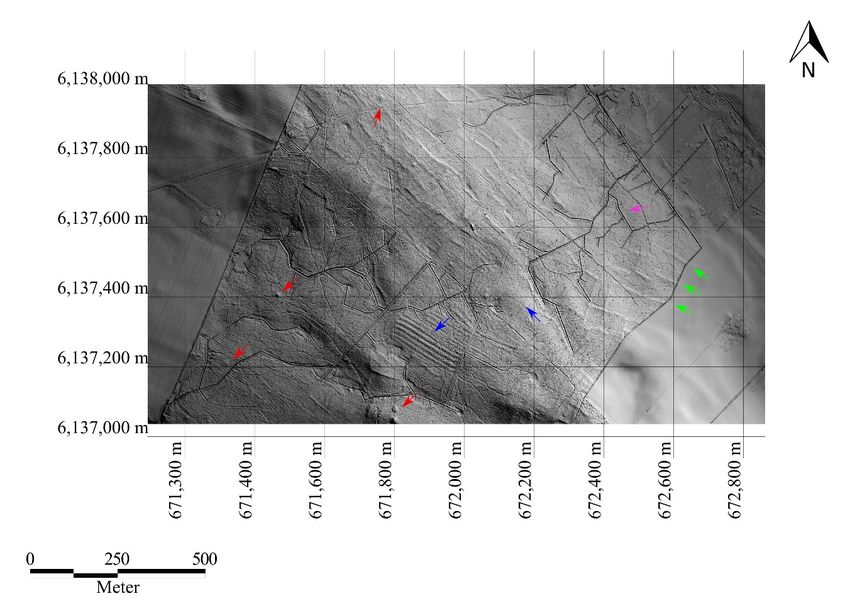
Remote Sens. 2020, 12, 1411                                                                          7 of 41

all monuments, features, and sites predating 1917 (the year of the first Sami national meeting held in
Trondheim in February 1917).
     Unlike the other Fenno-Scandinavian countries, Denmark is almost completely cultivated.
Hence, untouched archaeological features can only be found in a fraction of the country. Historically, large
parts of Denmark were covered by moorland, but since the mid-20th century only 2% of the country
remains as heathland. Forests and plantations today constitute 14%; in 1950, the percentage was only 8%,
of which just 4% comprised old forested areas prior to 1805 [34]. Much of the “new” forest (4%) was planted
on former heathland between 1805 and 1960 [35], potentially on previously untouched landscapes [36].
A rough estimate could be that only 4–5% of Denmark has the potential to host archaeological features
not been subjected to modern cultivation. However, a large number of ploughed earthworks exist in the
cultivated landscape: in particular, plough-levelled Neolithic and early Bronze Age mounds are visible
in considerable numbers. A query in the current Fund &Fortidsminder database shows that more than
90,000 burial mounds are known of in Denmark [37], but the actual number is probably much higher.
Many of the plough-levelled mounds are easily detectable in the ALS studies and thousands are waiting to
be found. Also worth mentioning are the 33,000 scheduled monuments in Denmark [38], mostly comprising
burial mounds. According to Danish law, all visible monuments are protected, and they can all be found in
the ALS surveys, or at least they should be, as some scheduled monuments have been destroyed through
criminal acts. In these cases, digital surface models can provide important documentation for both legal
and scientific purposes.
     Land use data in Sweden vary slightly according to the statistics in question, but according to the
data presented by Statistics Sweden, forest land constitutes about 69% of land use, while agricultural
land use is estimated to represent about 8% [39]. Productive forests represent around 50%, and by no
surprise ALS was used at an early stage within forestry planning, as was also true of other remote
sensing techniques beforehand. In Swedish legislation, archaeological sites and monuments dating
before 1850 are considered protected sites if they were erected using old techniques and are now
permanently abandoned. Those sites that are not protected by the Cultural Heritage Act still need to
be respected by forestry, due to further regulations through the Forestry Act. Well-integrated heritage
management is required in order to ensure that forestry proves sustainable, yet a high percentage of
archaeological features in productive forest land has been lost or exhibits traces of damage. This has
been proved through studies from Norway and Sweden [40]. Finland is the most-forested (over
70%) of the Fenno-Scandinavian countries and, like in Sweden, the use of ALS and other remote
sensing approaches originated from the needs of the forestry industry. Water bodies and wetlands
cover about 15% of the country, while other natural land cover types (such as alpine tundra in the
north) represent approximately 3%; together with forests these types amount to over 90% of the
country [41]. Agricultural land use represents less than 8% and built-up areas about 1% of Finland.
Cultural heritage sites in the country are protected by the Antiquities Act, which imposes no temporal
limits on the protected sites. For instance, (Russian) First World War fortifications and Finnish Civil
War (1918) structures are protected as “Ancient Monuments” by the NHA. The Finnish National Board
of Forestry (FNBF) has made a landmark decision based on the rights of the landowner, extending
protected heritage status to cover all Second World War remains and forestry structures until the
1960s on the lands they control [42]. These sites have, from the mid-20th century, been recognized
by the NHA as “other cultural heritage sites” but are not automatically protected [43]. In the thinly
populated forest and felling regions of northern and eastern Finland especially, vast stretches of land
are archaeologically virtually untouched. ALS-based remote sensing has already demonstrated its
value in directing fieldwork in these often roadless and densely forested areas.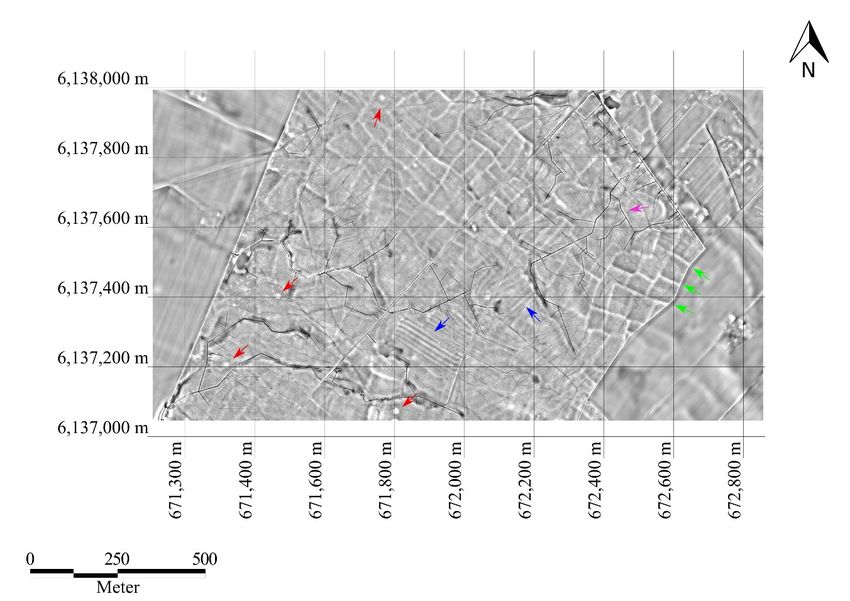
Remote Sens. 2020, 12, 1411 8 of 41
2.4. Identifying, Mapping, and Documenting Cultural Features
From the very start, ALS was regarded as an appropriate technique with excellent potential to
improve overviews and databases holding information about cultural monuments and remains [6].
High-quality registers and records with good geographical coverage are a prerequisite for effective
cultural
Remote Sens.heritage
2020, 12, xmanagement
FOR PEER REVIEWprocedures. However, the biased content of cultural heritage databases, 8 of 41
in which the coverage of outfield and forested land is usually flawed compared to the agricultural
landscape, hampers
agricultural landscape, this goal [44,45].
hampers As previously
this goal [44,45]. As mentioned, this issue isthis
previously mentioned, related
issue toisthe elevated
related to
archaeology
the visible abovevisible
elevated archaeology the ground.
above This skewed This
the ground. situation alsosituation
skewed represents a challenge
also represents that applies to
a challenge
research,
that applies where especially
to research, landscape
where archaeology
especially studies
landscape are vitiated
archaeology by deficient
studies information
are vitiated about
by deficient
past humanabout
information presencepastand practices
human in alland
presence parts of the landscape.
practices in all partsBased
of theon the results
landscape. of extensive
Based on the
archaeological
results survey
of extensive campaigns and
archaeological excavation
survey projects
campaigns andover the years,projects
excavation we know thatthe
over the years,
impacts weof
human
know thatactions on outfield
the impacts areasactions
of human are comprehensive and to
on outfield areas area comprehensive
considerable extent still
and to a visible on the
considerable
landscape
extent (Figureon
still visible 3).the landscape (Figure 3).
Figure
Figure3.3.This
Thisexample
examplefromfromthetheEidsvoll
Eidsvollmunicipality
municipalityshows
showsa asection
sectionofofa aforest
forestholding
holdingaalarge
large
number of cultural features, in this case mainly charcoal kilns that appear as solid and
number of cultural features, in this case mainly charcoal kilns that appear as solid and dotted-lined dotted-lined
circles
circlesspread
spreadacross
across the
the area
area (examples are are indicated
indicatedwith
withred
redarrows).
arrows).AAfewfewburial
burialmounds
moundsappear
appearas
asconvex
convex features
features at the
at the upperupper right-hand
right-hand part (examples
part (examples are indicated
are indicated with
with blue blue arrows).
arrows). The
The presence
presence
of modern of modern
roads and roads and drainage
drainage ditches (herringbone
ditches (herringbone pattern inpattern in the left-hand
the left-hand corner) iscorner) is also
also apparent.
apparent.
The high The highofdensity
density charcoalofkilns
charcoal
in thiskilns
areain this to
is due area
theisnearby
due toEidsvoll
the nearby Eidsvollestablished
ironworks, ironworks,in
established in 1624 and
1624 and operational operational
more more or less
or less continuously continuously
until 1822 [46,47].until 1822 [46,47].
(Illustration: Ole (Illustration:
Risbøl). Ole
Risbøl).
The pioneering studies immediately demonstrated the suitableness of ALS to improve this
situation, where numerous
The pioneering studies cultural features
immediately like charcoalthe
demonstrated pits, iron production
suitableness of ALSsites,
to tar production
improve this
sites, pitfalls, and dwelling sites have been identified and mapped [6,48]. The identified
situation, where numerous cultural features like charcoal pits, iron production sites, tar production features
werepitfalls,
sites, mapped with
and considerable
dwelling geometrical
sites have precision,
been identified andamapped
benefit of ALSThe
[6,48]. thatidentified
also allows for a quality
features were
mapped with considerable geometrical precision, a benefit of ALS that also allows for a quality
assurance of mappings made in pre-global positioning system (GPS) times [48–50]. In addition, these
studies showed how each feature could be measured in detail with substantial accuracy based on a
DTM imported into appropriate software [51,52].
Thus, the efficiency of ALS was evident from the very beginning, but soon the obvious question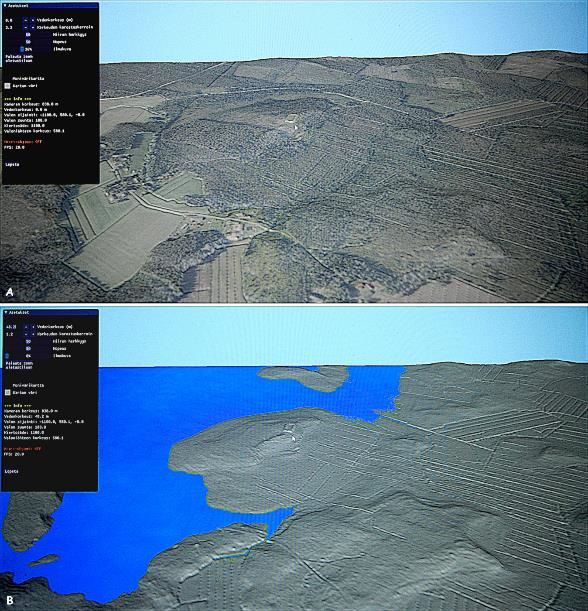
Remote Sens. 2020, 12, 1411                                                                          9 of 41

assurance of mappings made in pre-global positioning system (GPS) times [48–50]. In addition, these
studies showed how each feature could be measured in detail with substantial accuracy based on a
DTM imported into appropriate software [51,52].
       Thus, the efficiency of ALS was evident from the very beginning, but soon the obvious question
arose: To what extent is this a well-qualified approach to identify and map archaeology? The answer to
this question is multifaceted but a general methodological approach has been used following four basic
steps: data acquisition > interpretation > field verification > statistical analysis. This is a commonly
used approach in ALS projects and has led to an aggregation of a quite substantial quantitative data
set over the years. The main objective of these studies was to examine the success of detection and the
effects of a variety of parameters. The impacts of data resolution have been studied at different scales.
In one study, the point densities covering two charcoal pits—one that was well depicted and one that
was poorly depicted—were calculated [6]. In the first Norwegian ALS project from 2005, infrared
orthophotos were commissioned together with the ALS data in order to obtain more information
about the vegetation in the area scanned. Infrared imagery offers the possibility to classify vegetation
based on the amount of chlorophyll. In another study, the point density was examined related to
46 identified and 16 omitted charcoal pits [48,51]. Figures from Hedmark County in Norway show
that detection success varied considerably, from 21% to 80% in three different areas, independent of
the types of cultural features available [49]. Last but not least, an extensive study was conducted
where four experienced archaeologists were given the task of interpreting a large number of DTMs
with point densities of 1, 5, and 10 points/m2 as well as three different levels of DTM smoothing [53].
The experiment was carried out as a randomized complete block design and the analyses were made
using analysis of variance. The study showed a significant improvement in detection success with an
increased point density from 1 to 5 points/m2 and a minor improvement when increasing the point
density to 10 points/m2 . The results also demonstrated that the DTM smoothing did not have any
significant effect on detection success. In sum, what these studies indicated was not only that resolution
matters, but that the effect of point density is not purely exponential, as it has a breaking point at about
5 points/m2 . This has led to a recommendation of using 5-point data when commissioning ALS in
Norwegian archaeology [54]. A further conclusion drawn from these point density studies is that
dense vegetation is a hindrance that prevents laser pulses from reaching all the way to the ground and
it is no use increasing the pulse frequency, as the pulses will be blocked when the canopy is very dense
and impenetrable regardless [49,55].
       Following the point density examinations, a study of the effects on detection success from the size
and the shape of cultural features was undertaken based on the results of the interpretations of the
randomized complete block design mentioned above. The cultural features included were charcoal
kilns, charcoal pits, pitfalls, various pits, house foundations, tar kilns, burial mounds, and hollow
roads [56]. The effects on interpretations based on these features’ physical properties (i.e., differences
in their size, shape, and elevation) were found to show that detection success rates varied considerably.
Unsurprisingly, the figures indicated that large cultural remains with a clear geometrical shape and
large elevation difference were much easier to detect and classify than their smaller counterparts,
especially those without a clear geometrical shape. Further, the study indicated that increasing the
resolution of the DTM first and foremost led to an improved possibility of identifying larger than
smaller structures. Increasing the resolution also provided no help in improving the identification of
irregularly shaped cultural remains.
       As mentioned above, in the first Danish ALS project, Celtic Iron Age fields were studied in a
fairly simple way. In the later investigations from 2015, the usage of ALS data was refined and, on the
island of Fyn, a 2007 DTM of a hillshade was investigated systematically in order to detect more Celtic
fields in the area [34]. Prior to this subsequent study, the number of registered field systems counted
only four sites. After the interpretation of the DTM, the number increased considerably to 45 sites,
all confirmed by ground observations.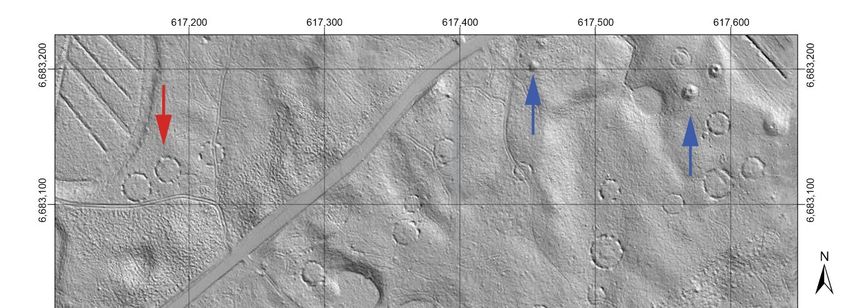
Remote Sens. 2020, 12, 1411                                                                        10 of 41

      A study reviewing the late archaeologist Viggo Nielsen’s many years of mapping the Geelskov
Celtic field system on Sjælland [8] showed that around 80% of the already recorded field system could
be recognized on the DTM without setting foot on the ground [57]. The degree of coherence between
Nielsen’s previous mappings and the recent DTM interpretations could probably have been even
higher if we consider the fact that 60 years separated the two mappings, a passage of time in which
modern forestry may have damaged some of the field systems.
      The first Danish ALS study anchored solely in archaeology was carried out in late October
2010. It was commissioned as part of the aerial archaeological project “An aerial view of the past” in
2010 [36,58]. It represented an early test initiated with the purpose of studying what high-resolution
ALS mapping might add to the detection of archaeological features. The campaign covered 65 km2 in
total, divided into five individual test areas. The test areas included both cultivated landscapes and
plantations. The point densities were adjusted to the test areas, i.e., the open land was mapped with
28 points/m2 , whereas the plantations were covered with 45 points/m2 . In comparison, the available
national scan had only 0.45 points/m2 , so it was obviously an immense improvement in quality.
The results in the open land were somewhat disappointing. While a much more aesthetically pleasing
hillshade was produced, the archaeological findings were limited. The increased level of detail merely
added more visual noise to the model in the shape of modern cultivation traces. A curious finding
was that increased grass height over a medieval moat was detectable. As is well-known thanks to a
century-long history of aerial archaeology, such cropmarks develop over buried features, including
pits, postholes, and moats during times of drought. When vegetation is put under stress, it can result in
visible patterns of variation in color and growth height—known as cropmarks—where buried humid
soil is found [58].
      A much better result was obtained in the Klosterheden plantation, situated in a largely uncultivated
heath landscape. The models based on 0.45 points/m2 from 2007 had poor penetration owing to the
presence of dense spruce trees (no information exists regarding the period of the year in which the scans
were conducted). The high-resolution scan completely opened the view into this virtually fossilized
landscape, even though the increase in newly identified burial mounds and Celtic field system was
limited. This was expected because the area consists of poor and wet soils, unattractive for settlement
and cultivation. However, what was found was the total accumulation of road tracks and sunken
roads, probably from prehistory and onwards. The overall pattern of transport uncovered a shortcut
of the so-called Oldtidsvejen (“Prehistoric Road”). The name refers to a 110-km-long alignment of
no fewer than 1856 burial mounds, interpreted as a prehistoric and historic travel route from east to
west [59]. At the Klosterheden plantation, the prehistoric road makes a detour around the plantation
area. The laser scan revealed that a shortcut of no less than 6 km existed, although this would only have
been feasible in the dry summertime [36]. The conclusion of the test project was that the ultra-high
point density was fruitful in dense spruce tree plantations.
      Alternative visualization methods like local dominance, sky-view factor, and local relief model
have seen limited use in archaeology in Denmark, although they offer considerable potential [57,60],
(Figure 4a,b). Local dominance in particular proved optimal in the very flat Danish terrain.
Indeed, for the detection of cultural features, it is probably even better than the usual hillshade.
However, to date this remains unknown to most Danish archaeologists. The main reason is likely that
the provided hillshade is highly intuitive to the average user. Another factor is that it is a demanding
task to process larger areas, requiring skill and applicable software. Nevertheless, the task has recently
become somewhat easier owing to a local dominance plugin for QGIS, developed by the Department
of Geoscience at Aarhus University (unpublished work).
Remote Sens. 2020, 12, 1411 11 of 41
Remote Sens. 2020, 12, x FOR PEER REVIEW 11 of 41
Figure 4. Upper image (A): An example, shown as a hillshade, of the Danish 2015 national airborne
Figure 4. Upper image (A): An example, shown as a hillshade, of the Danish 2015 national airborne
laser scanning (ALS) study. The Glumsø Østerskov forest, Næstved municipality, covers archaeological
laser scanning (ALS) study. The Glumsø Østerskov forest, Næstved municipality, covers
features such as Neolithic megaliths, a Celtic field system, and traces of Medieval ridge-and-furrow
archaeological features such as Neolithic megaliths, a Celtic field system, and traces of Medieval
cultivation, all superimposed by modern drainage ditches. As the Celtic fields are situated on both
ridge-and-furrow cultivation, all superimposed by modern drainage ditches. As the Celtic fields are
situated on both sides of a ridge the hillshade visualization is not optimal, as some areas are over- or
underexposed, regardless of the direction of light. Lower image (B): Same as above but picturedRemote Sens. 2020, 12, 1411 12 of 41
sides of a ridge the hillshade visualization is not optimal, as some areas are over- or underexposed,
regardless of the direction of light. Lower image (B): Same as above but pictured differently due to
the use of the local dominance visualization method. The Celtic fields are much more visible than in
the ordinary hillshade. Examples of burial mounds are indicated with red arrows, ridge and furrows
with blue, field boundaries with green, and modern drainage ditches with purple. (Illustration: Esben
Schlosser Mauritsen).
A recent study from the Forestry Research Institute of Sweden (Skogforsk) has examined the use of
ALS for heritage management within the forestry sector [61]. The study involved three interpreters with
different backgrounds: an archaeologist, a forester, and a civil engineer in environmental techniques.
They were given the task of interpreting ALS data consisting of terrain models in hillshades and
multiple hillshades generated from national ALS data interpolated to +1 m. The test focused on
different geographical areas and the results of the interpretations were validated in the field. The study
concluded that the data were useful with regard to detecting sites, but that training is necessary before
they might be successfully used by forestry planners.
In Sweden, early studies mainly focused on the use of ALS to identify, record and map sites.
These studies usually followed the four basic steps mentioned above. In 2011, a survey was
undertaken in northern Sweden as part of the larger collaborative project “Skogens kulturarv i
Kvarkenregionen2” [62]. This represented one of the earliest projects in Sweden using ALS on a
more operative basis as part of a wider cultural heritage project. A field evaluation in the first year
showed that 75% of the features identified in the ALS data were confirmed in the field as true positives.
The majority of the identified features were trapping pits, charcoal kilns, clearance cairns, and tar kilns.
House foundations proved difficult to detect [63]. Using ALS data during or prior to archaeological
surveys has constituted a growing trend among archaeologists since the release of low-resolution ALS
data by the Swedish Mapping Agency. In the county of Jämtland, ALS data were used in a test in
2013 as well as in several surveys from 2014, reporting satisfying results and proving cost-efficient [64].
In many of the mid- and northern Swedish surveys using national ALS data in the first part of the
2010s, there was a clear bias concerning the type of sites most frequently identified in the data, usually
being skewed towards features such as charcoal kilns and trapping pits. In a survey in Skogs parish in
the county of Hälsingland, nearly 100% of the charcoal kilns indicated in the terrain models based
on national ALS data were verified through fieldwork. Using ALS data with other resources such
as orthophotographs has been deemed especially useful. Furthermore, combining ALS data with
historical maps has enabled deeper insights into the historical landscape [65].
In 2014 and 2015, the Swedish National Heritage Board looked into the possibilities of using
remote sensing techniques to correct the spatial data quality in the digital archaeological sites and
monuments record (Figures 5 and 6). This included exploring whether corrections could be made
based on automated design engineering. Key reasons behind the project were the growing demand for
accurate site data and the upcoming launch of a new cultural heritage database, the Kulturmiljöregister.
The timing of the project was also coherent with the release of new products built on national ALS
data. The geo-consultancy firm Metria was contracted to examine the possibilities and the result was
presented in two reports [66,67]. The study concluded that automatic approaches at the time were
technically demanding and would be accompanied by a significant degree of uncertainty compared to
manual interpretation and editing. The report further suggested that a GIS platform combining remote
sensing-based data with other geographical data (e.g., historical maps and geological information)
would improve manual correction and provide advantages to cultural heritage management in
general [66]. There have been no further moves to study remote sensing applications for site correction
or cultural heritage management by the Swedish National Heritage Board. How ALS can be utilized to
improve the accuracy of the geographical positioning of previously mapped cultural features has been
demonstrated in Norwegian publications [49,50].Remote Sens. 2020, 12, 1411 13 of 41
Remote Sens. 2020, 12, x FOR PEER REVIEW 13 of 41
Figure5.5. Aränget
Figure Aränget (Bäl
(Bälparish,
parish,Gotland).
Gotland). Iron-Age
Iron-Age house
house foundations
foundations andand stone
stonefences
fencesenclosing
enclosing
farmland.Orange
farmland. Orangerectangles
rectangles and
and redred dots
dots showshow
the the geographical
geographical location
location on maps
on maps in theinnational
the national
sites
sitesmonuments
and and monuments
record.record. It is obvious
It is obvious that theythat they aall
all have haveoffset
slight a slight offset
to the to the west-northwest
west-northwest compared
tocompared
their moretoprecise
their more precise
location on thelocation on the ALS-generated
ALS-generated (digital
(digital elevation modelelevation
(DEM).model (DEM).
The yellow The
arrow
yellowthe
marks arrow marks
location thehouse
of the location of the house
foundation foundation
in Figure in Figure
6. The image 6. The
illustrates theimage illustrates
importance of ALSthe
importance
data of site
for spatial ALScorrection.
data for spatial site correction.
Coordinates: SWEREF99 Coordinates: SWEREF99
TM (Illustration: Daniel TM. © Lantmäteriet
Langhammer). ©
Geodatasamverkan.
Lantmäteriet Geodatasamverkan.
Few Swedish studies have used high-resolution ALS data for comparison with low-resolution
national coverage data. An interesting contribution was presented in a paper from 2019, focusing on
the detection of cultural heritage sites in boreal forests. The study area was Krycklan, located
in north-western Sweden. The study compared the national ALS data set with a density of
1.1–1.3 points/m2 (the density in the specific area) with a data set with an average of 13 points/m2 .
The DTM grid used 0.4 m for the higher-resolution data and 0.7 for the lower-resolution data [68].
Unsurprisingly, the higher-resolution data exhibited greater detection success concerning certain types
of sites, such as charcoal kilns and tar production sites, as proved by the earlier tests in Norway
mentioned above. Some features, like subtle ruins from dwellings, were rather difficult to identify
successfully even with the higher-resolution data, while in the lower-resolution data they were almost
unrecognizable [68]. Studies of this kind are interesting, but it is important to recognize that the
transfer value to other geographical areas is limited because the outcome is dependent on a series of
parameters, such as period of flight, local topography and vegetation. If the same study were to be
conducted in an environmentally distinct county like Gotland, for example, good results would be
expected in terms of identifying very different features, such as house foundations from the Roman
Iron Age as well as prehistoric field systems.Figure 5. Aränget (Bäl parish, Gotland). Iron-Age house foundations and stone fences enclosing
farmland. Orange rectangles and red dots show the geographical location on maps in the national
sites and monuments record. It is obvious that they all have a slight offset to the west-northwest
compared to their more precise location on the ALS-generated (digital elevation model (DEM). The
yellow arrow marks the location of the house foundation in Figure 6. The image illustrates the
Remoteimportance
Sens. 2020, 12,
of1411
ALS data for spatial site correction. Coordinates: SWEREF99 TM. © Lantmäteriet14 of 41
Geodatasamverkan.
Figure 6. Aränget (Bäl parish, Gotland). The house foundation (east-west) located furthest to the
northeast, outlined by the stone walled foundation. Its location is marked by a yellow arrow in Figure 5.
In the background another of the house foundations (northwest-southeast) is slightly visible. This type
of house foundation generally dates from between AD 200 and 600 based on excavation, with a few
exceptions extending the timespan. Photo: Daniel Langhammer, 2019.
Archaeologists in Finland started applying ALS in their work immediately after data became
available, although initially the issue of data availability defined where ALS-based work could be
undertaken. FNLS scanning campaigns commenced in areas that were at risk, such as coastal flood-risk
regions, or areas with special infrastructural needs, such as the Helsinki metropolitan area. Owing to
data availability, the 20th-century military structures on the southern coast became the focus of the first
ALS-based studies. The initial publications concentrated on describing the potential of ALS data and
the various methods that could be used to visualize and analyze them, with various kinds of military
camps, defensive lines, and Stone Age sites operationalized as examples [11,12,69]. As mentioned
above, the FNLS open-access data are rather coarse, with point clouds of about 0.5 points/m2 and 2-m
DEMs based on those. Typically, archaeologists have used point cloud data to interpolate 1-m-resolution
DTMs for their study areas, before visualizing these further with other methods, such as sky-view
factor and local relief models [69], (Figure 7). In some areas, Finnish archaeologists have been able
to utilize more detailed ALS data available through cities and municipalities, universities, and the
FNBF, but these high-resolution data are limited in terms of their spatial extent. Recent large-scale
archaeological survey projects carried out by the FNBF in forest regions in 2010–2015 as well as the
Swedish–Finnish project “Skogens Kulturarv i Kvarkenregionen” employed FNLS ALS data across
large landscapes to successfully direct field studies [70,71].
After the first papers from 2010–2013, no specific methodological or technical studies or
new developments were made in Finnish ALS use for several years. The ALS data have
been mostly employed implicitly as just another open-access data set that can direct fieldwork.
However, in 2018–2019 an international team working in northernmost Finland started exploring the
potential of semi-automated site recognition and various types of remote sensing data to enhance the
potential of ALS data per se (see below) [72].Remote Sens. 2020, 12, 1411 15 of 41
Remote Sens. 2020, 12, x FOR PEER REVIEW 15 of 41
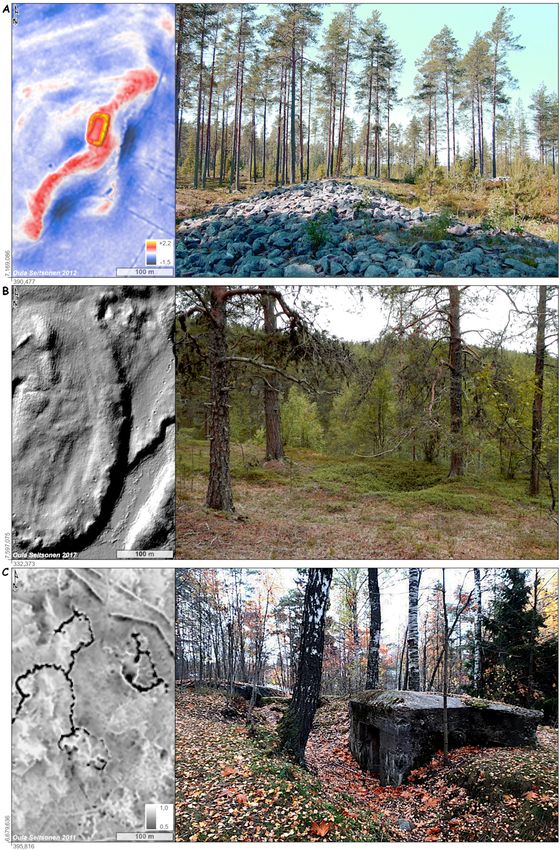
Figure 7. Visualizations and photographs of selected sites (in Finland) based on the open-access ALS
Figure 7. Visualizations and photographs of selected sites (in Finland) based on the open-access ALS
data from the Finnish National Land Survey (FNLS). (A) Local relief model of a Late Neolithic
data from the Finnish National Land Survey (FNLS). (A) Local relief model of a Late Neolithic “Giant’sRemote Sens. 2020, 12, 1411 16 of 41
Church” structure and adjacent cairns and housepits at Kastelli (Photograph public domain, Wikimedia
Commons/Estormiz). “Giant’s Churches” are megalithic drystone-walled ritual and/or defensive
structures from the Finnish western coast. Note the “gateways” visible on the perimeter wall (see also
Figure 11). (B) Multi-directional hillshade of a Sami pitfall trap system near Kilpisjärvi. (C) Sky-view
factor presentation of a First World War trench system near Helsinki (EPSG:3879 ETRS89/GK25FIN).
(Illustration: Oula Seitsonen).
2.5. ALS and Cultural Heritage Management
Many archaeologists are involved in cultural heritage management and are occupied with what is
termed development-led archaeology or rescue archaeology. Their key responsibilities are to mitigate
the negative consequences of development projects by safeguarding important archaeological sites
and monuments from intervention and to secure archaeological source material through excavations.
This requires good archaeological records combined with archaeological surveys as part of the cultural
heritage management measures carried out ahead of development enterprises.
The employment of advanced technology has become increasingly common in cultural heritage
management in recent decades, necessitating evaluation of its outcomes and further potential. In 2013,
the Norwegian Public Roads Administration funded a pilot project with the aim of assessing the use
of advanced archaeological methods and their potential use in connection with road development
projects [73]. The purpose was to consider the extent to which such methods can replace (or more
likely supplement) conventional survey methods as well as how best to streamline the surveys without
reducing the quality of the cultural heritage management process. Planning authorities and developers
often obtain access to crucial information relevant to land use at a late stage in the process, creating
unpredictability in relation to progress and cost.
The pilot project involved an assessment of the following remote sensing techniques: satellite
imagery, aerial photography, ALS, hyperspectral scanning, and geophysical survey methods.
These were evaluated in terms of their relevance, utility, and efficiency in relation to parameters
such as landscape type, archaeological features, and management plan level. Such relatively new
non-invasive methods have the potential to cover large areas in a short period of time, an important
quality at a primary plan level (see also [49,50]). ALS is especially beneficial in forest areas, where
due to its vegetation-penetrating properties it is very suitable for mapping visible cultural features.
Furthermore, it can be used advantageously in other types of landscapes, such as mountain areas
and wetlands. It has been argued that ALS is not a perfect substitute for conventional fieldwork,
but it can be a priority tool for selecting particularly interesting areas, increasing the efficiency of the
fieldwork [73]. Using this technology, one can attain a rough overview of the cultural heritage stock in
a large area in a short time and with a high degree of safety and precision. Thus, one has a good basis
for directing the fieldwork and doing it more effectively.
In the pilot project report, it is emphasized that it is not the particular method or the individual
data set that will provide the answers, but rather overall access to information from the set of different
methods. Information about archaeological heritage can be collected in a GIS and geodatabase that
provides a better basis for making overall assessments and thus well-qualified decisions. The importance
of ensuring greater predictability regarding land use and possible conflicts with archaeological sites’
cultural heritage is the goal. For the beneficiary, the main benefit is not primarily the efficiency of the
fieldwork, but predictability and getting the necessary overview as early as possible.
Although substantial knowledge has been accumulated on the use of digital archaeology, there is
a need to conduct systematic comparative studies of the actual efficiency of different methods with
respect to the detection of archaeological traces and their cost-effectiveness. No projects have been
carried out to highlight the benefits of integrated approaches. There is a need to move on from good
but scattered single results to overall examinations that adopt the entire archaeological toolbox.
County administrative boards are the main agencies that administer, manage, and monitor
archaeological sites and monuments in Sweden. There are 21 individual agencies, one for eachYou can also read