The Commitment to Development Index: 2021 Edition - Methodological Overview Paper
←
→
Page content transcription
If your browser does not render page correctly, please read the page content below

The Commitment to Development
 Index: 2021 Edition

 Methodological Overview Paper
 September 2021

 Authors:
 Lee Robinson, Beata Cichocka, Euan Ritchie, Ian Mitchell

 Affiliation
 Center for Global Development

 Contact
 lrobinson@cgdev.org
 bcichoka@cgdev.org
INTRODUCTION __________________________________________________________________ 1

THE COMMITMENT TO DEVELOPMENT INDEX ____________________________________ 1
 The CDI Approach _________________________________________________________________ 1
 The Conceptual Evolution of the CDI ___________________________________________________ 2

CDI LATEST DEVELOPMENTS _____________________________________________________ 3
 Broader Country Coverage ____________________________________________________________ 3
 A New Structure ____________________________________________________________________ 6
 Income Weighting: Giving Credit for Policies that Benefit the Poorest ____________________________ 7
 Simpler ___________________________________________________________________________ 9
 New Measures ____________________________________________________________________ 10
 Income-Adjusted Scores _____________________________________________________________ 10
 New Website _____________________________________________________________________ 11
 What’s New in 2021 ________________________________________________________________ 12
 Health Component _______________________________________________________________ 12
 Methodological changes ___________________________________________________________ 12
 Greenhouse Gas Emissions Embodied in Trade _______________________________________ 12
 Migrant Inflow ________________________________________________________________ 12
 Fishing Support _______________________________________________________________ 12
 Analysis Tool ___________________________________________________________________ 13

APPROACHES TO MISSING DATA ___________________________________________________13
 Data Sources and Cut-Off Year________________________________________________________ 13
 Three Standard Approaches to Data Gaps________________________________________________ 13
 Note on Landlocked Countries ________________________________________________________ 14
 Which Countries Fare Worst on Transparency? ____________________________________________ 15

ISSUES ACROSS COMPONENTS _____________________________________________________15
 Terminology ______________________________________________________________________ 15
 Weighting and Scaling _______________________________________________________________ 16
 Scoring Direction __________________________________________________________________ 17
 Time Series and Back-Calculation ______________________________________________________ 17

THE FULL CDI STRUCTURE________________________________________________________17

DEVELOPMENT FINANCE COMPONENT ___________________________________________19
 Why Is Development Finance Important for Development? __________________________________ 19
Structure_________________________________________________________________________ 19
 Development Finance _______________________________________________________________ 19
 Development Finance Quantity______________________________________________________ 20
 Finance for International Development Structure and Approach ___________________________ 20
 Finance for International Development Sources and Coverage_____________________________ 21
 Development Finance Quality _______________________________________________________ 22
 Poverty Focus_________________________________________________________________ 22
 Fragility Focus ________________________________________________________________ 22
 Transparency _________________________________________________________________ 23
 Tied Status ___________________________________________________________________ 24
 Country Ownership ____________________________________________________________ 24
 Multilateral Quality _____________________________________________________________ 26
 Further Reading ___________________________________________________________________ 27

INVESTMENT COMPONENT ______________________________________________________ 28
 Why Are Investment and Financial Transparency Important for Development? ____________________ 28
 Structure_________________________________________________________________________ 28
 Investment Standards _______________________________________________________________ 29
 Anti-corruption _________________________________________________________________ 29
 Business and Human Rights ________________________________________________________ 29
 Natural Resource Governance_______________________________________________________ 29
 Financial Secrecy___________________________________________________________________ 30
 Limiting Banking Secrecy __________________________________________________________ 30
 Extractive Country-by-Country Reporting ______________________________________________ 31
 Public Statistics __________________________________________________________________ 31
 Anti–Money Laundering ___________________________________________________________ 31
 Automatic Exchange of Information __________________________________________________ 31
 Bilateral Treaties _________________________________________________________________ 32
 International Legal Cooperation _____________________________________________________ 32
 Beneficial Ownership _____________________________________________________________ 32
 Investment Agreements _____________________________________________________________ 33
 International Investment Agreements _________________________________________________ 33
 Further Reading ___________________________________________________________________ 34

MIGRATION COMPONENT _______________________________________________________ 35
 Why Is Migration Important for Development?____________________________________________ 35
 Structure_________________________________________________________________________ 35
 Migrants _________________________________________________________________________ 35
Immigrant Inflow ________________________________________________________________ 35
 Female Immigrants _______________________________________________________________ 36
 Refugees _________________________________________________________________________ 36
 Refugee Hosting _________________________________________________________________ 37
 Integration and Protection ___________________________________________________________ 37
 Integration Policies _______________________________________________________________ 37
 International Migration Conventions __________________________________________________ 37
 Further Reading ___________________________________________________________________ 38

TRADE COMPONENT_____________________________________________________________ 39
 Why Is Trade Important for Development, and for All of Us? _________________________________ 39
 Structure_________________________________________________________________________ 39
 Tariffs __________________________________________________________________________ 40
 Tariff Averages __________________________________________________________________ 40
 Poverty-Weight Average Tariffs _____________________________________________________ 40
 Average of All Trading Partners _____________________________________________________ 41
 Tariff Peaks ____________________________________________________________________ 41
 Agriculture _______________________________________________________________________ 41
 Agricultural Subsidies _____________________________________________________________ 41
 Services _________________________________________________________________________ 42
 Services Trade Restrictiveness _______________________________________________________ 42
 Logistics _________________________________________________________________________ 39
 Trade Logistics __________________________________________________________________ 39
 Further Reading ___________________________________________________________________ 39

ENVIRONMENT COMPONENT____________________________________________________ 40
 Why Is Protection of the Environment Important for Development, and for all of Us? ______________ 40
 Structure_________________________________________________________________________ 41
 Climate Action ____________________________________________________________________ 41
 Greenhouse Gas Emissions ________________________________________________________ 41
 Fossil Fuel Production ____________________________________________________________ 42
 Fossil Fuel Support _______________________________________________________________ 42
 Carbon Pricing __________________________________________________________________ 42
 Sustainable Fisheries ________________________________________________________________ 43
 Fishing Subsidies ________________________________________________________________ 43
 International Conventions____________________________________________________________ 44
 International Environmental Conventions ______________________________________________ 44
 Further Reading ___________________________________________________________________ 44
HEALTH COMPONENT ___________________________________________________________ 45
 Why is health important for development, and for us all? _____________________________________ 45
 Structure_________________________________________________________________________ 45
 Prevention of Disease _______________________________________________________________ 46
 Antimicrobial Resistance ___________________________________________________________ 46
 Human Consumption ___________________________________________________________ 46
 Livestock Consumption _________________________________________________________ 46
 AMR Governance _____________________________________________________________ 46
 Vaccination Coverage _____________________________________________________________ 47
 Measles (MCV2) _______________________________________________________________ 47
 Measure: Diphtheria, tetanus toxoid, and pertussis (DTP3) _______________________________ 47
 Pandemic Preparedness____________________________________________________________ 47
 Pandemic Preparedness__________________________________________________________ 48
 International Health Collaboration and Standards __________________________________________ 48
 Participation in International Treaties, Codes, and Bodies __________________________________ 48
 Health Treaties, Codes, and Memberships ____________________________________________ 48
 Global Trade in Health-related Goods___________________________________________________ 49
 Tobacco Trade & Supply Chains _____________________________________________________ 49
 Regulation of Tobacco Supply Chains _______________________________________________ 49
 Export Restrictions on Food and Medical Goods ________________________________________ 49
 Measure: Number of product restrictions ____________________________________________ 50
 Measure: Duration of implemented export measures since January 2020 _____________________ 50
 Further Reading ___________________________________________________________________ 51

SECURITY COMPONENT _________________________________________________________ 52
 Why Is Security Important for Development? _____________________________________________ 52
 Structure_________________________________________________________________________ 52
 Peacekeeping _____________________________________________________________________ 52
 Peacekeeping Contributions ________________________________________________________ 52
 Financial Contributions __________________________________________________________ 52
 Peacekeeper Contributions _______________________________________________________ 53
 Female Peacekeepers _____________________________________________________________ 53
 Sea Lanes Protection ______________________________________________________________ 54
 Arms Trade ______________________________________________________________________ 54
 Arms Trade Volume ______________________________________________________________ 54
 Methods for Handling Incomplete National Data on Arms _______________________________ 55
 Conflict Potential of Arms Exports ___________________________________________________ 55
Method for Deriving Importer Weights ______________________________________________ 56
 Participation in Security Conventions ___________________________________________________ 57
 International Security Conventions ___________________________________________________ 57
 Further Reading ___________________________________________________________________ 57

TECHNOLOGY COMPONENT _____________________________________________________ 58
 Why Is Technology Creation and Diffusion Important for Development? ________________________ 58
 Structure_________________________________________________________________________ 58
 Government R&D _______________________________________________________________ 59
 Tax Incentives for Business R&D ____________________________________________________ 59
 Technology Transfers and Diffusion ____________________________________________________ 59
 Foreign Students_________________________________________________________________ 59
 Female Students _________________________________________________________________ 60
 Research Collaboration ____________________________________________________________ 60
 Intellectual Property Rights _________________________________________________________ 61
 Limitations and Issues_______________________________________________________________ 61
 Further Reading ___________________________________________________________________ 62
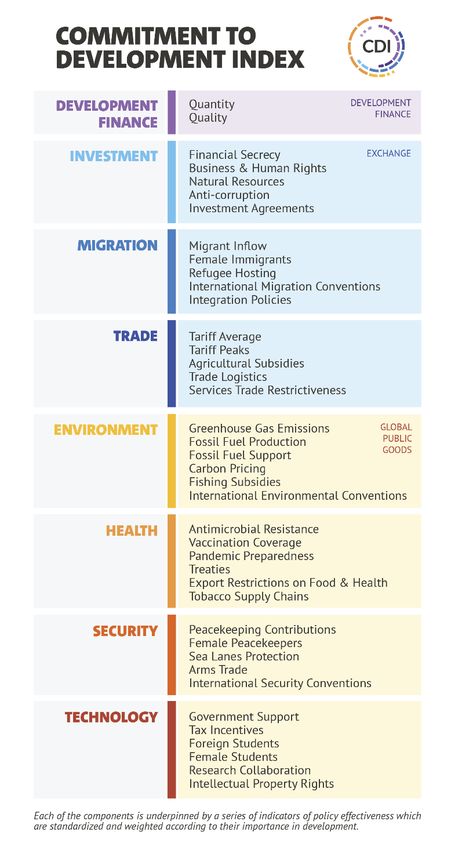
Introduction
This document describes the methodology used to calculate the Commitment to Development Index (CDI).
The Index comprises eight components – Development Finance, Investment, Migration, Trade, Environment,
Health, Security, and Technology. Each component is underpinned by a series of indicators of policy
effectiveness in these areas, which are standardised and weighted according to their importance in development.

The CDI aims to provide comparable information to policymakers on how their countries’ policies can
accelerate development. It provides a comparable quantitative measure of effort in policies that support or inhibit
development, especially in areas beyond “aid.”

This methodology of the CDI should enable users to understand how the Index is calculated and can be used
alongside the workbooks, which make the calculations publicly available.

After a fuller description of the Index, including an explanation of some of the overarching principles it uses,
this document describes why each component is important to development, then sets out how that component
is calculated.

The Commitment to Development Index
The Center for Global Development (CGD) launched the 16th edition of the Commitment to Development
Index (CDI) in September 2018. Begun in 2003, the CDI is CGD’s flagship product. The Index was created by
Nancy Birdsall and David Roodman and is based on evidence on what matters to development. It uses
quantitative measures to assess and compare the policy efforts of high-income countries to promote the
development of poorer countries. Its aim is to start a discussion about how policies in these areas affect and
can do more for development, especially for the poorest countries, and it has been successful in getting
governments to think more broadly about development.

For example, the Index has recently featured in development strategies in the UK and the Netherlands; has
formed the basis of a number of discussions at ministerial level and also attracts widespread media coverage, in
2018 featuring in more than 180 media outlets in 18 countries and seen by more than 1.85 million readers
online.

The CDI Approach
The CDI has a structure with four levels of increasing detail. At the top level, countries get an overall CDI
score, which is composed of the country’s scores across eight policy areas, which we term components.
Components are the level at which most discussion and scoring becomes policy relevant, as these represent the
policy areas we identify as mattering most to development. Each component, in turn, has its score determined
by scores in a number of indicators, and these are underpinned by measures.

The eight components are as follows:
 • Development Finance (including “aid” and concessional lending)
 • Investment
 • Migration
 • Trade
 • Health
 • Environment
 • Security
 • Technology

 1
Where appropriate, scores on a component are adjusted by different measures, such as population or economy
size (using GDP/GNI) in order to discern policy effort relative to each country’s capabilities. In other words,
the CDI rates countries in ways that allow normative comparisons, which usually means adjusting for size.
Denmark cannot be expected to give as much foreign aid as Japan, whose economy is 25 times larger. Similarly,
Switzerland cannot be expected to import as much from developing countries as the United States, but it could
have trade barriers as low, which is one of the things the trade component measures.

The CDI focuses on measuring policy effort to enable policymakers to act, though in some places it captures
policy outcomes, such as the amount of greenhouse gases emitted.

The CDI aims to assess the most current policies but, in practice, because of lags in official data, most
information used is lagged by one or two years. While we collect only publicly available data and are unable to
provide data ourselves, we are committed to collecting the most recent data.

The Conceptual Evolution of the CDI
This paper describes the latest CDI methodology. It builds on background research done originally for each of
the seven policy areas:
 • Trade: Roodman 2007 1; Cline 2004 2; Moran 2007 3
 • Migration: Grieco and Hamilton 20044; Lowell 2006 5
 • Security: O’Hanlon and de Albuquerque 2003 6
 • Technology: Maskus 2005 7
 • Environment: Cassara and Prager 20058
 • Finance (now renamed Investment): Janský 20139

In addition, in the 2021 CDI, we add a Health component reflecting feedback in the CDI review 2018-20 (see
below); and building on the inclusion of global health security measures in the 2020 edition, which itself drew on
the approach of the Global Health Security Index. We are open to feedback on whether this component is
measuring the most important policy efforts towards improved global health.

1 ‘Production-Weighted Estimates of Aggregate Protection in Rich Countries toward Developing Countries’, 1 Jun. 2007,
https://econpapers.repec.org/paper/cgdwpaper/66.htm. Accessed 4 Sep. 2017.
2 Trade Policy and Global Poverty, 1 Jun. 2004, https://www.cgdev.org/publication/9780881323573-trade-policy-and-global-poverty.
Accessed 4 Sep. 2017.
3 ‘Rationale for Components of a Scoring System of Developed-Country Support for International Investment Flows to Developing
Countries: Summary of Changes in the Index of Developed-Country Support for International Investment Flows to Developing
Countries’,
https://www.researchgate.net/publication/267717528_Rationale_for_Components_of_a_Scoring_System_of_Developed_Country_
Support_for_International_Investment_Flows_to_Developing_Countries_Summary_of_Changes_in_the_Index_of_Developed_Cou
ntry_Support_for_In. Accessed 4 Sep. 2017.
4 ‘Realizing the Potential of Migrant "Earn, Learn, and Return" Strategies: Does Policy Matter?’, Jan. 2004,
https://www.researchgate.net/publication/242085980_Realizing_the_Potential_of_Migrant_Earn_Learn_and_Return_Strategies_Do
es_Policy_Matter. Accessed 9 August 2021.
5 ‘An Evaluation of an Extended Index on Pro-development Migration Policies’,
https://www.cgdev.org/doc/cdi/2006/lowellMigration.pdf. Accessed 4 Sep. 2017.
6 O’Hanlon, Michael and Adriana Lins de Albuquerque (2004), “Note on the Security Component of the 2004 CDI,” Center for
Global Development, Apr
7 ‘Components of a Proposed Technology Transfer Index: Background Note’
8 ‘An Index of Rich-Country Environmental Performance’.
http://citeseerx.ist.psu.edu/viewdoc/download?doi=10.1.1.501.4871&rep=rep1&type=pdf Accessed 17 June 2017.
9 ‘Illicit Financial Flows and the 2013 Commitment to Development Index’, 16 Dec. 2013,
https://www.cgdev.org/publication/illicit-financial-flows-and-2013-commitment-development-index Accessed 4 Sep. 2017.

 2
This methodology has been refined over the years with recurrent updates including with a series in 2012 on
Europe’s commitment to development. The 2020 edition reflected a substantial review, which included
numerous discussions with policymakers, and three independent academic reviews. The 2021 method builds
on the substantial review process done previously to implement smaller methodological improvements, but
largely follows the same logic as the 2020 CDI.

CDI Latest Developments
The CDI has continuously evolved with small methodological changes and the inclusion of additional countries.
But starting after the 2018 publication, there was a holistic review process to look fundamentally at how the
CDI could be updated to reflect current development thinking.

This has been an extensive process of consultation, research, and modelling. The first stage of this process was
to commission the expertise of three expert reviewers: Pierre Jacquet, president of the Global Development
Network; Stephany Griffith-Jones, financial markets director at the Initiative for Policy Dialogue at Columbia
University; and Ravi Kanbur, T.H. Lee Professor of World Affairs, international professor of applied
economics, and professor of economics at Cornell University. We asked these experts to review the Index and
provide recommendations on how they thought it could be improved. Specifically, CGD asked the experts
these questions:

 • Are we measuring the policies that matter most to development, and how can we improve the CDI in
 terms of measured actors and policies?
 • If you were to create your own index of high-income countries’ policy efforts and their spillover effects
 on other countries, what would this index look like?

The reviews are linked to here (from Griffith-Jones, Jacquet, and Kanbur), along with our own summary of
their recommendations and a blog outlining how we responded. All of the academic review related documents
can be downloaded here.

We also consulted extensively with policymakers (including the OECD Development Assistance Committee
and officials in the countries newly included), CGD colleagues, and experts, and we engaged in in-depth
research on how to capture the latest thinking, how to modify existing elements to accommodate new countries
(see section on new countries below), and where we can find data to achieve these goals.

The main changes of the review are outlined below.

Broader Country Coverage
The strongest message of the review was that the CDI should capture new development actors—especially
China and other G20 members—to reflect both their economic importance and their increased activity in
actively promoting development. We therefore added the remaining 10 G20 members to the 27 OECD
countries that we already include. We also added the United Arab Emirates (UAE), reflecting its large economy
size, high income, and significant reported aid. OECD members are easier for us to add, as their data is more
readily available, so we’ve added two (Chile and Israel) whose economies were bigger than existing CDI
members (in 2017 data, not shown). The countries which achieve the economic size and wealth combination
to be included can be seen in Figure 1. The blue dots are existing CDI countries, red are new G20 additions,
and green are other countries added.

 3
Figure 1. Commitment to Development Index coverage from CDI 2020

 4
The CDI now covers 40 countries in total. The total list of all included countries is below, and Table 1 shows
the evolution of country coverage over time. The number of countries scored in the CDI has grown over the
years. The original version in 2003 had 21 countries, which grew to 22 in 2008, and 27 in 2012. The latest
version has 40 countries, and for the second time includes non-OECD countries, several of which have much
lower incomes than the existing countries.

 • Argentina • Finland • Japan • Slovak Republic
 • Australia • France • Luxembourg • South Africa
 • Austria • Germany • Mexico • South Korea
 • Belgium • Greece • Netherlands • Spain
 • Brazil • Hungary • New Zealand • Sweden
 • Canada • India • Norway • Switzerland
 • Chile • Indonesia • Poland • Turkey
 • China • Ireland • Portugal • UAE
 • Czechia • Israel • Russia • United Kingdom
 • Denmark • Italy • Saudi Arabia • United States

Working with such a varied set of countries has generated data challenges that did not exist in previous versions,
produced when all countries were well-documented OECD members. Thus, we have had to adopt systematic
policies about missing data that we outline (see page 10).

Also, because some of these countries themselves have substantially lower income per head than those
previously included in the CDI, we had to contend with whether to include policies aimed at domestic poverty
reduction. We decided against that approach, as the CDI’s approach has always been to measure the policies
that cause positive international spillovers. This means that only where domestic policies are felt abroad, such
as in the cases of tariff setting or instituting strong disease controls, are they included among the otherwise
outwardly focused policy set we cover.

 Table 1. CDI coverage over time

 Additional Additional
 Original CDI (2003) Revised CDI (2020)
 (2008) (2012)
 Australia Japan South Korea Czechia Argentina South Africa
 Austria Netherlands Hungary Brazil Turkey
 Belgium New Zealand Luxembourg Chile UAE
 Canada Norway Poland China
 Denmark Portugal Slovakia India
 Finland Spain Indonesia
 France Sweden Israel
 Germany Switzerland Mexico
 Greece United Kingdom Russia
 Ireland United States Saudi Arabia
 Italy
 21 Countries 1 (22 total) 5 (27 total) 13 (40 total)

 5
A New Structure
We have adopted the recommendation to structure the CDI to capture the broad themes of development. We
retain the original seven components with the addition of health (although with changes, as we will outline),
but we have now grouped them into three overarching themes. First, there is Development Finance, which
stands as its own theme. This is no longer simply “aid”; rather, we have developed a new measure—Finance
for International Development—which is more comparable across traditional and emerging providers (in
particular, it includes all cross-border concessional loans). We will also assess the “quality” of that finance,
including measures of transparency, poverty focus, and support for the multilateral system. Then there are
Policies on Exchange, covering capital (Investment component), goods and services (Trade component), and
people (Migration component). Through investment and trading opportunities, countries can develop their
economies, and through opportunities for migration, their citizens can obtain skills, contacts, and capital.
Finally, the CDI reflects the growing interest in Global Public Goods (GPGs): resources that benefit all
countries. CDI countries are rewarded for contributing to the provision and maintenance of the GPGs of
Environment, Health, Security, and Technology.

 6
Figure 2. Commitment to Development Index Organigram

Income Weighting: Giving Credit for Policies that Benefit the Poorest
As the CDI is concerned with development, several of its measures give greater credit for commitments which
benefit countries with lower incomes per head and higher poverty levels. We include indicators of concessional
development finance, migration; tariffs, international students and research collaboration which give greater
credit where those actions relate to a lower-income-country partner. We have revised and made more consistent
the approach to this weighting across indicators, and this section sets out the method we use for this “poverty
weighting.”

 7
The basic concept here is grounded in the idea that a person’s welfare is more sensitive to income at lower
levels. This has been a core concept in economics, for example, see Layard et al 2008.10 In practical terms, we
are unable to monitor the income level of individual beneficiaries, but we are able to identify country-level
beneficiaries. Whilst we are measuring at the country level rather than the individual level, if the benefits of any
policy are spread across the population, then the concept can extend to country-level analysis.

The economic literature suggests that the welfare benefits of an incremental increase in income are diminishing
and can be represented by a logarithmic function. A typical assumption is that welfare or utility is a function of
the logarithm of income. That is, utility = log (income).

It follows that the marginal utility of an increment in income is inversely proportional to income (that is, $1,000
of income is worth less to you the more you already earn). This can be expressed in a function where income
is defined as Y, and marginal utility = 1/Y. So, in this form, marginal utility is inversely proportional to income:
an additional dollar received by someone with an income of $1,000 has 10 times the marginal utility of someone
with an income of $10,000 receiving it, who in turn, derives from it 10 times the marginal utility of someone
who earns $100,000.

We use this approach to determine how to weight policies as they benefit partner countries with different
income levels. To make the weighting more intuitive, we set the weight equal to 1 for a country with the same
income as the average of low-income countries (LICs), higher than 1 if it was poorer than that, and lower than
1 if it was richer. Specifically, we calculate the weight for any given partner country by scaling the inverse of a
its income to the inverse of average income for LICs. So for country X, this is

 1 1
 ℎ = / = ,

where
 • GNIX = GNI per capita (PPP) of country X, and
 • GNIL = Average GNI per capita (PPP) of LICs.

As an example, the average income (GNI per capita) among LICs in 2017 was US$2,361,11 and that of
Mozambique was $1,430. Therefore, the income weight of Mozambique would be (2,361/1,430) = 1.7. Kenya,
with an income of $3,230, has a weight of (2,246/3,230) = 0.7.

The chart of income weights, with some example countries, is in Figure 3.

10Layard, Nickel & Mayraz, The Marginal Utility of Income (2008) http://darp.lse.ac.uk/papersdb/Layard_etal_(JPubEcon08).pdf,
accessed June 17, 2020
11 Figures are in US dollars.

 8
Figure 3. Income weights, with example countries

Whilst GNI per head is a partial and incomplete measure of a country’s poverty or need, we are combining the
weights over a large number of partner countries (for example, consider average tariff levels, which we weight
by the income level of some 150 countries). In this way, whilst an individual weight may not be accurate, the
weighted average measure we produce likely provides a good guide to how policies affect LICs in general.

One particular example of this relates to “micro” states where we do not have reliable income data, and we
therefore exclude them from the weighting. But for the most part, they would have insignificant impact on
aggregated measures, so the loss in terms of measurement is not material.

Simpler
With any index, or any form of abstraction, there is a trade-off of rich and nuanced versus simple and
streamlined. A key message from the review papers and discussions is that the CDI had become overly complex
and should be simplified, using fewer indicators and showing scores in a more intuitive way.

As well as organising the CDI into three broad themes (see page 6), we have reduced the number of data points
and simplified their weighting in producing overall scores. We have also simplified the presentation of these
scores. Previously, we showed the “standardised Z scores.” This is useful: standardising is necessary to combine
data on hugely different scales (e.g., from fractional percentages of GNI to tonnes of greenhouse gas). But it is
not a great tool for presenting scores in a way that tells a story or is intuitive. For this, we have converted the
standard scores of each component and indicator into percentiles, with the top performer on that measure
scoring 100 and the worst, 0. This can be seen in the layout of the ranking tables in the CDI workbooks, in
Security for example (Figure 4).

 9
Figure 4. Security ranking table

New Measures
Despite the overall reduction and simplification, we also include new measures—including several measures on
gender and measures on global health security, research collaboration, and technology in trade—and a
more comprehensive approach on climate.

Income-Adjusted Scores
As we have introduced new countries into the CDI with lower incomes, we wish to find a way to measure their
performance on a more level playing field. The CDI is primarily concerned with measuring policy effort relative
to a country’s population or economy. However, as we will be adding the remaining G20 countries, some of
whom have incomes at the level of the United States in the 1930s (India, South Africa) and 1960s (China), we
provide an additional set of results which are adjusted by a country’s average income per head. These are known
as “income-adjusted” scores.

In order to calculate an income-adjusted score for a component, we first calculate an “expected” CDI score
based on the relationship between all countries’ scores on that component and their incomes. We then calculate

 10
a country’s income-adjusted score as the difference between the country’s actual and expected scores. To obtain
the “expected CDI” score we use a line of best fit between CDI score and GNI per head using ordinary least
squares regression. The income-adjusted score is then the (positive or negative) deviation from that expected
score. For example, in Figure 5 we provide a stylised example of the development finance component score
against income. The upward sloping line is the expected score: the line of best fit through the scatter points
obtained through ordinary least squares regression. Turkey’s standardised score on this component is 2.21
higher than its income would predict, so its income-adjusted score on this component is 2.21. Switzerland,
however, has a difference of -0.94 between its actual and expected scores. -0.94 would therefore be
Switzerland’s income-adjusted score.

 Figure 5. Income adjusting example: Trade component standardised score against income

It is important to note that income adjusting and income weighting, discussed previously (page 7), are not to
be confused. Income weighting, discussed here, is the process of adjusting a CDI country’s score based on its
income. Income weighting, on the other hand, relates to partner countries’ levels of income and the extent to
which a CDI country’s policies benefit poorer or richer recipients.

New Website
To improve users’ ability to access and understand the CDI’s results we have commissioned a new, interactive
website. It displays the new meta-structure and enables the user to examine detailed country and component
results, to define which groups of countries to include in a comparison (e.g., G7, OECD, BRICS, G20), and
also to consider scores adjusted for CDI country income level.

 11
What’s New in 2021
Following on from such holistic changes to reflect the latest thinking just one year ago, the 2021 CDI needed
very few changes to be up to date. However, the profound changes the world experienced as a result of the
COVID-19 pandemic during this time did necessitate updating the CDI’s approach to assessing countries’
policies on global health, which were previously assessed as indicators within other components. We include a
new component, health. We also make some methodological adjustments to existing indicators and
components

Health Component
This component assesses countries on their policies aimed at the prevention of disease: reducing the risk of
antimicrobial resistance, vaccination coverage, and pandemic preparedness; of participation in global treaties
and standards on health; and on responsible global trade in food, health-related goods, and tobacco products.
This is discussed in detail on page 45.

Methodological changes
Greenhouse Gas Emissions Embodied in Trade
In the environment component, the greenhouse gas emissions indicator is composed of three measures: direct
emissions; emissions resulting from land use, land use change and forestry; and emissions embodied in trade.
The last of these was previously calculated solely as the emissions embodied in imports using OECD data but
is now calculated on a net basis, meaning that emissions embodied in exports are subtracted from emissions
embodied in imports. Data now come mainly from the Global Carbon Budget, with data gaps (currently only
one) filled by older data, from 2015, which comes from the OECD.

Migrant Inflow
In migration component, the migrant inflow indicator measures the inflow of migrants as a proportion of each
CDI country’s population, weighting migrants inversely to the income of their origin countries (see the income
weighting section on page 7 for details on this approach). Migrant data come from the OECD International
Migration Database.

Where there is no data on a country in the OECD dataset, an attempt to fill this gap is made by using data from
the UN (here and here). These UN data pertain to migrant stocks, however, where the OECD data records
annual flows, so the difference between two years of migrant stocks from each origin country is calculated,12
and then poverty weighted the same way it is done for the migrant flow figure from the OECD.

Up until now, countries with no data on this were given the average. But since the UN calculates data on all
countries that make it available, a country without data on this indicator is scored punitively, as outlined under
missing data approaches on page 13.

Fishing Support
In the environment component, the fishing subsidies indicator measures the value of fishing subsidies as a
percentage of landed fish value. In previous editions, this used the OECD’s Fisheries Support Estimate, which
is expressed in US dollars, as a proportion of the dollar value of total fisheries output (obtained from the OECD
– national landings in domestic ports plus national landings in foreign ports). In the CDI 2021, this is now
obtained by adding together various relevant subsidies listed under the OECD’s Fisheries Support Estimate
database, and then subtracting payments made by the fisheries sector. We excluded some subsidies, notably fossil
fuel support to fisheries, due to large inconsistencies (confirmed in correspondence with the OECD) in data
reported by countries. Still, fishing fossil fuel subsidies are included and penalised in the CDI’s wider indicators
on fossil fuel The various subsidies are listed under the fishing subsidies indicator on page 43.

12 Which is why two datasets from the UN are needed

 12
Analysis Tool
To accompany the new interactive website, we are publishing an interactive Excel-based Analysis Tool, which
allows users to interact directly with the CDI scores, rankings, and underlying data to explore score and rank
drivers in granular detail, compare performance across components, compare income adjusting scores to
normal ones, and current year scores to the previous year’s. This also contains customisable charts and tables
to allow users to give visual context to all scores in the CDI. The CDI Analysis Tool can be downloaded here.

Approaches to Missing Data
The CDI measures are in relation to policy areas that matter to other countries and, as such, we hope that
countries will make data on these areas available, ideally in some consistent form. Indeed, one of the objectives
of the CDI is to highlight data gaps to policymakers and create incentives to improve reporting and
transparency.

Across the CDI, there are some measures which are not reported for all years in each of the 40 ranked countries.
While missing data always poses a challenge for composite indices such as the CDI, in previous versions of the
CDI only OECD countries were included and thus we were able to mainly consult datasets in which these
countries were well represented. The revised CDI adds 13 new countries, many of which are not OECD
members. We have substantially revised our data sources wherever possible in response to ensure a fair and
consistent comparison, but data gaps have become more common, and we have taken a consistent approach
to these gaps, as follows.

Data Sources and Cut-Off Year
We employed some generalised strategies for handling missing data:
 • If the data for a given year is unavailable, we use the most recent available data up to a point, extending
 to no earlier than 2011. If a country only has data for prior to 2011, it is treated as though it has no
 data. Where data for any given year is scaled to a denominator (e.g., GNI), as far as possible, we attempt
 to use the same year for the denominator.
 • For measures where we rely on data provided by any international organisation to which a CDI country
 does not report by virtue of not being a member (e.g., the OECD), we made every reasonable attempt
 to use other data sources of a similar nature (e.g., UN data).
 • In cases where there appeared to be no publicly available data, we directly contacted the government
 of each ranked country in order to give them a chance to rectify the gap.

Three Standard Approaches to Data Gaps
Failing the above approaches to rectify the gap, the way missing data is handled depends on the type of data
gap. There are three general approaches we employed, based on the type of data gap:

 • When the country does not report any data to an international organisation it is a part of such as the
 OECD (or the last available data is older than 2011), or when that organisation collects data on all
 countries (such as is often true of the UN), a country is given the score of the worst-scoring country
 for that year. The rationale is that it is always better to report your data than to not report it.
 • When we use a source in which a country is not responsible for reporting its data, and that data is
 missing, we give it the average. This effectively eliminates this country from the ranking in that measure.

 13
• In cases where we observe a significant and strong relationship between income and scores on a
 measure, and when the data gap is not deemed to be caused by deficient reporting by the ranked
 country, we interpolate the score based on GNI per capita.

 Table 2. Number of data gaps per CDI country

 No Data Gaps 1–5 Data Gaps Over 5 Data Gaps
 Australia Argentina (5) Saudi Arabia (12)
 Austria Mexico (5) UAE (11)
 Belgium Chile (4)
 Canada Israel (4)
 China South Africa (4)
 Czechia Brazil (3)
 Denmark India (3)
 France Russia (3)
 Germany Indonesia (2)
 Ireland Turkey (2)
 Italy Finland (1)
 Japan Greece (1)
 Luxembourg Hungary (1)
 Netherlands Portugal (1)
 New Zealand Spain (1)
 Norway
 Poland
 Slovak Republic
 South Korea
 Sweden
 Switzerland
 United Kingdom
 United States

There is one exception to this approach, and that is arms exports value (see page 54). In our arms exports
measure, one country’s exports (Israel) are a significant outlier and assigning non-publishing countries an
equivalent score seemed excessively punitive and had the effect of compressing all the other scores closely
together. For countries that have not published this data, therefore, we assign a score of the mean plus two
standard deviations, to effectively put them at around the 97.5th percentile of export volume.

Note on Landlocked Countries
Landlocked countries, by nature of their geography, cannot report data on issues relating to the seas in the two
relevant indicators (sea lanes protection in the Security component and fishing subsidies in the Environment
component). This means that they effectively cannot have a contribution – this is not scored as missing data.
This gives them the best score on fishing subsidies, and the worst score on sea lanes protection. Meanwhile,
non-landlocked countries which do not report their data are scored with the equivalent worst score for these
two measures.

 14
Which Countries Fare Worst on Transparency?
In its current iteration, the CDI is composed of 67 measures within 40 indicators, across 8 components. The
score of most countries is based on a nearly full set of data. However, some countries fare noticeably worse on
transparency than others.

The effect of this missing data on CDI scores is substantial – if countries do not report data on several
important areas of policies with international impacts, it materially undermines their commitment to
development. Similarly, at least in terms of the CDI score, it provides strong incentives to report this data.

Issues across Components
Terminology
This section briefly outlines some key terms the CDI uses. The CDI draws on thousands of data points and
hundreds of measures, and as such consistent use of terminology can be helpful. In the hierarchy of measures
the CDI, it is helpful to distinguish between the following terms:

Components: There are eight components in the CDI – Development Finance, Investment, Migration, Trade,
Environment, Health, Security and Technology. Each component’s score is a weighted average of the scores
in its constituent the indicators, which are themselves made up of measures.

Subcomponents: Although these are at a higher level than indicators, they are not a unit of measurement, and
serve simply as a way to group similar indicators. For example, in the Security component, the indicators
Peacekeeping Contributions, Female Peacekeepers and Sea Lanes Protection are grouped under the
subcomponent “Peacekeeping.”

Indicators: Each component is made up of indicators, each with a weight that sums to 100 percent. For
example, the Development Finance component is made up of indicators on Development Finance Quantity
and Development Finance Quality, each with a weight of 50 percent.

Measures: These are measures used to calculate indicators. For example, the Greenhouse Gas Emissions
indicator has three measures: emissions per head, emissions from land use and forestry per head, and emissions
embodied in trade.

Scores: This refers to the score assigned to a country’s performance after it has been “standardised.” Scores
are assigned for country performance: overall, at the component level, or at the indicator level. In addition,
“scores” are sometimes used to combine scores across multiple measures, as in the Development Finance
Quality measure above.

A country’s component score is a weighted average of its scores on that component’s indicators. Scores in the
CDI are “standardised”—that is, adjusted to have a mean of 0 and a standard deviation of 1. In this way,
“scores” can be combined across measures or indicators which would otherwise have very different units and
distributions.

Taking an example, consider measures in their original measurement terms (e.g. dollar value of public research
funding, refugees per capita, tonnes of CO2 emitted per capita). Given the very different scales, standardising
is necessary to enable comparison across measures and calculation of performance and ranking. Each country’s
score is therefore standardised as a Z score, with a mean of 0 and standard deviation of 1 (so the vast majority
of scores are between -2 and 2). For example, in the Peacekeeping Contributions indicator, a country’s three
raw indicator scores are all calculated as monetary equivalents as a percentage of GNI and are on the thousandth
of a percent scale. They are summed to give total peacekeeping contributions, which is in the region of
hundredths of a percent. This indicator score must be combined with, for example, the Female Peacekeepers

 15
indicator, whose raw score is measured on a scale of 1%–18%. These scores must therefore be standardised to
a common scale. Also, the standardising process leads all indicators to have the same variance. This is also
important because if variable a has a higher variance than variable b, then variable a will have a greater influence
when the two are combined. Figure 6 outlines the different scoring levels and how they are displayed in the
component workbooks.

 Figure 6. Different levels of Scores in the CDI

Rankings: These are the relative positions of countries according to their overall score, or a score on one of
the CDI’s eight components. A country’s rank is the position of its standardised score within those of the
cohort (i.e., all CDI countries). There are 40 countries in this edition, so a country’s rank on the overall CDI,
or the rank of one of its components, indicators, or measures, ranges from 1 (best) to 40 (worst).

Weighting and Scaling
The CDI is a quantitative and indicator-based index. It combines readings on thousands of data points and
almost 70 measures. Since the measures are not perfectly correlated, countries’ standings on the final results are
affected by the relative importance the formulas give to the various measures. In mathematical terms, the results
are affected by choices of both functional form and parameters. Both the CDI designers and commentators
have naturally asked whether the CDI makes the best choices.

Our intention is to weight indicators according to the evidence, and our judgment, on their contribution to
development. We also try to keep the weights simple – in 5% increments – and try to avoid changing them
incrementally. In practice, the CDI designers choose to weight some indicators more than others. The weights
are backed by many years of expertise and experience in the relevant fields, but in the spirit of dialogue, are
nevertheless open to challenge.

At the top level of the CDI hierarchy, where the eight CDI components merge into a single index, the
components are equally weighted. 13 In other words, we do not weigh the environment or trade more highly
than, say, migration based on their perceived relative importance. Because of the prominence of this choice,
and its importance for the final results, this decision has provoked some discussion. For a detailed discussion,
please refer to the 2013 methodology paper’s section on weighting and scaling (on page 5). Whilst these (now)
eight areas are very unlikely to have an equal weight on development, it’s clear they are all important and giving
them an equal weight helps the Index and policymakers to be focussed on policies, rather than component
weights.

13 Note that, in line with best practice on indices, in compiling the overall component the eight individual components are first

standardised to have equal mean (of 0) and variance (of 1), the practical effect is that this gives less weight to those components with
high variance so that outliers in one area do not dominate the index results.

 16
Scoring Direction
In most cases, a country is rewarded for having a higher score in a particular indicator. The quantity of
development finance it provides to poorer countries, the price it puts on carbon emissions, the number of
troops it contributes to peacekeeping missions. But for some measures which are “bads,” lower is better: the
amount of greenhouse gas a country emits, the volume of arms it exports. When measures are standardised,
these ‘low’ measures are done so inversely so that the standardised score is higher the lower is the underlying
measure. A full list of score directions can be seen in the final column of Figure 7.
Time Series and Back-Calculation
We use the CDI to compare rich countries’ latest policy performance relative to that of their peers using the
most up-to-date data. The rankings and scores in previous versions of the CDI are not directly comparable to
those of the latest version as the method of calculation evolves with improvements and data availability.

Within the calculation sheets, where possible, we do make the historical data available, but the absence of
historical data, especially for the newly added countries, means that back-calculating scores is not possible. As
we update this version of the CDI, we hope to make time-series data available on the underlying measures.

The Full CDI Structure
The remainder of this document will outline the eight components of the CDI and their calculation. Ahead of
that, it is useful to get a big picture view of the overall structure, from the broadest metrics, right down to the
most granular. This is shown in Figure 7. The final column also indicates for each measure whether a high score
or a low score is better, as outlined above under “Scoring Direction.”

 17
Figure 7. Full CDI Structure

 18
Development Finance Component
The development finance component is composed of two indicators which assess a) the quantity of
development finance assistance of each donor country and b) the quality of that assistance. These two indicators
are weighted equally.

Why Is Development Finance Important for Development?
Development finance is likely the first policy that comes to mind when considering how countries help to
promote development beyond their borders. It remains an important source of assistance for many developing
countries. The OECD report on fragile states concludes that aid has been the largest and most reliable source
of finance for the least developed fragile states over the past decade. In 1969, the Pearson Commission proposed
that rich countries should spend 0.7% of their gross national product (GNI) on foreign aid, for which the
definition of official development assistance (ODA) was provided by the Development Assistance Committee
(DAC) of the OECD in the same year. This 0.7% target was enshrined in a UN resolution on October 24,
1970. In 1993, following the revision to the UN System of National Accounts, GNI replaced GNP as the
denominator for the target. More than 50 years after it was set, only a handful of countries are meeting this
target.

Quantity is not the only aspect that matters in the provision of development finance. How it is provided can
have a significant impact on achieving development results. This has been acknowledged by donors in a series
of High Level Fora on Aid Effectiveness, the last one taking place in Busan in 2011. These fora contributed to
establishing key principles for improving the effectiveness of development cooperation. Today, ownership,
focus on results, inclusive development partnerships, and transparency and mutual accountability are standard
criteria which donors and recipients use to implement development assistance interventions. These criteria were
agreed upon by 160 countries, including new and emerging cooperation providers.

Related CGD work: Aid effectiveness

Structure
The Development Finance component’s indicators and their weights in the overall component score are as
follows:

Development Finance Quantity (50%)

Development Finance Quality (50%)
 • Bilateral – share of finance provided bilaterally scored by five measures
 o Poverty focus of finance (40% of bilateral quality)
 o Fragility focus – share of finance to fragile states (10% of bilateral quality)
 o Transparency of development finance data (20% of bilateral quality)
 o Share of untied development finance (20% of bilateral quality)
 o Ownership (10% of bilateral quality)
 • Multilateral – share of finance towards core multilateral contribution; quality set at 67th percentile
 of bilateral

Development Finance
We measure the quantity using a measure of finance for international development (FID) expressed as a
proportion of GNI. In order to assess quality, we use a weighted average of bilateral and multilateral quality.
For bilateral, we use the limited available data on finance provided bilaterally with an even weight on the focus
of aid on poorer and fragile countries alongside measures of provider effectiveness.

 19
You can also read