Hybrid methods for combined experimental and computational determination of protein structure
←
→
Page content transcription
If your browser does not render page correctly, please read the page content below
Hybrid methods for combined experimental
and computational determination of
protein structure
Cite as: J. Chem. Phys. 153, 240901 (2020); https://doi.org/10.1063/5.0026025
Submitted: 20 August 2020 . Accepted: 10 November 2020 . Published Online: 29 December 2020

Justin T. Seffernick, and   Steffen Lindert

COLLECTIONS

     This paper was selected as Featured

 J. Chem. Phys. 153, 240901 (2020); https://doi.org/10.1063/5.0026025                 153, 240901

 © 2020 Author(s).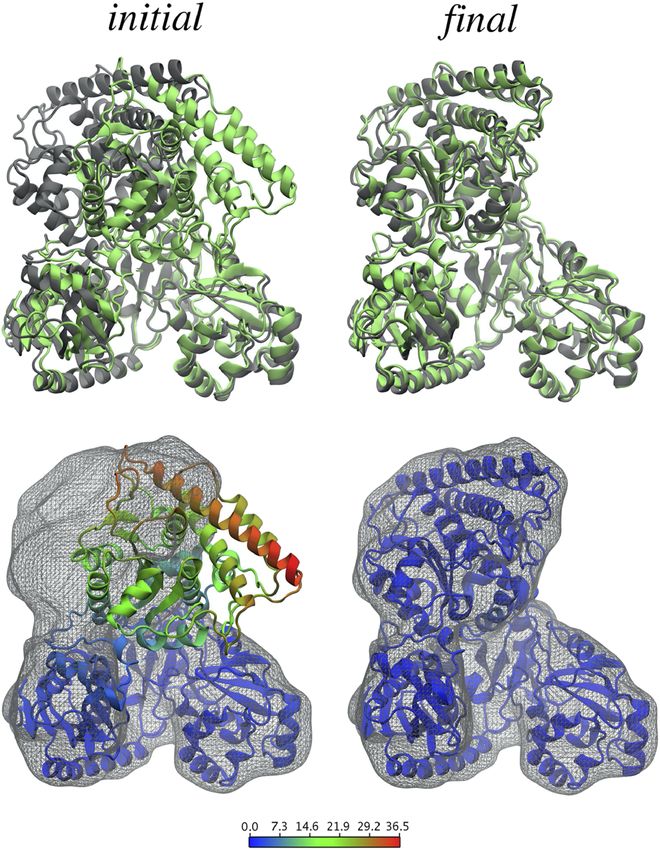
The Journal
                                                                                           PERSPECTIVE            scitation.org/journal/jcp
 of Chemical Physics

    Hybrid methods for combined experimental
    and computational determination of protein
    structure
    Cite as: J. Chem. Phys. 153, 240901 (2020); doi: 10.1063/5.0026025
    Submitted: 20 August 2020 • Accepted: 10 November 2020 •
    Published Online: 29 December 2020

    Justin T. Seffernick and Steffen Linderta)

    AFFILIATIONS
    Department of Chemistry and Biochemistry, Ohio State University, Columbus, Ohio 43210, USA

    a)
     Current address: Department of Chemistry and Biochemistry, Ohio State University, 2114 Newman and Wolfrom Laboratory,
    100 W. 18th Avenue, Columbus, OH 43210, USA. Author to whom correspondence should be addressed: lindert.1@osu.edu.
    Telephone: 614-292-8284. Fax: 614-292-1685

    ABSTRACT
    Knowledge of protein structure is paramount to the understanding of biological function, developing new therapeutics, and making detailed
    mechanistic hypotheses. Therefore, methods to accurately elucidate three-dimensional structures of proteins are in high demand. While there
    are a few experimental techniques that can routinely provide high-resolution structures, such as x-ray crystallography, nuclear magnetic res-
    onance (NMR), and cryo-EM, which have been developed to determine the structures of proteins, these techniques each have shortcomings
    and thus cannot be used in all cases. However, additionally, a large number of experimental techniques that provide some structural infor-
    mation, but not enough to assign atomic positions with high certainty have been developed. These methods offer sparse experimental data,
    which can also be noisy and inaccurate in some instances. In cases where it is not possible to determine the structure of a protein experimen-
    tally, computational structure prediction methods can be used as an alternative. Although computational methods can be performed without
    any experimental data in a large number of studies, inclusion of sparse experimental data into these prediction methods has yielded signifi-
    cant improvement. In this Perspective, we cover many of the successes of integrative modeling, computational modeling with experimental
    data, specifically for protein folding, protein–protein docking, and molecular dynamics simulations. We describe methods that incorpo-
    rate sparse data from cryo-EM, NMR, mass spectrometry, electron paramagnetic resonance, small-angle x-ray scattering, Förster resonance
    energy transfer, and genetic sequence covariation. Finally, we highlight some of the major challenges in the field as well as possible future
    directions.
    Published under license by AIP Publishing. https://doi.org/10.1063/5.0026025., s

    I. INTRODUCTION                                                          structure-based drug discovery (SBDD) methods.1 For example,
                                                                             with the determination of a protein structure, SBDD can drastically
         In order to solve many of the large, pressing problems in science   reduce the number of small molecules to be screened experimen-
    and medicine, methods to determine accurate structures of pro-           tally, excluding the most unlikely binders based on computational
    teins and protein complexes are necessary. Understanding protein         predictions.
    structure gives us an enhanced ability to understand and manip-                There are some experimental methods that can be used to
    ulate protein function. Obtaining accurate protein structures can        determine the structures of proteins at resolutions where the posi-
    significantly facilitate the discovery of mechanisms of the machin-      tions of heavy atoms can be elucidated (
The Journal
                                                                                            PERSPECTIVE             scitation.org/journal/jcp
 of Chemical Physics

    Determined structures are typically deposited in the Protein Data         they are very sensitive to changes in structure), but currently, the
    Bank (PDB), making them available to the scientific community.            translation between CS and structure is not perfectly understood.
    However, while the data collected from these methods can be used          In summary, the experimental data that cannot practically be used
    to unambiguously determine the 3D coordinates of most or all of           for full protein structure determination may inherently not provide
    the atoms, they each offer some unfortunate shortcomings. While           enough information (e.g., not enough measurements, ambiguity,
    x-ray crystallography is still the most common structure determina-       and uncertainty) or may not be understood well enough for transla-
    tion method used for stable, ordered proteins (accounting for ∼89%        tion to the protein structure (or in many cases, a combination of the
    of protein structures in the PDB5 ), determining the proper crystal-      two).
    lization conditions for a specific protein system can take months to            Some examples of techniques that can be used to collect these
    years. Another downside of x-ray crystallography is that it can be        types of data are cryo-EM (when high-resolution density maps
    difficult to obtain the structures of large complexes. On the other       cannot be obtained), NMR (when a full collection of structure
    hand, NMR (∼7% of protein structures in the PDB5 ) is beneficial in       determination experiments are not performed), mass spectrom-
    that it is the most commonly used method to determine an ensem-           etry (MS), electron paramagnetic resonance (EPR) spectroscopy,
    ble of structures, providing information on conformational flexibil-      small-angle x-ray scattering (SAXS), Förster resonance energy trans-
    ity, which has made it more amenable to intrinsically disordered          fer (FRET) spectroscopy, and genome sequencing (for the anal-
    proteins.6 The downside to NMR as a full structure determination          ysis of co-evolving residues). These methods will each be high-
    method is that it is typically limited to smaller structures (with some   lighted in more detail later in this Perspective, but, in general, they
    exceptions) due to issues with peak overlapping and line broad-           provide structural information such as size, shape, solvent acces-
    ening. Finally, cryo-EM (∼3% of protein structures in the PDB5 )          sibility, interface location/composition, distances/contacts, spatial
    continues to increase in popularity due to its benefits such as not       density, orientation, local environment, flexibility, and stoichiom-
    requiring crystallization and utilizing conditions that are relatively    etry/connectivity. Figure 1 shows representations for each experi-
    native-like. Despite these benefits, density maps at high resolution      mental method as well as tags indicating what type of structural
    currently cannot be routinely achieved, and the method is typically       information that they can provide for modeling efforts. While know-
    limited to large structures (although a benefit over x-ray crystallog-    ing these types of information can be very beneficial, unfortunately
    raphy and NMR is that it can be used on very large complexes).            they do not unambiguously specify the three-dimensional atomic
    Additionally, all three of these methods require large amounts of         coordinates.
    sample as compared to some other experimental methods discussed                 An alternative approach for protein structure determination
    later (although cryo-EM can be performed using much less sample           is to use computational prediction methods. Over the past 20–30
    than the other two methods). Despite the strong interest in protein       years, a large number of software packages and online tools have
    structure determination, there is currently a huge gap between the        been developed toward structural modeling of proteins, many
    number of known sequences and experimentally determined struc-            freely available for use. These algorithms can be broadly bro-
    tures deposited in the PDB, highlighting the difficulties of structure    ken down into three categories: protein folding (prediction of
    elucidation. At the time of writing, there were about 185 × 106           the tertiary structure from the sequence), protein–protein docking
    known sequences in the UniProt database,7 while there were only           (prediction of the quaternary structure from the structures of
    about 163 000 structures containing proteins in the PDB,5 with many       the monomers), and molecular dynamics [MD, short timescale
    exhibiting high sequence similarity to each other. While there are        (usually ns to μs) sampling of conformational dynamics of a pro-
    many reasons for this discrepancy (many of which are due to the           tein]. As outlined in Levinthal’s paradox, computational protein
    described limitations), one reason is conformational heterogeneity.       structure prediction methods realistically cannot sample all pos-
    Dynamic systems that cannot be fully described by a single structure      sible backbone conformations of a protein but rather generally
    are typically harder to fully characterize experimentally (e.g., they     rely on stochastic approaches. For protein folding, most algorithms
    are difficult to crystallize). Nonetheless, these methods undoubtedly     use Monte Carlo methods, sampling different backbone conforma-
    will remain central to protein structure determination in the future,     tions by iteratively inserting small fragments of backbone coordi-
    and advances are still being made, but it would be beneficial to the      nates (with similar sequences) obtained from the PDB9 and scoring
    field to have the ability to consistently construct accurate structures   the conformations with scoring functions that generally contain
    of protein systems using data from easier-to-perform experimental         knowledge- and/or physics-based terms.10 Some examples of pro-
    methods.                                                                  grams that can be used for ab initio protein structure prediction
          There are many examples of experimental methods that are            are Rosetta,9,11–13 BCL,14,15 QUARK,16 TOUCHSTONE II,17 and
    more accessible, easier to perform, and that provide some struc-          I-TASSER.18 Structure prediction can be further facilitated if the
    tural information, but from which the data alone are not enough           structures of similar sequences are available in the PDB (homol-
    to fully establish the structure of a protein. These data are sparse,     ogy modeling). Some examples of homology modeling meth-
    in that they do not contain enough information to fully constrain         ods are RosettaCM,19 Modeller,20 SWISS-Model,21 and MOE.22
    the structure, but are also often simultaneously ambiguous (not           Quaternary structure prediction methods can either dock chains
    specific, allowing for multiple interpretations) and uncertain (high      together (locally or globally) or build entire complexes using sym-
    false-positive signals).8 Nevertheless, some types of experimental        metry. Specifically for local docking, Monte Carlo methods are
    data may provide enough information for full structure determi-           common. These methods sample many orientations between dif-
    nation but are not practically usable in that way due to a lack of        ferent protein chains and score models based on shape agree-
    full understanding of the structural connection. For example, NMR         ment and energetic enhancement of the interface(s). For global
    chemical shifts (CSs) provide a large amount of information (as           docking, fast Fourier transform methods (FFT) are generally used.

J. Chem. Phys. 153, 240901 (2020); doi: 10.1063/5.0026025                                                                                 153, 240901-2
Published under license by AIP Publishing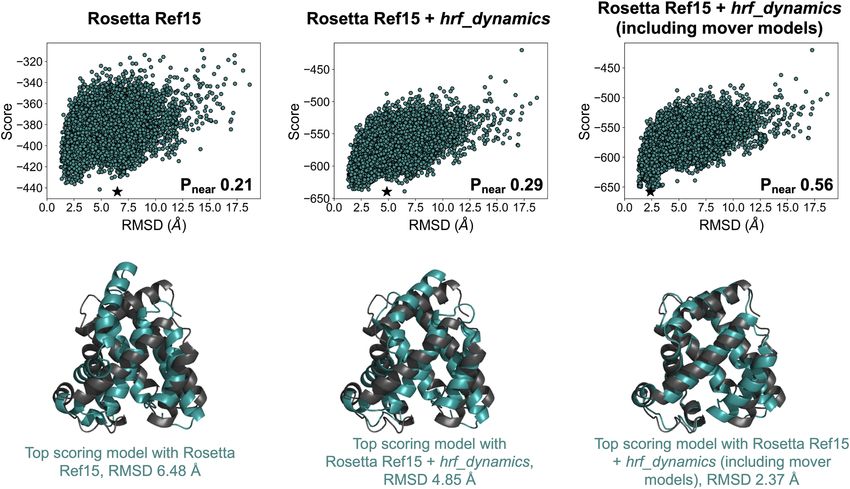
The Journal
                                                                                                                   PERSPECTIVE                   scitation.org/journal/jcp
 of Chemical Physics

      FIG. 1. Representations of each featured experimental method used for computational modeling. In this Perspective, we discuss how each method has been used for
      computational modeling in the form of de novo folding from the sequence (tertiary structure prediction), protein–protein docking (quaternary structure prediction), and
      molecular dynamics (physics-based protein dynamics simulation), as shown in the center panel. In the outer panels, each experimental method is tagged based on the
      type of structural information provided by its data. The categories are size, shape, solvent accessibility, interface location/composition, distances/contacts, spatial density,
      orientation, local environment, flexibility, and stoichiometry/connectivity. (a) Cryo-EM 2D projection image of the GroEL complex,45 a homo 14-mer with D7 symmetry, in
      vitreous ice is shown on the left. Some examples of individual projections of the complex in different orientations are circled. On the right, the reconstructed 3D density map of
      the complex at 3.5 Å resolution (EMDB: 8750) is shown in two orientations. Cryo-EM density maps provide information on size, shape, and spatial density. (b) Representations
      of the most common forms of NMR data used for integrative structural modeling. Chemical shifts (CSs) provide information on local environments, nuclear Overhauser effect
      (NOE) provides distance between atom pairs, and residual dipolar coupling (RDC) provides information on inter-nuclei vector orientations. (c) Representations of various
      mass spectrometry (MS) methods that encode structural information into protein/peptide mass. Chemical cross-linking (XL) provides distances between residues that are
      cross-linked by fixed-length reagents and can provide the interface location when performed on a complex. In hydrogen–deuterium exchange (HDX), the exchange rates
      (from H to D of backbone amide hydrogens) provide information on solvent exposure and flexibility. By performing HDX on monomers and the complex (ΔHDX) and analyzing
      the difference, the interface location can also be determined. Ion mobility (IM) provides information on size and shape by separation, where larger proteins travel (left to right
      in this figure) through the bath gas with a lower velocity. This velocity can be used to calculate an averaged 2D collision cross section. If enough measurements are made on
      a protein complex and monomers, distances between subunits can also be approximated. Surface-induced dissociation (SID), which is exclusively used on complexes, can
      provide information on overall complex stoichiometry and subunit connectivity by breaking apart non-covalent interface interactions. Additionally, depending on the amount
      of energy required to break certain interfaces, a metric that depends on interface composition can also be measured. (d) Electron paramagnetic resonance (EPR) provides
      distances between paramagnetic spin labels, commonly nitroxide (spin-labeled residues shown as sticks). Because of the movement of spin labels, the location can be
      modeled using a cone as shown in this figure. The solvent accessibility of the paramagnetic labels can also be measured. (e) Small-angle x-ray scattering (SAXS) provides
      information on shape in the form of a scattering profile (scattering intensity as a function of spatial frequency), which can be approximated from the 3D structure. (f) Förster
      resonance energy transfer (FRET) can be measured by attaching a donor and acceptor fluorophore to the protein (either in vivo or in vitro) such as cyan fluorescent protein
      (CFP, shown in cyan) and yellow fluorescent protein (YFP, shown in yellow). The measured FRET efficiency (EFRET ) is dependent on the distance between the probes. (g)
      By performing a multiple sequence alignment with a large number of evolutionarily related sequences and identifying coevolving residue pairs, distance restraints or contacts
      can be determined.

J. Chem. Phys. 153, 240901 (2020); doi: 10.1063/5.0026025                                                                                                                   153, 240901-3
Published under license by AIP Publishing
The Journal
                                                                                          PERSPECTIVE             scitation.org/journal/jcp
 of Chemical Physics

    FFT methods sample the large conformational space with high             II. INTEGRATIVE MODELING: COMBINING
    efficiency and evaluate the fit between subunits based on shape         EXPERIMENTAL DATA AND COMPUTATIONAL
    complementarity. Some methods for protein–protein docking               MODELING
    are RosettaDock,23,24 Rosetta SymDock,25 DOT,26 HADDOCK,27              A. Cryo-electron microscopy
    ZDOCK,28 ClusPro,29 PatchDock/SymmDock,30 and FTDOCK.31
    Finally, while it is certainly powerful to obtain or predict a static         Cryo-EM is performed by rapidly freezing an aqueous pro-
    structure, many proteins can adopt multiple different physiolog-        tein sample in a thin layer of vitreous ice and then analyzing the
    ically relevant conformations in vivo. MD offers the ability to         frozen sample with electron microscopy. From this analysis, 2D
    sample some of these different structures, which can then be            images of individual molecules in many different orientations can
    used to gain crucial insight into the function. MD algorithms           be obtained. After taking numerous measurements and obtaining
    typically use classical, physics-based force fields32–35 (molecular     thousands of 2D projections, a 3D density map of the protein can
    mechanics, either all atom or coarse-grained) to simulate the           be reconstructed by combining projections of single particles in dif-
    dynamics and model the structure in relevant solution condi-            ferent rotational orientations. An example for GroEL, a homo 14-
    tions (proteins are typically embedded in explicit water boxes          mer with D7 symmetry, is shown in Fig. 1(a): the 2D image on
    with periodic boundary conditions during the simulations). Some         the left and density map on the right. However, the resolution of
    programs that can be used to perform MD simulations are                 cryo-EM density maps can vary significantly (∼1.25 Å to >20 Å).46,47
    NAMD,36 Amber,37 GROMACS,38 Desmond,39 CHARMM,40 and                    At low resolutions, the overall shape and topography can be
    OpenMM.41 While these methods for protein structure prediction          observed. As the resolution increases to ∼5 Å to 7 Å, secondary
    and modeling have been very successful, de novo modeling remains        structure elements such as alpha helices and beta sheets become
    a challenge.                                                            visible, but side chains are not resolved until ∼3 Å or higher reso-
          Due to the challenges of both computational modeling and          lution is obtained. Recent years have seen a resolution revolution,
    interpreting the data of experimental methods, it has become            where the number of high-resolution structures (and structures in
    increasingly popular to incorporate restraints [reward or penalty       general) deposited in the Electron Microscopy Data Bank (EMDB)
    functions that quantify the agreement with the experiment in            has increased significantly.48 For example, in as late as 2014, no
    some way, i.e., (1) based on deviation from the experiment using        maps with a resolution higher than 3 Å had yet been deposited in
    a forward model or (2) using geometric functions derived from           the EMDB, while in 2019 alone, 265 maps of such resolution were
    the experiment] from sparse experimental data into modeling             released. Over the same time frame, the total number of deposited
    algorithms. While we generally refer to the experimental meth-          maps has increased from 2725 to 11 363. Despite this success, high-
    ods as either techniques that routinely elucidate high-resolution       resolution maps are not yet routinely obtained from cryo-EM exper-
    structures or those that provide some structural information, but       iments, and thus, many medium- to low-resolution density maps
    not enough to fully determine atomic coordinates; in reality, the       are available for modeling. Over the years, numerous computational
    computational methods using these data exist on a spectrum.             methods have been developed to model the structure of proteins
    Depending on the amount of information provided as well as the          based on these density maps.49 In a recent protein–protein dock-
    understanding of those data with relation to the structure, the         ing study, it was shown that the information contained in even
    methods exist somewhere in the spectrum of de novo structure            very low-resolution density maps (∼20 Å) was more useful for inte-
    prediction (from the sequence only), structure prediction using         grative modeling than contact or interface information.50 Results
    sparse experimental data, and full structure determination (x-ray       from this study showing the effectiveness of the different types of
    crystallography, NMR, and cryo-EM). While not a focus of this           information for modeling are shown in Fig. 2. In this Perspective,
    Perspective, we note that dynamic systems with large confor-            we will focus on computational methods that use density maps for
    mational heterogeneity may especially require integrative model-        rigid fitting, flexible fitting (refinement), and de novo modeling.
    ing. For these systems, however, it is important to be aware that       However, it is important to point out that the sophisticated com-
    multiple conformations may be present in the data and are rel-          putational algorithms have been developed to construct 3D struc-
    evant to the function. Because of the popularity of integrative         tures from the obtained 2D projections.51–53 Additionally, methods
    modeling, the biennial Critical Assessment of Structure Predic-         have also been developed to identify secondary structural elements
    tion (CASP) competition added structure prediction categories for       (SSEs) from a density map (of which many modeling methods take
    modeling with multiple varieties of data from experiments such          advantage).54–58
    as NMR, SAXS, cross-linking MS, small-angle neutron scatter-                  The original computational methods developed to model the
    ing (SANS), and FRET in CASP13.42 In addition to the incor-             structure based on cryo-EM density maps were rigid fitting meth-
    poration of restraints from the experimental data into the exist-       ods. Rigid fitting methods attempt to place previously obtained
    ing structure modeling algorithms, software exclusively focusing on     high-resolution structures into density maps without altering the
    structure modeling based on the experimental data, such as the          tertiary structures. One of the first algorithms to perform rigid fit-
    Integrative Modeling Platform (IMP),43,44 has also been devel-          ting was Situs.59 This method uses an exhaustive docking approach
    oped. In this Perspective, we highlight many different ways that        to sample all possible conformations. Other examples of rigid fit-
    the experimental data have been incorporated into protein tertiary      ting methods have been developed based on rotational/translational
    structure prediction, protein–protein docking, and MD. This Per-        search (EMfit),60 fast Fourier transform,61–63 grid-threading Monte
    spective will focus on methods that generate experimental restraints    Carlo,64 spherical harmonics for rotational sampling (ADP_EM),65
    from cryo-EM, NMR, MS, EPR, SAXS, FRET, and genetic sequence            and geometric hashing (BCL::EM-Fit).66 While rigid fitting meth-
    data.                                                                   ods are often used with tertiary structures obtained experimentally,

J. Chem. Phys. 153, 240901 (2020); doi: 10.1063/5.0026025                                                                               153, 240901-4
Published under license by AIP Publishing
The Journal
                                                                                         PERSPECTIVE             scitation.org/journal/jcp
 of Chemical Physics

                                                                                                              FIG. 2. Comparison of the utility of differ-
                                                                                                              ent types of information (green: contacts;
                                                                                                              orange: interface; and blue: EM den-
                                                                                                              sity) for protein–protein docking. Docking
                                                                                                              results for a benchmark set of 162 com-
                                                                                                              plexes were evaluated based on the suc-
                                                                                                              cess rate (percentages of cases with a
                                                                                                              good model in the top N = 1, 10, 20, 100,
                                                                                                              or all), Fnat (fraction of native contacts),
                                                                                                              L-RMSD (ligand RMSD), and I-RMSD
                                                                                                              (interface RMSD). For all metrics, infor-
                                                                                                              mation on EM density was the most ben-
                                                                                                              eficial for integrative modeling. Reprinted
                                                                                                              with permission from de Vries et al., Bio-
                                                                                                              phys. J. 110(4), 785–797 (2016). Copy-
                                                                                                              right 2016 Cell Press.

    generated homology models of monomers have been built into              backbone sampling, normal mode analysis (NMA) can also be
    complexes using rigid modeling.67                                       used. In NMA, backbones are sampled by perturbing the struc-
          Flexible fitting methods, which perform fitting into density      ture along normal modes, collective motions where bonds vibrate
    maps, while allowing changes in tertiary structure, have since          with the same phase and frequency.77 Methods have been devel-
    become more common as structure refinement tools. One branch of         oped to use NMA to distort the structure away from its starting
    these methods uses molecular dynamics simulations to sample struc-      state and toward agreement with the density map. In order to probe
    tures while using the well-established MD force fields combined         more physically realistic deformations, NMFF-EM only considers
    with cryo-EM density maps to energetically guide the sampling.          low-energy motions of the protein to guide the structure toward
    The molecular dynamics flexible fitting (MDFF,68,69 using NAMD)         the low-resolution density maps.78,79 Rather than excluding high-
    method was developed to guide the structures of biomolecules            energy normal modes, iMODFIT uses all normal modes for its
    toward density maps by including a density map-based potential          coarse-grained density map fitting.80 Because of this, a larger range
    function. MDFF has been shown to be very robust as it can also          of conformations can be sampled including large scale conforma-
    be performed on membrane proteins,70 it can include additional          tional changes. Similarly to NMFF-EM, iMODFIT samples only the
    symmetry restraints,71 and further advances have been made such         low frequency vibrations and can efficiently sample using internal
    that it can be used with a wide range of resolutions (even down to      coordinates.81
    sub-5 Å).72,73 An example of the drastic improvement in terms of              In addition to cryo-EM-based flexible fitting with MD and
    agreement with a density map that can be obtained using MDFF            NMA, structure refinement can also be performed using Rosetta.82
    is shown in Fig. 3. A similar approach to flexible fitting has been     The density-based refinement performs particularly well on high-
    performed using Amber, where the potential was based on cross cor-      resolution density maps (
The Journal
                                                                                                       PERSPECTIVE             scitation.org/journal/jcp
 of Chemical Physics

                                                                                         Gorgon, can be used to build de novo models using density maps
                                                                                         in the range of 3.5–10 Å resolution.92 Gorgon uses a feature detec-
                                                                                         tion tool, SSEHunter,54 to identify the secondary structure in the
                                                                                         density maps and builds coarse-grained models using geometric
                                                                                         modeling techniques. In addition to structure refinement based on
                                                                                         density maps, Rosetta can also model structures de novo using maps
                                                                                         at high resolutions (3 Å–5 Å).93,94 Rosetta uses its fragment assem-
                                                                                         bly Monte Carlo simulated annealing method to sample backbone
                                                                                         conformations but chooses fragments that agree best with the den-
                                                                                         sity map based on a scoring function. After iterating between model
                                                                                         generation and fragment scoring, density-guided refinement is per-
                                                                                         formed on the best models. Along with proteins, RNA can be mod-
                                                                                         eled into density maps in Rosetta as well.95 Pathwalking (part of the
                                                                                         EMAN package) uses a very different approach to de novo model-
                                                                                         ing with cryo-EM density maps using the traveling salesman prob-
                                                                                         lem as an inspiration.96–98 Pathwalking essentially determines a valid
                                                                                         path of C-α atoms through the density map for a given number
                                                                                         of residues, which then need to be refined, and a specific sequence
                                                                                         needs to be mapped onto the structure. Along with its other mod-
                                                                                         eling tools for cryo-EM and x-ray crystallography, Phenix can be
                                                                                         used to model structures de novo into high-resolution density maps
                                                                                         through its phenix.map_to_model tool with the goal of automati-
                                                                                         cally mapping the structure using a strategy similar to an experi-
                                                                                         enced biochemist’s intuition.99,100 In short, the method looks for
                                                                                         regions of strong density to place secondary structures and subse-
                                                                                         quently branches out from the strongest density backbone region
                                                                                         to place the side chains. Finally, all-atom refinement is performed.
                                                                                         Another de novo modeling method, MAINMAST, outputs multi-
                                                                                         ple models with confidence scores.101,102 The method first identifies
                                                                                         points of high density and connects them into a minimum span-
      FIG. 3. Improvement in fit to the density map using MDFF for acethyl-CaA syn-      ning tree, which is subsequently refined into essentially a C-α model.
      thase. Target structures and simulated density maps are shown in gray, and the     Finally, the top models are converted to all-atom and further refined
      initial and fitted structures are shown in green (top) and colored by backbone     using MDFF. In addition to full-sequence structural modeling, indi-
      RMSD (Å) per residue (bottom). After MDFF, there was a significant improvement     vidual fragments of a protein can be modeled into a cryo-EM density
      both in density map fit and RMSD. Reprinted with permission from Trabuco et al.,   map using FragFit, which searches the PDB for similar sequences
      Structure 16(5), 673–683 (2008). Copyright 2008 Cell Press.
                                                                                         of the fragment and models the structure of that fragment into the
                                                                                         overall structure of the protein based on the density map.103 While
                                                                                         machine learning techniques have previously been used in the cryo-
                                                                                         EM modeling pipeline (picking of 2D single particle images104–110
    maps.84–87 By iterating between the two cryo-EM structure refine-                    and SSE identification from density maps55–58 ), it has recently been
    ment protocols, these methods have been successful in reducing the                   used for de novo modeling.111 Using a deep learning approach that
    RMSD (root-mean-square deviation) to the native model beginning                      included three cascaded convolutional neural networks, a method
    with models at about 5 Å RMSD.                                                       has been developed to produce confidence maps for major com-
         While flexible fitting into EM density maps can be very advan-                  ponents of the structure (such as SSEs, backbone, and C-α loca-
    tageous, obtaining the starting structure for the modeling can, of                   tions). This has been further converted into backbone traces, and
    course, be a challenge. For this reason, de novo methods have been                   then, the sequence is mapped onto the trace to obtain full atomic
    developed to essentially predict the structures based on the sequence                structures. In the spirit of blind competitions, EMDataResource has
    and the cryo-EM density maps. The first such method, EM-Fold,                        organized modeling competitions using cryo-EM density maps.112
    was originally designed to predict folds of proteins using medium-                   In the most recent competition in 2019, 13 groups predicted struc-
    resolution density maps (∼5 Å to 10 Å, where density rods cor-                       tures for 4 high-resolution density maps (1.8 Å–3.1 Å), many of
    responding to secondary structure elements are visually identifi-                    which were very accurate. Future model challenges are expected to
    able).88,89 The method fits secondary structure elements (identified                 expand to medium-resolution (3 Å–4 Å) maps of more complicated
    from the sequence by secondary structure prediction methods) into                    systems.
    manually identified density rods in the density map. After using a                        In addition to cryo-EM-guided de novo modeling (effectively
    Monte Carlo search algorithm for rod placement, Rosetta is used                      from the sequence), protein–protein docking has also been per-
    to build in the missing side chains and loops. EM-Fold has been                      formed using ATTRACT-EM, docking with very low-resolution
    applied to predict the structures of multiple large proteins (up to                  (∼20 Å) density maps.113 Starting from the structures of the
    ∼400 residues) within cryo-EM density maps.90,91 Another tool,                       monomers, ATTRACT-EM assembles many starting structures

J. Chem. Phys. 153, 240901 (2020); doi: 10.1063/5.0026025                                                                                            153, 240901-6
Published under license by AIP Publishing
The Journal
                                                                                         PERSPECTIVE             scitation.org/journal/jcp
 of Chemical Physics

    and restrains the further refinement based on symmetry and the          determination experiments, saving time and money. In this Per-
    agreement with the density map, with final models being refined         spective, we will highlight computational methods that can incor-
    further. In the Integrative Modeling Platform (IMP), a Bayesian         porate sparse data from NMR into protein structure prediction and
    scoring function to quantify the agreement between structures and       modeling.
    density maps has been developed.114 The input to this integrative             The restraints derived from sparse NMR data that are used for
    modeling is the structures of the monomers. From these struc-           structural modeling most commonly come in three forms: chem-
    tures, monomers are fitted into their portions of the density maps,     ical shifts (CSs), distance restraints from NOE, and orientational
    and they are assembled into complexes using Monte Carlo replica         restraints from residual dipolar coupling (RDC), as displayed in
    exchange. Importantly, the scoring function includes prior informa-     Fig. 1(b). Chemical shifts provide information on the local environ-
    tion, such as how well the monomer agreed with their portions of the    ment for specific atoms, which has been incorporated into mod-
    density map.                                                            eling in multiple different ways, but, in general, tools are used
          Cryo-EM is certainly one of the fastest growing techniques in     to predict CSs from the structure,115–118 which can then be com-
    protein structure determination. Modeling approaches are used for       pared to CS values derived from the experiment. NOE is a relax-
    both high- and low-resolution density maps obtained from cryo-EM        ation technique, where the basic idea is to alter the spin on one
    to study many different systems involving proteins and protein com-     nucleus and measure the effect that has on a different nucleus.
    plexes. For cryo-EM, the biggest challenge is dealing with hetero-      Because the intensity of the measurement is dependent on the dis-
    geneous and dynamic systems where multiple conformations may            tance between two atoms, NOE can provide through-space dis-
    blur the overall density map. Moving forward, cryo-EM will likely       tance restraints for atoms that are within approximately 5 Å. While
    become the prime structure determination method, elucidating pro-       NOE is an important part of full structure determination from
    tein structures for many systems that have long evaded traditional      NMR as described above, often, sparse amounts of these restraints
    techniques such as x-ray crystallography and NMR.                       can be measured and input into computational modeling methods.
                                                                            Finally, RDC arises when proteins in solution align to the mag-
                                                                            netic field, facilitated by the alignment medium. When this hap-
    B. Nuclear magnetic resonance spectroscopy                              pens, the amount of dipolar coupling observed is dependent on
          As previously mentioned, solution NMR can be used to              the angle between the inter-nuclei vector and the magnitude of
    uniquely determine the 3D structure for some small protein systems.     the magnetic field. These measurements can provide orientational
    However, doing so requires the collection of a full set of structure    restraints for computational modeling as RDCs can be predicted
    determination data from a variety of different NMR experiments.         from the structure and compared to the experiment.119 In addition
    Depending on the experiment, prior to collecting data, the proteins     to using these sparse data for structural modeling (i.e., using them
    need to be expressed in isotopically labeled media using NMR active     as restraints in structure prediction and simulations, which will be
    13
       C and/or 15 N isotopes. Optimizing the expression medium and         the focus of the rest of this section), NMR data have also been used
    conditions to produce large amounts of sample is incredibly expen-      to parameterize120,121 and evaluate122–126 molecular mechanics force
    sive and challenging due to the inherent cost of isotopically labeled   fields.
    materials. While the specific experiments performed to determine              Chemical shifts, which are obtained in the early stages of any
    the protein structure with NMR can vary, typically, this requires       NMR structure determination protocol as previously described, can
    assigning the peaks of the 2D HSQC (heteronuclear single quan-          be used to guide protein structure prediction as they encode infor-
    tum coherence) spectra in order to determine the sequence positions     mation about local environments. Many of the CS-based structure
    of observed amide chemical shifts and then performing 2D NOESY          prediction methods use tools such as TALOS, which can be used to
    (nuclear Overhauser effect spectroscopy) experiments to determine       predict secondary structure or torsion angles from CS.127–129 One
    which atoms are close in space, as well as some other experiments       of the first methods to incorporate chemical shifts into structure
    to determine additional restraints. Assigning the backbone peaks        prediction was CHESHIRE.130 In CHESHIRE, the secondary struc-
    of the HQSC spectra can be very time consuming and expensive,           tures are predicted based on both sequence and chemical shifts,
    requiring multiple separate experiments [such as 3D HNCACB and          which are then used to predict backbone torsion angles. These tor-
    3D CBCA(CO)NH] which require days to weeks of data collection           sion angles are subsequently used to select fragments from the PDB,
    for each. In addition, because of the continuous data collection time   which are then used for Monte Carlo fragment insertion. While
    necessary for these experiments, the proteins must be very stable in    these fragments are typically selected based on the local sequence
    solution. Once enough distance restraints from NOESY as well as         similarity for ab initio modeling, choosing them based on CS data
    additional restraints such as dihedral angles and inter-nuclei vector   ensures that the fragments have backbones that are more native-
    orientation are defined (such that the restraints are abundant and      like. In a benchmark, CHESHIRE predicted native-like structures for
    not sparse), an ensemble of structures can nearly unambiguously         11 proteins with up to 123 residues. A similar approach is taken in
    be determined using simulated annealing. Despite the successes of       CS-Rosetta.131–133 When Rosetta performs Monte Carlo simulations
    the technique, typically, a full set of restraints can only be deter-   to sample the protein structure, it does so by inserting backbone
    mined for small proteins (although there are some exceptions with       angles of fragments obtained from the PDB. Similar to CHESHIRE,
    more advanced techniques). Even then, the data collection and anal-     CS-Rosetta includes a CS-based bias into the fragment selection in
    ysis can be very expensive and time consuming (typically months         order to select fragments with a similar local environment as well
    to years and thousands of dollars). However, some useful struc-         as a sequence. The difference is that CS-Rosetta’s fragment selection
    tural restraints can be determined from NMR experiments on a            is performed by directly comparing experimental CS to predicted
    larger variety of systems without performing a full set of structure    CS for fragments in the PDB (rather than first predicting bb

J. Chem. Phys. 153, 240901 (2020); doi: 10.1063/5.0026025                                                                              153, 240901-7
Published under license by AIP Publishing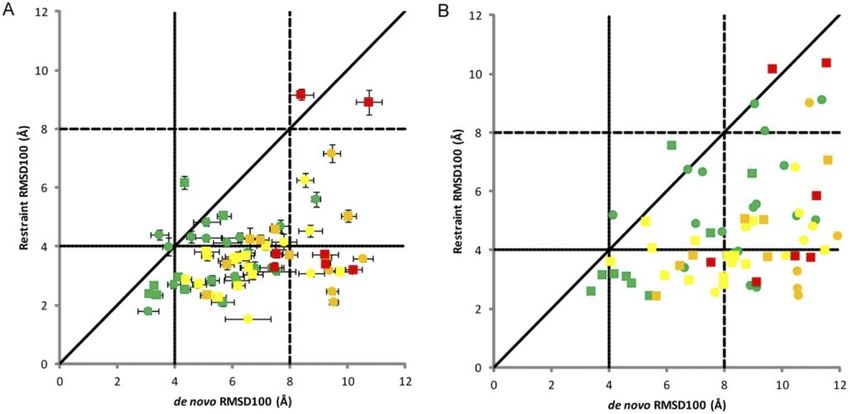
The Journal
                                                                                            PERSPECTIVE             scitation.org/journal/jcp
 of Chemical Physics

    torsions and then using that to select fragments). This method has        data and structures. This method was able to identify correct folds in
    been shown to be successful even when only sparse chemical shift          all cases, and refinement was able to identify high-resolution mod-
    assignments are available. While CS-based de novo methods such as         els in some cases. As integrative modeling has become more popular
    CS-Rosetta and CHESHIRE have been successful, they are typically          and strategies have been developed to model structures with NMR
    only viable for smaller proteins (up to ∼125 residues). To overcome       data, many methods now commonly incorporate multiple types of
    this size limitation, CS data can also be incorporated into homol-        sparse NMR data into their structure prediction methods. CS, NOE,
    ogy modeling for proteins with the available homologs. In Rosetta,        and RDC data have been used to build complexes in Rosetta from
    this has been done by using the CS data to identify homologs of           the sequence.143 This strategy is to use CS data to build monomers
    the target sequence and to align it to templates (alignment method        (CS-Rosetta) as previously described and dock them together with
    called POMONA), with RosettaCM used for the homology modeling             the NOE interface and RDC restraints to predict the accurate struc-
    (CS-RosettaCM).134 In a benchmark (proteins between 100 and 400           tures of homodimers. In this method, the RDC restraints were
    residues), the method predicted accurate structures (
The Journal
                                                                                                            PERSPECTIVE                  scitation.org/journal/jcp
 of Chemical Physics

      FIG. 4. NMR restraints improved native-like sampling in BCL. Each point signifies one protein. Points are colored based on size (green:
The Journal
PERSPECTIVE scitation.org/journal/jcp
of Chemical Physics
FIG. 5. MELDxMD was the highest
ranked group in NMR data-assisted
CASP13 (2018). (a) MELDxMD (431)
had the highest Z-score in the category.
(b) Predicted structures for CASP tar-
gets are shown with reference to the
native structures. Five of these predicted
structures were best in CASP. Reprinted
with permission from Robertson et al.,
Proteins 87(12), 1333–1340 (2019).
Copyright 2019 John Wiley and Sons.
(MALDI),164 this was not possible. These inventions sparked the the proteins are enzymatically digested into smaller peptide frag-
development of new mass analyzers and ultimately techniques to ments, cleaving some peptide bonds, but keeping the newly created
determine structural information on proteins. These techniques can cross-links intact. The peptides are then separated and analyzed by
be broken down into two categories: bottom-up and top-down. In liquid chromatography and tandem MS. If the sequence location
bottom-up MS, proteins are enzymatically digested into small pep- of the cross-links can be determined from the peptides, this analy-
tides and these peptides are separated and analyzed using tandem sis provides information about which residues are interacting (i.e.,
MS (MS/MS). Alternatively, in top-down MS, intact proteins are close in space), often across protein–protein interfaces. Based on
separated and ion-trapped using tandem MS. Many pre-MS ion acti- the length of the cross-linking reagent (which can be up to about
vation or chemical modification methods have been developed to 35 Å depending on the reagent), distance restraints can be inferred
infer structural information from MS experiments. and included in computational structure prediction algorithms.165
Ultimately, MS can be used to measure the mass-to-charge ratio Cross-linking information can be extremely beneficial for computa-
of a molecule. While this information is useful for an entire pro- tional modeling because contacts that are close in space, but far in
tein (especially when analyzing complex mixtures), structural infor- sequence, are generally hardest to predict.
mation is gained by analysis of results after different pre-MS steps Workflows have been developed in Rosetta to individually use
are performed. These pre-MS steps have been developed in order the data from cross-linking experiments for de novo modeling,
to encode structural information into the mass of the protein or homology modeling, or protein–protein docking. These methods
protein fragments. Many of these methods have then been incor- were first developed to use detected cross-linked residue distances as
porated into computational pipelines to model protein structures. restraints in model generation as well as to filter models after struc-
The MS-based methods highlighted in this Perspective are chemical ture generation.166,167 Distance restraints from XL-MS have also
cross-linking, covalent labeling (such as hydrogen–deuterium been used with homology modeling using I-TASSER,168 XLinkDB169
exchange and hydroxyl radical footprinting), ion mobility, and [a combination of Modeller and PatchDock from the Integrative
surface-induced dissociation. While the structural data obtained Modeling Platform (IMP)], and MD refinement.170 Cross-linking
from these MS-based methods are not enough to fully elucidate the data have been used to model the interaction between Psb27 and
structure, MS does not suffer from many of the drawbacks of the Photosystem II, combined with protein–protein docking.171 The
typical structure determination methods. MS can handle complex top-ranked (without incorporating the XL) docked models did not
mixtures, does not require crystallization, can be performed on both match the XL data, so the data were necessary to properly model
large and small systems (up to megadalton-sized complexes), and the structure. Additionally, software is available to detect cross-
requires small amounts of sample (μl of sample at low μM concen- links such as Mass Spec Studio, which was validated based on its
trations). Finally, as will be described in Secs. II C 1–II C 4, the types ability to improve protein–protein docking when used with avail-
of structural information that can be obtained from MS experiments able software.172 More recently, chemical cross-link data have been
are very diverse. used to build full quaternary structures from the sequence using
Rosetta.173 This has been done by generating tertiary models using
de novo or homology modeling and then docking those models to
1. Chemical cross-linking form the complex (all done without guiding the predictions with
Chemical cross-linking (XL, CX, or CL) has been combined XL data). Next, the models were filtered based on the agreement
with MS (XL-MS) using a bottom-up approach. The general idea between the number of cross-links observed and the lysine–lysine
of the method is to chemically connect two atoms that are close distances in the predicted models. Models that passed the filter
in space, while the protein is in a native-like environment. In XL- were refined by docking at higher resolution and rescored based on
MS, the native protein in solution is incubated with a bifunctional lysine–lysine distances of experimentally observed cross-links and
cross-linking reagent, as depicted in Fig. 1(c). After cross-linking, the Rosetta scoring function to select the predicted structures. In
J. Chem. Phys. 153, 240901 (2020); doi: 10.1063/5.0026025 153, 240901-10
Published under license by AIP PublishingThe Journal
PERSPECTIVE scitation.org/journal/jcp
of Chemical Physics
addition in Rosetta, flexible peptide docking has been performed effect is minimal when small labels are used (such as with HDX
using experimentally determined cross-links as filters to select good and to a lesser extent HRF)178 and also when the experiment is per-
models.174 formed sufficiently fast [such as fast photochemical oxidation of
Rather than simply using XL data as restraints, the importance proteins (FPOP)].179 It has been shown using simulated CL data
of cross-link distance restraints being surface accessible (rather than with noise that labeling the following residues provides the most use-
through the protein) has furthermore been examined by calculat- ful information toward tertiary structure prediction because of their
ing the surface accessible surface distance using Jwalk and using abundance in sequence: L, G, R, V, and S.180
that in a scoring function to score homology models based on XL
data.175 In another study, a statistical XL-based potential based on a. Hydrogen–deuterium exchange. Hydrogen–deuterium
distance calculations from the protein data bank was developed exchange, a non-specific covalent labeling method, has been used for
and incorporated into the Rosetta ab initio folding as a proof of a long time to study biomolecules (since the 1930s for small systems)
principle.176 This force field improved tertiary structure prediction but has become very popular when combined with MS (HDX-MS).
by including the probability that cross-linked residues are surface As the pre-MS, covalent labeling step, the protein is incubated in a
accessible. D2 O buffer solution. In this solution, some hydrogens in the protein
In addition to detecting if and where cross-links bind to gen- are able to exchange with deuterium, as shown in Fig. 1(c). After
erate distance restraints or use in a scoring function, it is possi- some time, the exchange is quenched and continued in the CL-MS
ble to quantify the number of cross-links between two residues pipeline, as previously described. This experiment is repeated for
(quantitative chemical cross-linking). Based on the intensity of dif- many different incubation times so that kinetics can be determined.
ferent cross-links, this type of analysis can give information on Rate constants or protection factors derived from rate constants at
dynamics and can sometimes detect multiple conformations. It has each measured position are commonly reported in the literature.
been shown that multiple relevant protein conformations can be However, it is not uncommon to report percent deuteration incor-
modeled based on cross-link intensity by combining xTract with poration of certain positions at certain time points. Because of fast
docking.177 back-exchange for side-chain hydrogens (after quench) and slow
exchange for carbon-bound hydrogens (prior to quench), only the
2. Covalent labeling amount of exchange from backbone amide hydrogens is measured
While XL-MS methods gain insight into residue–residue dis- (starting at the third residue in each fragment). One major difficulty
tances, covalent labeling methods gain insight into solvent acces- of HDX is to convert the data collected on peptides to the residue
sibility and flexibility. Covalent labeling (CL) reagents can bind to level, although many methods have been developed to facilitate this
proteins in solution and thus chemically alter their masses (either conversion.181,182 For HDX to occur at a given position, it is particu-
irreversibly or reversibly). The structural hypothesis is that the larly important that the amide hydrogens be both exposed and flex-
reagents bind more favorably or more rapidly to residues that are ible (i.e., not participating in a hydrogen bond) in order to rapidly
more solvent-exposed and more flexible. The general workflow for exchange because hydrogen-bonded hydrogens are much less likely
covalent labeling MS (CL-MS) methods is to incubate the pro- to exchange with deuterium.
tein in solution with the labeling reagent for a certain period of HDX data have been successfully incorporated with homology
time to allow the labeling reagents to bind to the protein. Then, modeling to predict structures. In one study, using a two-step
the protein is enzymatically fragmented into peptides (bottom-up), homology modeling strategy, where the sequence alignment was
which are separated and analyzed by tandem MS to determine the adjusted after the first step to better match the HDX data, the
binding location of the labels within the sequence by detecting the models were further evaluated based on solvent exposure.183 Of
change in mass (although it can sometimes be a challenge to deter- the predicted models, the best model showed a strong correlation
mine the exact, residue-resolved locations since measurements are (R2 = 0.94) between the backbone solvent-accessible surface area
generally performed on peptides). Covalent labeling strategies can (SASA) and percent deuterium incorporation measured with HDX
be employed in many different flavors (depending on the label- at the peptide level. This analysis leads to new mechanistic hypothe-
ing reagent used) but can generally be broken down into spe- ses for the system. In a different study, correlations between the
cific and non-specific labeling methods. Specific covalent labeling number of deuterons and the backbone SASA for each peptide were
reagents bind to particular amino acids or amino acid functional used to analyze homology models of IκBε generated with two dif-
groups. Common methods are available to target arginine, car- ferent templates (both with strong correlations).184 The templates
boxylic acids, cysteine, histidine, lysine, tryptophan, or tyrosine.178 differed in length and the HDX analysis, showing a good correlation
On the other hand, non-specific labeling reagents can label most or in the extended region, was used to justify an additional structured
all of the amino acid types. The most commonly used non-specific ankyrin repeat in the target.
labeling methods are hydroxyl radical footprinting (HRF) and In addition to homology modeling, HDX data have been
hydrogen–deuterium exchange (HDX). While both types of cova- successfully incorporated into protein–protein docking. Differ-
lent labeling can provide useful structural information, the use of ential HDX (ΔHDX), performing HDX-MS experiments on the
non-specific methods to this point has been more successful in struc- monomers separately and comparing to HDX of the complex,
tural modeling since they provide more information by labeling can provide useful information specifically on the location of the
more residue types; therefore, this Perspective will highlight meth- protein–protein interface. Interface residues are likely to exchange
ods that incorporate HDX and HRF into modeling. To make struc- rapidly in the monomer but may exchange slower in the complex
tural hypotheses, it is also important that covalent labels do not as they generally become more buried and less flexible upon bind-
cause changes to the overall structure of the protein. However, this ing. However, it is important to note that changes in non-interface
J. Chem. Phys. 153, 240901 (2020); doi: 10.1063/5.0026025 153, 240901-11
Published under license by AIP PublishingThe Journal
PERSPECTIVE scitation.org/journal/jcp
of Chemical Physics
residues upon binding (protection or deprotection) can also occur rate constant) are generally derived. The structure-based hypothe-
due to the general stabilization of the complex as well as allosteric sis for this metric is that a higher protection factor should corre-
effects. Figure 1(c) shows an example of the difference in deuteration late with less solvent exposure due to the lack of accessibility of the
that could occur in the unbound and bound forms. To demonstrate radicals.
this, the hUNG-UGI complex was docked using DOT and outputs Based on this hypothesis, correlations between structure and
were filtered based on HDX data.185 For peptides observed in both FPOP data have been examined.194 The average SASA derived
the monomer and the complex, the difference between the num- from MD simulations normalized by the sequence context, calcu-
ber of deuterons in the monomer and the complex was measured lated for residues with high and moderate hydroxyl radical reac-
(this number indicates the number of backbone amide hydrogens at tivity, was shown to be strongly correlated with a normalized
the interface). The filtering step required that the same number of protection factor (PF). Analyzing the frames from unfolding simu-
residues in the fragment was within a 7 Å interaction distance of the lations, this metric was able to discriminate well between native-like
other subunit and this part of the interface. This filtering was shown and non-native-like models based on RMSD. Furthermore, FPOP
to enrich the number of native-like structures in the prediction. In has been incorporated into a de novo tertiary structure prediction
another study, ΔHDX was used to help identify the binding interface framework.195 Based on an observed correlation between neighbor
between two partners and was combined with RosettaDock, which count, a surface-accessibility measure of the number of neighbor-
was also restrained using inter-subunit cross-links.186 In addition to ing residues within a specific distance, and natural logarithm of PF,
using HDX to identify the interface, models were evaluated based on a model to predict FPOP data from structure was developed. This
SASA and HDX agreement, which resulted in a model with a RMSD model was incorporated into an FPOP-quantifying scoring term,
of less than 2 Å. Similar analyses have been done with protein–ligand which was used to rescore models generated in Rosetta. Structure
complexes.181,187–189 prediction was improved with the inclusion of FPOP data. Fur-
Since HDX is a solution-based approach, it can provide infor- thermore, accounting for side chain flexibility through MD and
mation on the ensemble of structures present in the solution. Rosetta movers has been shown to improve the observed correla-
Because of this, it is beneficial to use HDX data in conjunction tion between residue exposure and experimental PF.196 Incorpora-
with MD simulations. It has been shown that HDX data can dis- tion of this improved correlation into a scoring function produced
criminate between native and non-native folds from conformations improvement in model selection for tertiary structure prediction as
generated in an MD simulation.190 This was done by predicting well. Extracting the top 20 scoring models and generating 30 addi-
the deuterium uptake based on near contacts and hydrogen bonds tional structures for each using a combination of Rosetta movers
from the structures and comparing it to the experimental results. chosen to boost side-chain sampling further improved the predicted
In addition to actually modeling HDX during MD simulations, the structure in all cases. An example is shown in Fig. 6 for myoglobin.
simulations themselves have been extensively used to better under- The selected model (based on score) improved from 6.48 Å (left)
stand and predict the HDX results. For example, MD simulations when no HRF data were included to 4.85 Å (middle) and when
have been used to predict the peptide-resolved HDX data based HRF data were included and further improved to 2.37 Å (right)
on solvent accessibility. These data were calculated over the sim- when additional side-chain sampling was allowed using the mover
ulation based on both residue SASA and whether the amide NH models.
interacts with a water molecule. The predictions correlated well with
the experimental results.191,192 Numerous other methods have been
3. Ion mobility
developed that quantify some combination of hydrogen bonding,
solvent accessibility, and RMSF (root-mean-square fluctuation).193 Ion mobility (IM), a top-down, native MS approach, provides
structural information not on specific residues, but rather on the
b. Hydroxyl radical footprinting. In contrast to HDX, HRF shape of the entire protein or protein complex. In IM, the entire
methods irreversibly alter the mass of the protein at certain posi- native protein, rather than broken into peptides, is softly ionized in
tions. The strategy is to introduce hydroxyl radicals into solution the gas phase and accelerated through a bath gas (commonly nitro-
to interact with the side chains of exposed residues. The result- gen or helium) and subsequently analyzed with MS. The velocity
ing mass change is very dependent on the amino acid type, for of each ion as it passes through the bath gas depends on its size
example, the radical can abstract hydrogens from aliphatic residues and shape (as well as charge and other experimental factors), which
or directly attack sulfur atoms or aromatic rings. Although there can then be translated into a rotationally averaged collision cross-
are many different ways to introduce the hydroxyl radicals (such sectional area (CCS). Figure 1(c) illustrates this separation, show-
as radiolysis of water with electrons, x rays, or gamma radiation, ing smaller ions moving faster through the bath gas (left to right).
transition metal-dependent chemical reactions with peroxide, or This experimentally derived CCS can then be used for structural
high-voltage electrical discharge in water), one of the most com- modeling. While there is a plethora of different computational meth-
mon methods that has been used in structure prediction is through ods to predict the experimentally measured CCS from the 3D coor-
peroxide photolysis, called fast photochemical oxidation of pro- dinates of a protein, selecting the best method can be challenging
teins (FPOP). In FPOP, hydroxyl radicals are produced in situ by because there is usually a tradeoff between accuracy and computa-
UV laser-based photolysis of hydrogen peroxide. The radicals then tion time. Briefly, some methods simply calculate the average projec-
alter the mass of a broad range of amino acid types with differ- tion area over multiple rotations of the protein [projection approx-
ent intrinsic reactivities that have been tabulated. Similarly to HDX, imation (PA)197,198 and exact hard-spheres scattering (EHSS)199 ],
FPOP rate constants can be determined for each residue and from while some also take gas–protein interaction energy and multiple
the rate constants, protection factors (intrinsic reactivity divided by gas–protein collisions into account [trajectory method (TJM),200,201
J. Chem. Phys. 153, 240901 (2020); doi: 10.1063/5.0026025 153, 240901-12
Published under license by AIP PublishingYou can also read