Best Practice Guidelines for Surveys and Monitoring of Great Ape Populations - Occasional Paper of the IUCN Species Survival Commission No. 36 - Hutan
←
→
Page content transcription
If your browser does not render page correctly, please read the page content below
Best Practice Guidelines for Surveys and
    Monitoring of Great Ape Populations

                            H. Kühl, F. Maisels, M. Ancrenaz & E.A. Williamson

     Occasional Paper of the IUCN Species Survival Commission No. 36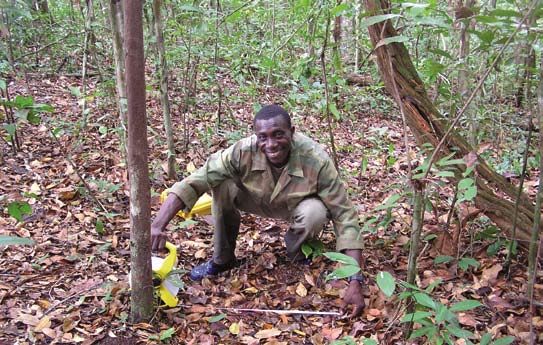
The International Union for Conservation of Nature (IUCN)
   Founded in 1948, IUCN brings together States, government agencies and a diverse range of non-governmental organizations in a unique
world partnership: over 1,000 members in all, spread across some 140 countries. As a Union, IUCN seeks to influence, encourage and
assist societies throughout the world to conserve the integrity and diversity of nature and to ensure that any use of natural resources is
equitable and ecologically sustainable. IUCN builds on the strengths of its members, networks and partners to enhance their capacity and
to support global alliances to safeguard natural resources at local, regional and global levels.

IUCN Species Survival Commission
  The Species Survival Commission (SSC) is the largest of IUCN’s six volunteer commissions with a global membership of 8,000 experts.
SSC advises IUCN and its members on the wide range of technical and scientific aspects of species conservation and is dedicated to
securing a future for biodiversity. SSC has significant input into the international agreements dealing with biodiversity conservation.
Web: www.iucn.org/themes/ssc

IUCN Species Programme
   The IUCN Species Programme supports the activities of the IUCN Species Survival Commission and individual Specialist Groups, as well
as implementing global species conservation initiatives. It is an integral part of the IUCN Secretariat and is managed from IUCN’s international
headquarters in Gland, Switzerland. The Species Programme includes a number of technical units covering Wildlife Trade, the Red List,
Freshwater Biodiversity Assessments (all located in Cambridge, UK), and the Global Biodiversity Assessment Initiative (located in Washington
DC, USA).

IUCN SSC Primate Specialist Group
   The Primate Specialist Group (PSG) is concerned with the conservation of more than 630 species and subspecies of prosimians,
monkeys, and apes. Its particular tasks include carrying out conservation status assessments, the compilation of action plans, making
recommendations on taxonomic issues, and publishing information on primates to inform IUCN policy as a whole. The PSG facilitates
the exchange of critical information among primatologists and the professional conservation community. The PSG Chairman is Russell A.
Mittermeier, the Deputy Chair is Anthony B. Rylands, and the Coordinator for the Section on Great Apes is Liz Williamson.
Web: www.primate-sg.org/

Best Practice Guidelines for Surveys and
    Monitoring of Great Ape Populations

                            H. Kühl, F. Maisels, M. Ancrenaz & E.A. Williamson

     Occasional Paper of the IUCN Species Survival Commission No. 36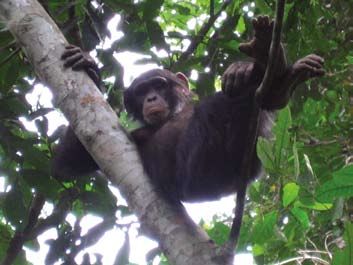
The designation of geographical entities in this book, and the presentation of the material, do not imply the expression of any opinion
whatsoever on the part of IUCN or other participating organizations concerning the legal status of any country, territory, or area, or of its
authorities, or concerning the delimitation of its frontiers or boundaries. The views expressed in this publication do not necessarily reflect those
of IUCN or other participating organizations.

Published by:       IUCN, Gland, Switzerland in collaboration with the Center for Applied Biodiversity Science at Conservation International

Copyright:          © 2008 International Union for Conservation of Nature and Natural Resources
                    Reproduction of this publication for educational or other non-commercial uses is authorized without prior written permission
                    from the copyright holder(s) provided the source is fully acknowledged.
                    Reproduction of this publication for resale or other commercial purposes is prohibited without prior written permission of the
                    copyright holder(s).

Citation:           H. Kühl, F. Maisels, M. Ancrenaz and E.A. Williamson (2008). Best Practice Guidelines for Surveys and Monitoring of Great Ape
                    Populations. Gland, Switzerland: IUCN SSC Primate Specialist Group (PSG). 32 pp.

ISBN:               978-2-8317-1062-4

Cover photo:        © Crickette Sanz

Layout by:          Center for Applied Biodiversity Science at Conservation International

Printed by:         Linemark Printing, Largo, MD, USA

Available from:     [e-mail] jaguiar@conservation.org; [web] http://www.primate-sg.org/
Table of Contents

Executive Summary........................................................................................................... 1

Section 1. Introduction ..................................................................................................... 2
   1.1. Overview............................................................................................................................. 2
   1.2. Scope of these guidelines................................................................................................... 3
   1.3. Defining terms and differentiating surveys from monitoring............................................... 4
   1.4. Sampling objectives and design......................................................................................... 5
   1.5. Quantifying ape abundance ............................................................................................... 6

Section 2. Review of Great Ape Survey Methods............................................................... 7
   2.1. Introduction......................................................................................................................... 7
   2.2. Distance sampling methods .............................................................................................. 8
   2.3. Distance-related methods — strip transects and plots..................................................... 11
   2.4. Index sampling.................................................................................................................. 11
   2.5. Direct vs. indirect surveys................................................................................................. 12
   2.6. Occupancy method........................................................................................................... 17
   2.7. Full or complete counts.................................................................................................... 17
   2.8. Mark-recapture surveys.................................................................................................... 19
   2.9. Home range estimator...................................................................................................... 21
   2.10. Interview techniques......................................................................................................... 21
   2.11. Suitability of different methods......................................................................................... 22
   Decision Tree: Surveys and Monitoring — what to do when................................................... 22

Acknowledgements......................................................................................................... 23

Bibliography ................................................................................................................... 23
   Literature cited........................................................................................................................... 23
   Additional useful literature ........................................................................................................ 26

Annex I: Contacts and Resources for Further Information and Funding............................ 28

Annex II: Online Sources of GIS Data............................................................................... 28

                                                                                                                                                    iii
Executive Summary
The combination of threats currently facing the remaining great apes requires immediate conser-
vation action at all scales — from site-level initiatives, through national and regional strategies, to
international conventions and action plans. Baseline density estimates and subsequent monitor-
ing of ape populations are essential for assessing the impacts of particular threats and measuring
whether conservation programmes are succeeding.
This document outlines current approaches to great ape surveys and monitoring for field biol-
ogists, protected area managers, government wildlife departments and the conservation com-
munity at large. Detailed, additional information on survey design, field methods, analytical
approaches, and practical considerations such as logistics, finance, and standardised reporting,
form Sections 3 to 8, which are available online and can be downloaded at http://apes.eva.mpg.
de/guidelines.html. These guidelines are mostly web-based to allow continuous revision and to
supply updates as field methods and statistical packages improve with time. It should be kept
in mind that there is no “best” survey method that suits all purposes, and is efficient, precise,
reliable, simple and cheap at the same time. An effort has been made not simply to repeat texts
that already exist in the literature, but to provide real and practical guidance that may not exist
elsewhere. Some key texts by other authors, such as Blake (2005) and White and Edwards (2000),
can be found at http://apes.eva.mpg.de/documentation.html. A bibliography and resource lists
that provide contacts for further information and funding (Annex I) and for obtaining GIS data
(Annex II) conclude this document.
The conservation of wild great apes requires a detailed understanding of their population size,
spatial distribution and demographic trends. Survey and monitoring programmes are designed
to provide exactly this kind of information. Ideally, survey and monitoring data permit evaluation
of the sources and impacts of threats, such as hunting, habitat degradation and fragmentation,
disease and natural catastrophes. They should enable identification of areas of high conservation
value and evaluation of the effectiveness of protection and management strategies. However, in
reality the conservation status of most wild ape populations is still poorly known. Great apes occur
at low densities throughout their range, and often in remote places with difficult access. When
these factors are combined with their cryptic nature, the implementation of efficient survey and
monitoring programmes is notoriously difficult. As a result, action plans issued for both African
and Asian great apes over the past few years have emphasized the need to properly document
the conservation status of wild populations (e.g., Kormos and Boesch 2003; Singleton et al. 2004;
Tutin et al. 2005). Examining the distribution and intensity of threats, and current great ape distribu-
tions helps in the identification of the best sites for new protected areas, and provides empirical
data to evaluate existing management strategies in protected and non-protected areas harbouring
great ape populations. Finally, these data are essential for IUCN Red List of Threatened Species™
assessments, which should be based on actual population size and status.
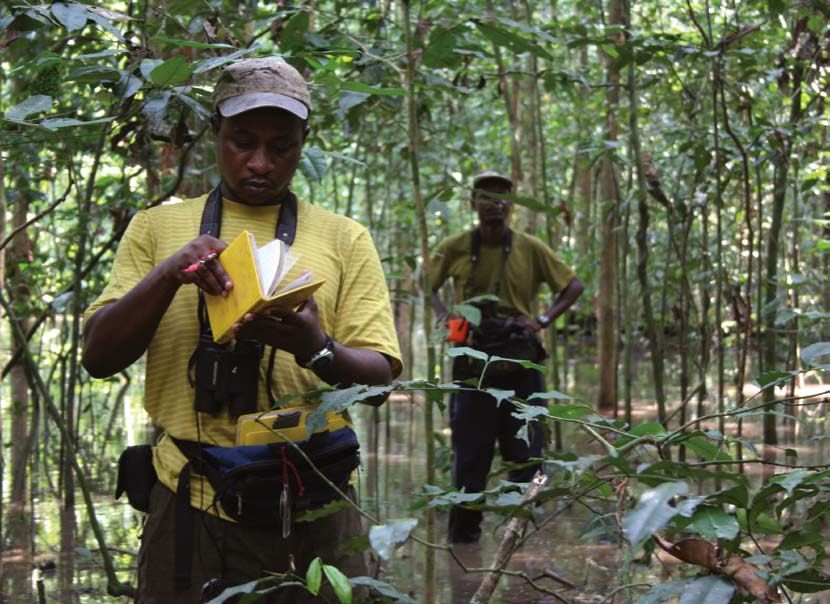
Surveying most great ape
populations requires long walks
in remote forests. Here a team
is looking for orangutan nests
during a combination of recce
walks and line transects in the
forests of Sabah, Malaysian
Borneo.
Photo: © M. Ancrenaz
1Section 1. Introduction
1.1. Overview
From the beginning, biologists studying great apes have been producing maps of their geographic
distributions. Population size estimates followed, which ranged from “best guesses” based on
interviews with local hunters or foresters at remote sites, through sample-based methods aimed at
estimating a mean density across a large area, to fairly accurate head counts which assumed that
most of the apes in an area of interest were known individually. Monitoring of great apes has most
often consisted of long-term studies of focal groups, such as the chimpanzees of Gombe (Pusey
et al. 2007) and Mahale (Nishida et al. 2003), and the mountain gorillas of Karisoke (Robbins et al.
2001). However, it is neither feasible nor cost effective to habituate and monitor multiple groups of
each great ape taxon over a large landscape.
As habitat loss and fragmentation of humid forests became more widespread in the 1980s, and
as it became known that hunting and illegal killing were taking direct and heavy tolls on great
apes throughout their range, concerned scientists began to consider whether it was possible to
estimate the size of entire populations of a given species and monitor changes in their distribu-
tion and abundance (Ghiglieri 1984; Tutin and Fernandez 1984). A major indirect threat to great
apes is conventional industrial logging, which alters their habitat and most importantly creates a
network of roads through the forests, allowing hunters and agriculturalists easy access to previ-
ously remote territory (thus facilitating both hunting and further habitat loss). Civil unrest pushes
displaced people into remote, uninhabited forests where they disturb and may hunt larger species
such as apes (e.g., Hart and Mwinyihali 2001; Kalpers 2001). Civil unrest also results in the prolif-
eration of automatic weapons. This in turn leads to increased hunting of wildlife, and a breakdown
of law and order where wildlife protection laws are often the first to be ignored.
A network of protected areas now exists across the forested humid tropics, where, in theory at
least, apes are protected from hunting by law and the forests themselves are protected from
logging or other human modifications. This combination of protecting the apes themselves and
protecting large areas of good quality habitat should, in theory, have protected viable ape popula-
tions in perpetuity. However, it has recently become clear that infectious diseases and emergent
pathogens also pose significant risks to the world’s great apes (Leendertz et al. 2006; Köndgen
et al. 2008). In large parts of western equatorial Africa, gorilla and chimpanzee populations have
been greatly reduced by Ebola haemorrhagic fever, which causes rapid and dramatic declines in
A field technician in Gabon
measures the perpendicular
distance from a dungpile to a
transect line.
Photo © F. Maisels
2as little as a year (Bermejo et al. 2006). It is believed that this devastating disease has halved ape
populations in the region within the last 20 years (Walsh et al. 2003, 2007). It has been estimated
that, even if hunting and habitat loss could be halted today, it will take more than a century for ape
populations in the areas so far affected by Ebola to fully recover.
Survey and monitoring efforts must not only take into account the behaviour of great apes and
the variables known to be associated with favourable habitat, but also collect information on all
major threats that jeopardize their long-term survival. Specifically, information on human signs and
covariates of disturbance should be recorded during surveys. Information on the location of roads
and railway lines, navigable rivers, human settlements and newly developed agricultural schemes
should also be recorded as these variables affect great ape distribution and density.
Great apes build nests that consist of vegetative structures that can remain visible for weeks or
months. Sample-based methods generally involve indirect counts of nests rather than direct counts
of the apes themselves. Much effort has therefore gone into estimating the size of ape populations
by counting their nests which (i) are much more numerous than their makers (ii) do not run away
and (iii) are more visible. Nests accumulate over many months in any given area. Counting nest
density thus allows us to estimate population density, assuming a standing crop of nests which
decay at a given rate at a given site at a given season. Therefore, they are less sensitive than direct
observations to short-term fluctuations in local density (due to seasonality). Repeated nest counts
have been used to monitor the Virunga mountain gorillas since 1959. Some studies have concen-
trated on small populations based in and around existing protected areas, some on nationwide
surveys, and still others have compared different survey and mapping methods to determine which
was the most accurate, precise, or appropriate for different situations.
To date, most surveys have been carried out using nest counts for a specific site-based pur-
pose. Many have been part of a research project, or a protected area monitoring programme.
Many large areas have been surveyed only once, or not at all, due to lack of human and financial
resources. Even where surveys have been undertaken recently, the results may not be precise
enough to enable detection of change, whether positive or negative (Plumptre 2000). Another
major problem is the conversion of nest counts into great ape population estimates. A constant
fixed relationship between nest density and ape density does not exist. The rate of nest decay
varies greatly between sites and seasons, so ideally surveys should incorporate a locally-derived
and seasonally-appropriate estimate of nest decay rate. The data required to estimate nest decay
can take more than a year to collect prior to the actual survey. This is rarely feasible when a series
of sites across a nation or region is to be surveyed within a limited time (and budget). In addition,
the sheer cost of covering large areas of wilderness on foot remains an obstacle to improving the
precision and accuracy of survey and monitoring data.
Rarely have great ape survey and monitoring data for an entire country or species been centralised
and examined for rate of decline or for changes in past and current geographic distribution. Most
raw data and reports are scattered in desk drawers and filing cabinets or on hard drives or ageing
discs. The recently established web-based Ape Populations, Environments and Surveys “A.P.E.S.”
database (http://apes.eva.mpg.de) aims to centralise all great ape survey data, past and present.
Analysis of these data will allow changes in great ape distribution and numbers to be tracked by
and for the global conservation community. Government agencies in the great ape range states
and international conservation agencies such as IUCN will be able to make informed decisions
based on these data, which will provide a more comprehensive picture of great apes at the species
and population level, not just the site-based information which exists today. All holders of relevant
data are encouraged to contact A.P.E.S. (email apes@eva.mpg.de).
1.2. Scope of these guidelines
Most great apes live in dense tropical forest with poor visibility. Only in a very few cases can we
count apes by direct observation. In the vast majority of cases we must rely on indirect signs or evi-
dence, namely nests or dung. The tricky part is to translate the frequency with which these objects
occur in the habitat into some measure of ape abundance. A variety of survey methods have been
developed, and an overview is given in the next section, Section 2.
3Survey results cannot be extrapolated from one region to another
because ape density has been shown to vary dramatically even
over small spatial scales. The relationship between the number
of nests counted at one location and the number of apes pro-
ducing them might be very different at another location due to
variation in conversion factors (nest production, nest decay) or to
differences in habitat between sites. Therefore, we must choose
an appropriate survey design, one which will allow us to obtain a
representative sample from the area of interest. Section 3 (online)
discusses Survey Design and gives examples.
Ideally there should be adequate time and financial resources to
conduct a well-designed survey of the area of interest. However,
the unfortunate reality is that most projects have limited budgets
and technical expertise. Section 4 (online) discusses Finance
Young chimpanzee, Pan troglodytes verus. and Administration of Survey and Monitoring Projects.
Photo: © K. Hockings
The “garbage in, garbage out” data syndrome holds true for ape
surveys. If the quality of data collected is poor, or the sampling
design is not representative of the area of interest, we will have problems analysing and interpret-
ing the data. Sampling procedure should follow a strict sampling design and field protocol to
ensure consistent data collection of the best possible quality. More details can be found online in
Section 5 (Field Issues: Logistics and Data Collection Protocols) and Section 6 (Training).
Data Analysis is a fundamental part of every survey and monitoring project (Section 7 online).
A variety of analytical procedures and software tools have been developed. It is worthwhile con-
sulting a professional statistician who is experienced in wildlife surveys and monitoring, when
preparing a survey.
Surveys are often conducted for a specific project, which ends with a final report or publication.
Others are conducted as part of a protected area monitoring programme. These data are valuable
and are needed to analyse population trends. The archiving of data is therefore an important issue,
and is discussed in Section 8 (Standardised Reporting, online).
1.3. Defining terms and differentiating surveys from monitoring
Great ape populations show high variability in space and time in their behavioural and movement
patterns. They may respond to seasonal changes in resource abundance or dispersion with dif-
ferent grouping patterns, differences in home-range use, habitat switching, and/or changes in
activity patterns (Wich et al. 2004). They leave signs, such as nests, dung, or feeding remains,
which decompose at different rates throughout the year generally related to rainfall and intensity
of insect activity, especially for dung (Ancrenaz et al. 2004 a). Great apes behave more elusively at
certain times than at others, and adapt their behaviour to persistent threats, such as hunting. Over
a longer time-scale, density (number of individuals per unit area) might change as a result of natural
or human induced factors. As a result, estimating ape abundance is a complex task.
Surveys: Establishing baseline abundance estimates
Surveys provide baseline information on species distribution and population size. Surveys assess a
situation at a particular moment, whereas monitoring programmes are generally designed to detect
progress towards a target situation. Sometimes, due to financial, logistical, or time constraints, ape
surveys can only deliver abundance indices such as nest-group encounter rate, instead of total
population size estimates. Different types of survey approaches exist and are appropriate to differ-
ent situations (see Section 1.4).
Practical and budgetary constraints necessitate a compromise between ideal and achievable
survey objectives. In an ideal world we would have accurate and precise density estimates for all
ape populations, as this would allow for fully informed management and conservation decisions
(status of a particular population, or value of a given area for protection of a sub-population).
However, constraints may oblige the survey or monitoring programme to estimate only relative
abundance indices (see below). In many cases, and especially outside protected areas, similar
4constraints may mean that after a survey is conducted, there is no follow-up. Relative abundance
provides useful information on spatial distribution and population size (Greenwood 1996), and it
can form the baseline for a future monitoring programme. However, baselines of absolute abun-
dance (when possible) are more informative. Surveys are also important when designing protected
area networks, determining reserve boundaries or limits of corridors linking isolated populations,
and when deciding where to invest time and effort in protection or research activities.
Monitoring: Detecting population change
Monitoring refers to the regular, periodic surveying of a population through space and time.
Monitoring programmes can be implemented simply to detect temporal changes in population
size. Ideally a population, distribution, or density target is predefined, so that progress towards this
target can be measured, and management actions can be taken to address identified problems.
Interventions may be short-term to address immediate threats associated with population decline
(e.g., antipoaching patrols), or longer-term remedial strategies based on analysis of longitudinal
trends in both population status and threats. The latter can be based on a more sophisticated
understanding of factors affecting ape population density, and can most usefully inform conserva-
tion management strategies.
Population monitoring contributes to our understanding of the impact of threats, such as hunting,
disease outbreaks, the effects of logging and habitat degradation and/or fragmentation, or the
impacts of tourism activities, and can deliver basic information about the apes’ ecology and their
responses to specific disturbance factors. Given the slow reproductive capacity of great apes,
monitoring programmes should repeat surveys every one to five years. However, there is no gen-
eral rule for survey frequency. It depends on the species surveyed, the situation of a particular
population and threat intensity. Shorter intervals between repeat surveys are better, as they will
provide information for a time series analysis, but costs and staff considerations usually prevent
this. The variance around the estimate in each survey should be small enough that significant
trends over time are detected.
Ideally large mammal and human-impact monitoring programmes should include regularly con-
ducted surveys. The design and timing of such a programme should allow easy and rapid detection
of change. This will inform management about the spatial distribution and abundance of the spe-
cies of interest, and variation in these parameters over time and space — both seasonally and on
a longer-term basis. Importantly, such a programme would contribute information on the sources,
distribution, and intensity of threats (although this will usually be complemented by law-enforce-
ment monitoring specifically designed to gather data on threats). Biological and law-enforcement
monitoring data can then be used to guide conservation actions (adaptive management), and to
evaluate the success or failure of management strategies. In this document we provide information
to aid managers in selecting cost-effective methods that address these key issues.
1.4. Sampling objectives and design
Different objectives require different sampling approaches, and no sampling regime is suitable to
address all questions about the status of a population (more details in Section 2). It is absolutely
vital to choose the most appropriate sampling design and statistical procedures to be used for
data processing and analysis before embarking on either a survey or a monitoring programme.
It is equally important to become trained in the field methods that are going to be used. A pilot
study should be conducted, which not only contributes towards staff training, but also provides
data on variance in encounter rates (number of objects encountered per unit of sample, such as
nest groups per kilometre walked). A combination of the encounter rate itself and of its variation
will determine total sampling effort (number of sampling units to be visited and/or total number of
objects to be counted). If the objectives and design have not been correctly defined, the results will
be at best inconclusive, and at worst inaccurate and misleading. The first step of every survey or
monitoring project should be to carefully identify the goals of the study, the sampling design, and
the analysis protocol before embarking on field activities.
We can distinguish three broad categories of information that can be collected by means of a
sample survey or census; these are outlined below in order of increasing complexity.
5Distribution is usually the easiest and cheapest information to obtain
Objective: To map the occurrence, range, and distribution of a given species.
These surveys range from the collection of basic presence/absence data, to some measure of
relative density per unit area. They are also used to collect geographically specific information
on sources of threat and on habitat preferences of the species of interest. Distributional surveys
include recce (Walsh and White 1999) and occupancy methods (MacKenzie and Royle 2005). Under
certain circumstances occupancy methods can also be used to estimate abundance (e.g. Royle
and Nichols 2003).
Pros: Simple to conduct, do not require highly trained staff, or a high level of expertise for data
analysis. Cheaper and faster to conduct than density estimates. These types of survey can con-
tribute to the identification of key habitats or sites for the conservation of a single species, a guild
of species, or an important habitat type within which the species is known to occur (McGraw 1998;
van Krunkelsven et al. 2000).
Cons: Some methods are sensitive to interobserver differences, and variation in habitat or season-
specific species detectability, and do not provide absolute population estimates.
Abundance estimates through sample surveys
Objective: To obtain an estimate of total population size for a certain area.
Abundance estimates are obtained by sampling a subset of the population of interest. The current
standard method for estimating ape abundance is nest counts using line transect distance sam-
pling. The size of the entire population in the predefined area is then estimated by extrapolating
from the sample. A major assumption is that the sample is representative of the whole area, includ-
ing threats, topography, vegetation and altitude.
Pros: Provides more information about ape population status, when conducted properly, than
simple presence/absence.
Cons: More cost and labour intensive than simple presence/absence. Requires higher-level train-
ing in data collection and analysis.
Total count of a population (census)
Objective: To record all individuals present at a given time at a given location.
Pros: Highly informative, and very accurate if assumption is not violated that all individuals present
are counted once, and no individual is double counted.
Cons: Rarely feasible with great apes, and precision cannot be calculated, since this method is
based on the assumption that all individuals are counted. If animals are missed or double counted
this is impossible to ascertain.
Any of these survey methods can be used for trend estimation or to define management response
by providing information about changes in population status and patterns of human impact,
although to a different level of accuracy. The monitoring of population trends does not necessarily
require an estimate of population size or density. Indices of ape abundance, such as the encounter
rate of ape nests per kilometre walked, or the density of ape nests without converting to individual
apes, can be used if certain requirements are met. However, great care must be taken as detection
probability and sign decay may vary with season and/or rainfall.
1.5. Quantifying ape abundance
The types of information and variables to be recorded in the field obviously depend on the goals of
the survey. Methods need to be standardised before fieldwork begins so as to ensure the collection
of good quality data. Effort should be made to standardise data with other sites/projects/surveys
to allow comparability. Although other sections of this manual will detail these different variables,
here is a brief overview. Parameters to be measured during ape surveys can be divided into four
categories: great ape signs, human signs, habitat descriptors and climate factors.
6Great apes and their signs
Indicators of the presence and abundance of great apes include direct observations, nests, dung,
feeding remains, tools, footprints, vocalisations, carcasses, and verbal information provided by
local people. These variables may be collected with a variety of different methods, depending on
the objectives of a survey. Details are provided in the following sections. Keep in mind that conclu-
sive proof of the absence of a species in a given area will require prolonged study and/or repeated
investigation (Ross and Neeve 2003). Instead, occupancy modelling provides probabilities of ape
occurrence, even for sites at which no ape sign is detected (MacKenzie and Royle 2005).
Human signs
The type, distribution, and intensity of human activities affecting great apes and their habitats need
to be quantified in order to assess their impact on great ape population size and spatial distribu-
tion, and on the probability of being able to effectively manage areas for improved survival of these
species.
Vegetation type and geographic features
Vegetation type is an important factor determining the distribution and abundance of food and
shelter. In addition, predator abundance and distribution (including humans as predators) is partly
determined by vegetation. Topography and the presence of natural barriers are also key factors.
Vegetation can be described both qualitatively and quantitatively. A qualitative assessment uses
descriptions of the major features encountered in the field, for example, a Raphia swamp, or a
terra firma mixed forest. Quantitative descriptions use numerical values to document each feature
(e.g., a 20% slope), or the percent botanical composition of different habitat types. The selection
of variables to be recorded during fieldwork will be determined by the survey objectives, avail-
able timeframe, the skills of fieldworkers, and the size and current knowledge of the area to be
investigated.
Climatic factors
Additional information sometimes needed to interpret population distribution and change includes
temperature, humidity, and rainfall. Their effects are probably greatest where they determine what
the vegetation types are and how productive they are, and therefore how many apes the habitat
can support. They will almost certainly have some bearing on disease occurrence and prevalence,
and on human activities in the habitat. Climatic variables also affect rates of decomposition of
nests, dung, and other sign.
Land use classification
The administrative status of the sites in which each ape sign is found (whether or not it is a pro-
tected area, mining or logging concession, etc) should be recorded, as more than 80% of ape
habitat lies outside protected areas.
Section 2. Review of Great Ape Survey Methods
2.1. Introduction
This section gives an overview of the variety of methods used to survey and monitor great ape
populations. The most commonly used methods are monitoring of focal groups and conducting
nest counts on transects. We also cover less frequently used approaches such as total counts and
recently developed techniques such as helicopter surveys. The section closes with a summary on
potential future developments such as genetic or camera capture-mark-recapture surveys that
have been successfully applied to other large mammals. An extensive literature exists for most
survey methods, and the reader is encouraged to obtain more details about the respective meth-
ods from the bibliography at the end of this document.
7Survey objectives need to be clearly defined. For example, do we want to know the spatial distribu-
tion of apes at a given site, or do we want to know the number of individuals in a given population?
Are we most interested in the temporal trends of a population and their causes, or do we need to
know the causal factors of population density gradients? Not every survey method can address
these questions simultaneously. Depending on the objective of the survey, different approaches
are required (Table 1) and decisions need to be taken on the design and the data to be collected
(Box 1).
2.2. Distance sampling methods
Currently the most widely used approach is distance sampling, which has been described exten-
sively (Buckland et al. 1993, 2001, 2004). Distance sampling can be based either on the detection
of animals themselves or on their signs (also called cues) such as nests and dung on predefined
transects.
Observers applying distance sampling techniques follow either
a series of line transects or cover a series of point transects. In
Box 1. The decisions required in
either case, information (perpendicular distance, radial sighting
preparation for great ape surveys distance and angle, or simply radial distance for point transects)
Based on the objective of the survey, decisions need to is collected to allow calculation of the shortest distance from
be made about: the line or point to detected objects of interest (individual ani-
mals, animal groups, nests, etc.). With the exception of objects
1) Objects to be recorded: Nests, Dung,
on the transect line or at the centre point, it is not assumed
Feeding Signs, Footprints, Individuals, DNA,
that all objects are detected. This is especially useful in forest
Vocalisations
habitats with limited visibility, where the probability of detect-
2) Survey approach: e.g. Transect survey, Recce ing an object decreases rapidly with increasing distance from
survey, Plot survey, Full count, Aerial survey, the observer. Distance sampling uses statistical tools to esti-
Capture-Mark-Recapture Survey. mate the drop-off in detection probability with increasing dis-
3) Auxiliary variables: e.g. Nest decay rate, tance from the observer and to ultimately infer the true object
Deposition/Construction rate, Group size. abundance (Whitesides et al. 1988; Buckland et al. 1993, 2001,
2004). Probability of detection is modelled as a function of the
observed distances and then combined with encounter rate
Table 1. List of survey methods
Method Objective Pros/Cons Section
Distance sampling Presence/Absence Well developed, robust, currently the standard ape survey method 2.2
Distribution
Density and abundance
Distance related methods Presence/Absence Easily applicable, prone to bias, if not carefully done 2.3
Distribution
Abundance
Index methods Presence/Absence Easily applicable, prone to bias, if not carefully done 2.4
Distribution
Abundance index
Occupancy methods Presence/Absence Not yet applied for ape surveys 2.6
Distribution
Abundance
Full counts Distribution Only rarely feasible, critical assumptions are easily violated 2.7
Abundance
Capture-recapture surveys Abundance Ape ranging behaviour makes further development necessary 2.8
Genetic surveys (Minimum) Theoretically highly accurate, methods for apes still in 2.8
Abundance development, require high level of expertise
Population structure
Camera trapping Presence/Absence Great potential, methods still in development 2.8
Distribution
Abundance
Population structure
Home range estimator Abundance Only rarely used, method needs further development 2.9
Interview techniques Presence/Absence Provide rapidly information on ape occurrence over large area 2.10
Often inaccurate
8(and estimated group size, if groups are the unit of observation) to calculate the density and abun-
dance of objects of interest in the study area. As long as a random sample is obtained by means of
a well-designed survey, and the number of objects and the distance from each object at its initial
location to a point or to a line is recorded accurately, reliable density estimates for the objects can
be obtained — even if an unknown number located away from the observer go undetected. This is
a crucial aspect of distance sampling theory.
Major assumptions of distance sampling
The major assumptions of this method (Buckland et al. 2001)
are outlined in Box 2. Surveys must be designed and conducted Box 2. Critical assumptions underlying
by people who are competent in distance methodology (see
distance sampling theory
Section 3 Survey Design, online). Poorly designed surveys with
improperly measured distances will result in inaccurate density 1) Line or point transects are located randomly with
estimates. Lines or points need to be placed randomly or sys- respect to the distribution of the animals or objects of
tematically with a random start point. Establishing transects interest.
along existing roads or trails used by humans will not achieve 2) All animals or objects directly above or on the line or
good density estimates, because human presence is very likely point must be detected.
to alter the ape abundance. Laying transects along unused
3) Distance to animals detected is recorded at their initial
roads or trails means that the habitat is not sampled in a repre-
location, before they move towards or away from the
sentative manner: roads and trails are often either on ridges or
observer.
along waterways, thus over or under-sampling some habitats.
Roads are also normally flanked by a corridor of secondary light- 4) Sightings are independent events.
loving vegetation, a relatively rare habitat in the forest matrix as 5) Distances and/or angles are measured accurately and
a whole, and one preferred by some apes (e.g. gorillas). precisely.
Violation of the assumption that all objects located above and
on the transect line are detected will create a major bias. Some
objects (especially nests) can go undetected even if they are directly above the observer; this leads
to underestimates of the true density (see van Schaik et al. 2005). Aside from detecting all objects
of interest directly on/above the line or point, the distance measurement must be obtained with
accuracy before there is any movement in reaction to the observer. If sightings are not independ-
ent events this does not bias the density estimate, but it does have implications for the estimate
of variance. Hence for animals or objects that occur in groups (apes or nest sites), the group is
the preferred unit of observation and the distance to the centre of the group is the information
required.
Assuming that these basic assumptions are met in the design and execution of field surveys, the
software package DISTANCE (Thomas et al. 2006), which is free to download, is normally used
to design surveys and to analyse survey data (to fit a detection function, and estimate density
and sampling variance). See Section 7 Data Analysis (online) for more detail, and to obtain the
software and other information go to: http://www.ruwpa.st-and.ac.uk/distance/.
Other factors to consider with distance sampling
Observer effectiveness: Several studies have shown that experience influences object detec-
tion (e.g., nest detection: van Schaik et al. 2005). Surveyors’ skills depend on several factors:
a) Individual ability to detect objects: individual differences in vision, hearing, height and dedica-
tion will affect the number of nests detected during surveys. However, because distance sampling
models the probability of detecting the objects of interest, keeping the same individual observers
or observers of the same skill level throughout one sampling cycle will eliminate this first problem;
b) Fatigue: it is important to keep survey sessions short. If surveyors feel tired, they will detect fewer
objects and thereby introduce additional variability into the detection process; c) Concentration:
if too many types of objects have to be recorded (e.g., multi-species survey), it is highly likely that
detection probability and data quality (the accuracy of the distance measurements, for example)
will be affected — in short, do not try to look for too many things at once. Normally one person
should look up for tree nests and another observer should look down for ground nests (when appli-
cable) and for ancillary data such as dung, footprints, or signs of human activities.
9Environment: Environmental variables and seasonality are likely to determine the number of
objects detected by affecting encounter rates, the detection process, or even group sizes: such
environmental factors include weather (wind, rain, available light, angle of the sun), forest structure
and composition, forest height, and so on (Bibby and Buckland
1987). Physical features of the survey area also affect observ-
ers’ abilities to detect individuals, nests and other signs: harsh
Box 3. Line transect sampling conditions (steep areas, marshes, rivers, thick vegetation),
for instance, hamper efficient detection or change encounter
rates. However as long as these factors are recorded for each
object detected, they can be included in analyses as covari-
d9
ates. Similarly, recording variables that are likely to influence
d7
encounter rates (e.g., noting when habitat type changes) allows
d8
d6
d4
for post-stratification by these variables during analysis.
d5
d2
d3
Adequate sample size: A minimum of 60– 80 observations is
d1
required to fulfil the basic requirements of distance sampling.
However, considerably larger samples are required to generate
reliable estimates of other values critical to estimating densities
A single transect line is shown. Circles represent target objects and population sizes (see online Section 3 Survey Design and
distributed in the area around the transect. The perpendicular Section 7 Data Analysis). In areas with low densities of objects
distance of the nine objects actually detected is denoted as (nest groups, individuals) these minimum numbers of observa-
d1, d2…d8 (see Buckland et al. 2001).
tions can be difficult to reach unless substantial effort is allo-
cated to the surveys. Because nest groups are often clumped
within suitable habitat, it is important to determine a transect
length that will be long enough to minimise the probability that
Box 4. Aerial orangutan nest survey there are zero nests on any given transect. Examination of exist-
ing data from the area or data from a pilot study can inform this
in Sabah, northeast Borneo
important decision.
Surveys in Sabah were carried out with a small Bell
206 Jet Ranger aircraft at a constant speed and height
Distance sampling on line transects
(70 km/h and 60–80 m above canopy). A systematic
stratified sampling method using equidistant parallel line The line-transect is a plotless method in which the observ-
transects was designed, the location of the first line being ers walk along straight lines of known length, which are either
randomly selected (see Ancrenaz et al. 2005 for detailed placed randomly or systematically across the survey area (see
methodology).
Box 3). The area sampled along a line transect is the hypotheti-
Nest detectability from a helicopter or fixed-wing aircraft cal area in which all sign or animals are assumed to have been
depends heavily on forest canopy structure and observer
detected. This area is equal to 2 Lμ, where L is the total length
ability. Ideally, specific models for deriving nest densities
from aerial indices should be designed for different habi- of the transect and μ is the width of the strip within which the
tat types and for different levels of observer skill. Before number of objects missed is equal to the number seen beyond
such models are designed, ground-truthing must be con- this distance). μ is known as the effective strip width and is
ducted in different habitat types in order to validate a determined using Distance software.
baseline model and to determine habitat-specific correc-
tion factors when necessary. Video cameras mounted on To estimate μ, perpendicular distances from target objects
each side of the aircraft can record all sightings and the detected on a transect line must be recorded accurately.
recording can be carefully analysed after the flight. Sometimes, to ensure that the assumptions underlying dis-
It is not possible to record nest distance from aerial tance sampling are met, the sighting/radial distance and angle
transect lines, and thus it is impossible to derive oran- (which can be used to calculate perpendicular distance) are
gutan nest density estimates directly from these flights. recorded instead; this mostly applies to observations of live ani-
Instead encounter rates are obtained. Aerial surveys are
mals. Methods using sighting distances also require a sighting
conducted in conjunction with a pre-calibrating stage
angle to calculate perpendicular distance and hence to estimate
based on nest surveys on the ground to obtain more tra-
ditional orangutan nest density estimates. A robust sta- density (reviewed in Hayes and Buckland 1983). It is generally
tistical model can then be developed, correlating aerial recognised that this sighting distance and angle method is sta-
indices with orangutan nest densities. This model was tistically invalid compared to the perpendicular distance method
applied to all forests in the State of Sabah for which only (e.g., Plumptre and Cox 2006).
aerial data were available. In future it may be possible to
group nest sightings into distance intervals either side of Perpendicular distances can be measured (or estimated) directly
the aircraft, thus facilitating estimation of the probability (ungrouped data) or placed in proper distance categories
of detection. (grouped data). The latter should be considered as an option
10only when it is impossible to obtain exact distances because grouping data severely restricts the
options for analysis. Having collected exact distance data, one might still choose to group these
data to deal with distance measurement problems; therefore exact distance data offer more flex-
ibility at the analysis stage.
Aerial strip and line transect surveys
In Sabah (North-East Borneo), aerial line transect surveys have been employed to survey orangu-
tan nests throughout the state (Ancrenaz et al. 2005). Aerial surveys significantly increase the area
sampled per unit time. They also provide a means of surveying remote areas that are not readily
accessible from the ground, and can be conducted in much shorter time and require lower human
investment than typical ground surveys (Caughley 1974; Ancrenaz et al. 2004b). The utility of aerial
surveys depends on the proportion of target objects that observers can accurately detect from the
air; if substantially less than 100% of target objects are detectable from the air, then methods are
needed to correct observed values (see Box 4).
Aerial nest surveys will likely be of little use in Africa, because African great apes nest lower in the
canopy or even on the forest floor and nests are hidden by the canopy. It may also be impossible
to distinguish between gorilla and chimpanzee nests from the air in areas where the two species
are sympatric. However, aerial surveys could prove useful to determine population distribution and
relative abundance in open landscapes, such as savanna mosaics in West Africa.
Distance sampling on point transects
Point transects (or Point Counts) can be thought of as line transects of zero length. A series of
points is investigated and the radial distance between detected
objects and the centre point are measured (see Box 5). In prac-
tice, a series of points is located along a straight line. In point Box 5. Point transect sampling
transects, only the area at the centre point can have a detec-
tion probability of one. The area searched on point transects is
A = π r 2, where r is the estimated effective radius.
2.3. Distance-related methods — strip transects and plots
Strip transects give a total count within a given rectangle (or
r8
quadrat) of known length and width, thus area. No distances
r7
are measured during strip transect sampling; but this method
r5
requires that all objects in the strip are detected. With great r4 r3
r1
apes, this assumption is likely to be violated, especially in r9
r2
forest, because the observer only walks down the middle and r6
may miss objects at the edges of the strip, leading to an under-
r10
estimate of true density (e.g., Vincent et al. 1996). Therefore, a
modified approach has been used to survey orangutan nests in
a Bornean swamp forest: Circular or box-plots of a fixed size
were randomly located on a map and delineated in the forest.
Their boundaries were clearly marked, and plots searched thor-
oughly to count all objects within these plots. This approach pre-
supposes a finite population sampling theory (Cochran 1977), The radial distances of the 10 objects detected are denoted
where the exact size of a survey area is known in advance and as r 1, r 2…r10 (see Buckland et al., 2001). The circle represents
the maximum distance from the centre at which objects are
where all objects in the sampling area are detected. Plot counts
detected.
produced a significantly higher nest density estimate than
line transects, and came close to the estimated true density
obtained via other approaches (van Schaik et al. 2005).
2.4. Index sampling
Index sampling provides encounter rates, which are assumed to be proportional to actual densi-
ties. These are often easier to obtain than density estimates. However, such indices may reflect
variance in factors other than density. They may also reflect differences in detection probability
between observers and between vegetation types, or variation in production rates, decay rates,
11and clumping of nests or dung. Possible sources of variation
Box 6. Recces combined should be carefully considered when using indices, and controls
with line transects should be established to interpret and minimise such variation,
such as plotting cumulative number of observations per unit
A section of a survey design is shown. The transects
distance and sampling until the plotted curve levels out.
(short solid lines) are connected by guided recces (dashed
lines). Perpendicular distance is measured only along the Reconnaissance walks. The basic principle of reconnaissance
line transects. or “recce” walks is to walk in a predetermined direction taking
the path of least resistance through the survey area (Walsh and
White 1999). “Guided” recce walks should deviate no more than
40° from a predetermined direction; they are considered more
informative than “travel” recce walks, which can deviate by any
degree. Data collection is the same as on line transects (number
of objects, distance along the line, associated ancillary data),
except that perpendicular distances are not recorded and the
width of the strip sampled is fixed (usually 1 m either side of
the observer) to minimise variation in visibility between habitat
types. Recce walks are often used in survey pilot studies; they
are valuable in allowing surveyors to become acquainted with a
study area (vegetation, topography) and to familiarise themselves with detection of different signs.
Recce walks are also used to collect data on the spatial distribution of a species. Even though
these indices can be useful to some extent, it should be kept in mind that recces do not provide
an unbiased sample of the area, and variation in recce encounter rates is very likely to result from
a variety of sources and not just variation in density. Biomonitoring protocols often combine line
transects with recces (Box 6).
2.5. Direct vs. indirect surveys
Direct Surveys. These are counts of individual animals or groups of animals, and are possible if
animals are easily detectable and move slowly with respect to the observer. This is unfortunately
not usually the case with great apes, which tend to be shy and elusive. For known communities of
great apes, direct monitoring is more likely to be possible and it can provide evidence of fluctua-
tions in ape population size (Boesch and Boesch-Achermann 2002; Bermejo et al. 2006; Pusey
et al. 2007). Most line transect surveys of African great apes count groups rather than individuals.
This is required to meet the criterion of independent observations, which is more likely to hold true
for groups than for individuals. However, it is also important to count all individuals encountered in
groups, and to factor the mean and standard deviation of group size into estimates of density and
population size.
Indirect surveys. Because direct surveys of great apes are rarely feasible, the majority of sur-
veys are conducted using indirect traces of ape presence. Signs (or cues) of ape presence are
counted, not individual apes or groups. The easiest to see and the most numerous are ape nests.
Other signs, such as dung, can also be counted, but this proves almost impossible for the strictly
arboreal orangutans. Indirect surveys aiming to provide density estimates of apes must be based
on known rates of production of the target objects and of their decay, and the proportion of the
population that actually leaves the ‘detectable’ signs, so that ape density can be calculated from
the density of indirect signs. Results obtained by indirect surveys should be validated against esti-
mates of true density, whenever possible.
While the goal of surveys is to detect true temporal or spatial variation in ape population size, indi-
rect surveys may yield different density estimates for a number of reasons that are unrelated to real
variation in ape abundance. Some sources of sampling error, such as differences in methods, vari-
ation in skill among survey teams, and differential detectability of nests in different forest types can
be readily addressed through training, analytical tools, and use of standard protocols. However,
other sources of error are more difficult to control. The largest source of error when calculating
ape density estimates from nest survey data is the estimate of nest duration. Nest duration (i.e.,
the mean time for which an ape nest remains visible) varies substantially both within and between
areas for a wide range of factors, including rainfall, altitude, soil pH, nest height and exposure, and
12You can also read