Regional Assessment of the Conservation Status of Snubfin Dolphins (Orcaella heinsohni) in the Kimberley Region, Western Australia
←
→
Page content transcription
If your browser does not render page correctly, please read the page content below
ORIGINAL RESEARCH
                                                                                                                                             published: 21 January 2021
                                                                                                                                       doi: 10.3389/fmars.2020.614852

                                            Regional Assessment of the
                                            Conservation Status of Snubfin
                                            Dolphins (Orcaella heinsohni) in the
                             Edited by:
                         Jeremy Kiszka,
        Florida International University,
                                            Kimberley Region, Western Australia
                          United States
                                            Phil J. Bouchet 1,2* , Deborah Thiele 3 , Sarah A. Marley 4 , Kelly Waples 5 ,
                         Reviewed by:       Frank Weisenberger 6† , Balanggarra Rangers 7‡ , Bardi Jawi Rangers 8‡ ,
                         Simon J. Allen,    Dambimangari Rangers 9‡ , Nyamba Buru Yawuru Rangers 10‡ , Nyul Nyul Rangers 11‡ ,
 University of Bristol, United Kingdom
                                            Uunguu Rangers 12‡ and Holly Raudino 5
               Rebecca Ruth McIntosh,
  Phillip Island Nature Parks, Australia    1
                                              Centre for Research into Ecological & Environmental Modelling, University of St Andrews, St Andrews, United Kingdom,
                                            2
                 *Correspondence:             School of Mathematics and Statistics, University of St Andrews, St Andrews, United Kingdom, 3 Independent Scientist,
                     Phil J. Bouchet        Capel, WA, Australia, 4 Institute of Marine Sciences, School of Biological Sciences, University of Portsmouth, Portsmouth,
            pb282@st-andrews.ac.uk;         United Kingdom, 5 Biodiversity and Conservation Science, Department of Biodiversity, Conservation and Attractions,
               pjbouchet@gmail.com          Kensington, WA, Australia, 6 Cultural and Environmental Services Unit, Land and Sea Management Unit, Kimberley Land
                 † Present address:         Council, Broome, WA, Australia, 7 Balanggarra Aboriginal Corporation, Wyndham, WA, Australia, 8 Bardi and Jawi
                                            Niimidiman Aboriginal Corporation, Broome, WA, Australia, 9 Dambimangari Aboriginal Corporation, Derby, WA, Australia,
                Frank Weisenberger,         10
                                               Nyamba Buru Yawuru, Broome, WA, Australia, 11 Nyul Nyul PBC Aboriginal Corporation, Broome, Western Australia,
      Frank Weisenberger Consulting,        12
                                               Wunambal Gaambera Aboriginal Corporation, Kalumburu, WA, Australia
            Melbourne, VIC, Australia
    ‡ Balanggarra Rangers, Bardi Jawi
   Rangers, Dambimangari Rangers,           Implementing conservation measures for data-limited species is a fundamental
 Nyamba Buru Yawuru Rangers, Nyul           challenge for wildlife managers and policy-makers, and proves difficult for cryptic
      Nyul Rangers, Uunguu Rangers
 Collaborative authors are included in      marine animals occurring in naturally low numbers across remote seascapes. There
                the acknowledgments         is currently scant information on the abundance and habitat preferences of Australian
                                            snubfin dolphins (Orcaella heinsohni) throughout much of their geographical range, and
                   Specialty section:
         This article was submitted to      especially within the Kimberley region of northern Western Australia. Such knowledge
                    Marine Megafauna,       gaps curtail rigorous threat assessments on both local and regional scales. To address
               a section of the journal
          Frontiers in Marine Science
                                            this and assist future conservation listings, we built the first comprehensive catalog
        Received: 07 October 2020
                                            of snubfin dolphin sightings for the Kimberley. We used these data to estimate the
      Accepted: 18 December 2020            species’ extent of occurrence (EOO) and area of occupancy (AOO) along the region’s
       Published: 21 January 2021
                                            7,000 km coastline, following a simple Bootstrap bivariate kernel approach to combine
                             Citation:
                                            datasets of varying quality and quantify uncertainty. Our catalog consists of 1,597 visual
   Bouchet PJ, Thiele D, Marley SA,
          Waples K, Weisenberger F,         detections of snubfin dolphins made over a period of 17 years (2004–2020) and collated
    Balanggarra Rangers, Bardi Jawi         from multiple sources, including online biodiversity repositories, peer-reviewed scientific
   Rangers, Dambimangari Rangers,
 Nyamba Buru Yawuru Rangers, Nyul
                                            articles, citizen science programs, as well as dedicated marine wildlife surveys with
 Nyul Rangers, Uunguu Rangers and           local Indigenous communities and Ranger groups. Snubfin dolphins were consistently
          Raudino H (2021) Regional
                                            encountered in shallow waters (
Bouchet et al. Conservation Status of Snubfin Dolphins
and 700 (656–736) km2 respectively, suggesting that snubfin dolphins in the Kimberley
are likely Vulnerable under IUCN criteria B2 at a regional scale, in keeping with their
global classification. Our study offers insights into the distribution of a vulnerable coastal
cetacean species and demonstrates the value of integrating multiple data sources for
informing conservation assessments in the face of uncertainty.
Keywords: area of occupancy (AOO), extent of occurrence (EOO), citizen science (CS), bootstrap, data
integration, geographic range, cetacean marine mammal
INTRODUCTION never been collated. Such patchy knowledge impedes assessments
of the species’ conservation status under IUCN criterion B
Australian snubfin dolphins (Orcaella heinsohni, hereafter (“geographic range”) (Allen et al., 2012; Hunt et al., 2017; Smith
‘snubfins’) are cryptic, small cetaceans endemic to the tropical et al., 2018; Waples and Raudino, 2018), and poses obstacles to its
waters of northern Australia and southern Papua New Guinea. long-term management.
Only differentiated from the closely related Irrawaddy dolphin Despite early criticism (e.g., Possingham et al., 2002), there has
(Orcaella brevirostris) less than two decades ago (Beasley et al., been increasing appreciation of the utility of IUCN Red Listings
2005), the species remains poorly known, and is listed as globally (henceforth ‘RLs’) as quantitative instruments for supporting
Vulnerable under criteria A and C [level VU A2cd + 3cd + 4cd; decision-making and conservation priority-setting in the face of
C2a(i)] of the International Union for the Conservation of such data deficiency (Rodrigues et al., 2006; Hoffmann et al.,
Nature (IUCN)’s Red List of Threatened Species (Parra et al., 2008; Maes et al., 2015; Le Breton et al., 2019). As anthropogenic
2017). This classification largely reflects suspected declines in impacts are not distributed evenly everywhere and management
population size stemming from incidental mortality in fishing actions are commonly administered at local levels rather than
nets (Parra and Jedensjö, 2014), as well as anticipated habitat globally (Brito et al., 2010; Pagel et al., 2014; Jenkins and Van
loss in the face of growing industrial developments throughout Houtan, 2016), several countries around the world have begun
much of nearshore tropical Australia (Allen et al., 2012; Cagnazzi to develop their own regional RL schemes aimed at quantifying
et al., 2013b). A limited body of research indicates that snubfins threats within discrete parts of species’ ranges (Gärdenfors, 2001;
occur in isolated populations (Brown et al., 2014b) occupying Gärdenfors et al., 2008; Nourani et al., 2017). To be rigorous,
shallow, inshore waters in proximity to freshwater inputs such as such efforts ought to be supported by systematic monitoring
estuaries and tidal rivers (Parra et al., 2006b; Palmer et al., 2014b). programs designed around standardized scientific surveys, yet
However, a comprehensive understanding of the spatial ecology, these remain difficult to execute and sustain over the long
regional distribution, and environmental preferences of snubfins term in most remote areas (Grech et al., 2014). A promising
is still lacking. solution to fill information gaps is to combine different data types
In particular, while studies of snubfins have been conducted from alternative sources, which are often opportunistic in nature
at selected sites in Queensland (Parra, 2006; Parra et al., 2006a,b, (Cheney et al., 2013; Pagel et al., 2014). For instance, non-expert
2011; Cagnazzi et al., 2013a,b), the Northern Territory (Palmer “citizen scientists” now make substantial and active contributions
et al., 2014a,b), and Western Australia (Thiele, 2010; Brown to species mapping by logging ad hoc observations of wildlife
et al., 2014a, 2016, 2017), extensive portions of the species’ using smartphones or other mobile computing technologies
known Australian range have been subject to little or no survey (Devictor et al., 2010; Tiago et al., 2017). These can be particularly
effort (Kaschner et al., 2012). In Western Australia, prominent valuable in biogeographical studies of coastal cetaceans, and
gaps in sampling coverage remain across the Kimberley, owing can complement or even replace dedicated surveys for tracking
to the logistical difficulties and prohibitive costs associated distributional changes over broad spatial extents (Embling et al.,
with accessing many parts of the region’s remote, 7,000 km- 2015; Lodi and Tardin, 2018; Alessi et al., 2019). Similarly,
long coastline (Kordi et al., 2016). Snubfins, named munumba community-based approaches that harness the skills, interests,
in Wunambal and Gaambera languages, have been known and capacity of Indigenous Ranger organizations are supporting
to Traditional Owners for several millennia (Karadada et al., conservation efforts locally, including the monitoring of trends
2011), yet the earliest historical account of the species by in species and habitats (Grech et al., 2014; Jackson et al., 2015).
Europeans within the Kimberley only dates back to 1821 at The latter is particularly relevant where Indigenous people are
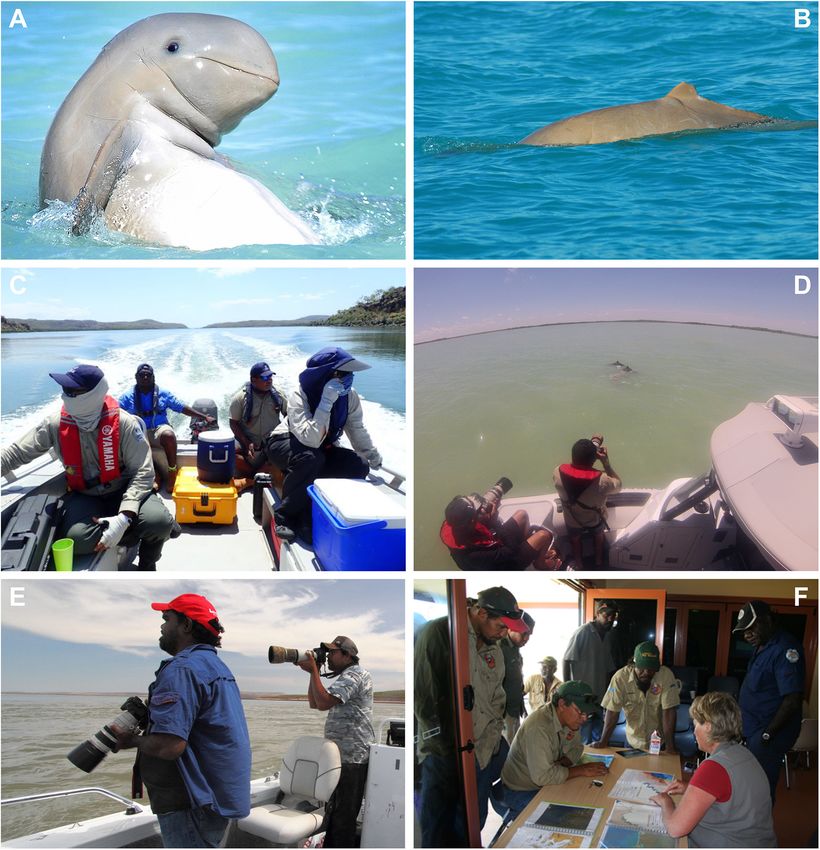
Prince Regent River (15.452◦ S; 125.065◦ E, Figure 1) (King, recognized as land managers in their own right through Native
1825). Notwithstanding, no targeted sampling was undertaken Title, and where they have developed and implemented Healthy
in the area until 2004, when a limited number of aerial and Country Management Plans that articulate their vision, objectives
shipborne visual transect programs were kick-started (Jenner and targets for Indigenous Protected Areas (Rist et al., 2019).
et al., 2008, 2014; Thiele, 2010). While these surveys confirmed In this study, we present the first regional conservation
the presence of snubfins in low densities within estuaries and assessment of snubfin dolphins throughout northern Western
coastal embayments, their initial implementation was largely Australia. Snubfins are currently earmarked as a key target species
sporadic. Furthermore, observations made in subsequent years by for fundamental research in Australia (Waples and Raudino,
researchers, Indigenous Rangers, and government agencies have 2018). In 2013, with support from the Australian Federal
Frontiers in Marine Science | www.frontiersin.org 2 January 2021 | Volume 7 | Article 614852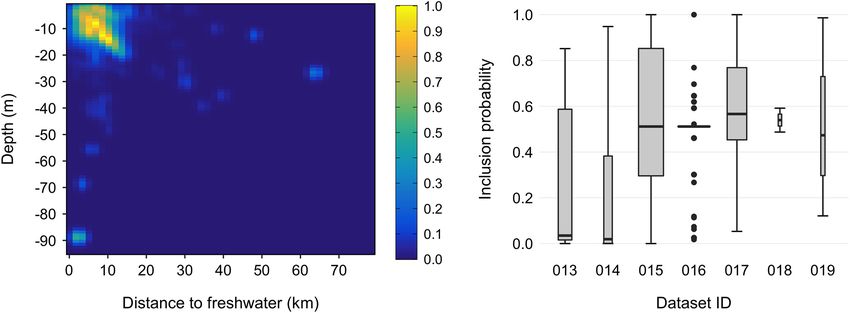
Bouchet et al.                                                                                                                 Conservation Status of Snubfin Dolphins

  FIGURE 1 | Visual detections of snubfin dolphins (Orcaella heinsohni) throughout the Kimberley region of Western Australia between 2004 and 2020. Labeled insets
  display the distribution of both primary and secondary sightings (see Table 1) at key sites, including (A) Roebuck Bay, (B) Cygnet Bay, (C) Prince Regent River, and
  (D) the Cambridge Gulf. The inset map in the lower right corner shows the boundaries of Indigenous Sea Countries covered by field surveys. These encompass the
  following Native Title determinations (from north to south): Balanggarra (BAL), Uunguu (UNG), Dambimangari (DMB), Mayala (MYL), Bardi Jawi (BDJ), Bindunbur
  (BND), and Yawuru (YWR) Sea Countries. Note that Rangers from the Bindunbur community are referred to as Nyul Nyul. Map baselayer: Google © 2019.

Government, efforts were made to develop a National Research                           Environment, 2013, 2015). The EOO and AOO are standardized
Strategy that could help deliver a better understanding of the                         indices of wildlife distribution that are strong and consistent
ecology of tropical inshore dolphins in support of improved                            predictors of extinction risk in the marine environment, as larger
conservation decision-making (Department of the Environment,                           range sizes provide a buffer against local population declines
2013, 2015). Part of this process entailed a technical workshop,                       and mean that species are less likely to experience catastrophic
during which marine mammal experts were asked to recommend                             or range-wide losses (Payne and Finnegan, 2007). Importantly,
suitable methods for determining the conservation status of                            the EOO/AOO are suitable for assessing conservation status
snubfins nationally (Brooks et al., 2014). Estimating the species’                     even when there is limited information on local threatening
extent of occurrence (EOO) and area of occupancy (AOO)                                 processes and the distribution of a taxon is only known from
under IUCN criterion B was identified as a high priority, on                           opportunistic observations, unlike other IUCN metrics (Dauby
the proviso that such efforts be underpinned by an exhaustive                          et al., 2017). In particular, criterion B tends to be more suitable
compilation of available datasets, with a strong emphasis on                           than abundance metrics (i.e., IUCN criterion A) for coastal
collaboration and Indigenous engagement (Department of the                             dolphin populations whose sizes are challenging to estimate

Frontiers in Marine Science | www.frontiersin.org                                  3                                           January 2021 | Volume 7 | Article 614852
Bouchet et al.                                                                                                                   Conservation Status of Snubfin Dolphins

TABLE 1 | Summary of datasets used for assessing the regional conservation status of snubfin dolphins (Orcaella heinsohni) in the Kimberley region.

Class            Dataset ID     Collector(s)        Affiliation/Source   Description                       Type       Year       Platform      GPS       Effort (km)    N

Primary           OH-001            DT                     DU            Marine wildlife surveys             O        2004           V      Complete         607        6
                  OH-002            DT                     DU            Marine wildlife surveys             O        2006           V      Complete         466       13
                  OH-003          DT, CJ                  CWR            Marine wildlife surveys             S     2006–2007         V        Partial       6,895       4
                  OH-004         DT, PJB                   DU            Cetacean photo-identification       S     2007–2012         V        Partial       2,418      316
                                                                         surveys
                  OH-005       KRG, HR, KW      Ranger groups, DBCA Ranger surveys (including               S, O   2009–2019         V        Partial       8,201      117
                                                                    training surveys and dolphin
                                                                    census in Yawuru
                                                                    Nagulagan/Roebuck Bay)
                  OH-006            AB                   MUCRU           Cetacean photo-identification      S, O   2012–2016         V      Complete       15,658      436
                                                                         surveys
                  OH-007      DT, SM, CSK, JF            WAMSI           Cetacean photo-identification       S        2014           V      Complete         619       95
                                                                         surveys
                  OH-008            CJ                    CWR            Opportunistic sightings             O        2007           V       No tracks        –         1
                                                                         (non-research activities)
                  OH-009            CP                    NTG            Opportunistic sightings             O     2010–2011        V, K     No tracks        –         5
                                                                         (non-research activities)
                  OH-010            SA                   MUCRU           Published literature               S, O      2012           V       No tracks        –         7
                  OH-011            JF                     EK            Opportunistic sightings             O     2012–2013         V       No tracks        –         6
                                                                         (non-research activities)
                  OH-012        DT, AB, CP                NMap           Opportunistic sightings             O     2004–2016         V       No tracks        –        201
                                                                         (research activities)
Secondary         OH-013            PB                   CSIRO           Marine wildlife surveys             S     2015–2017         A      Complete        7,859      31
                  OH-014        Unidentified              NMap           Anecdotal sightings by              O     2007–2016        L, V     No tracks        –        12
                                                                         members of the public
                  OH-015        Unidentified               DW            Anecdotal sightings by              O     2018–2020        L, V     No tracks        –        104
                                                                         members of the public
                  OH-016        Unidentified          Public domain      Anecdotal sightings by              O     2005–2010        L, V     No tracks        –        174
                                                                         members of the public
                  OH-017        Unidentified             CWalk           Citizen science smartphone          O     2013–2014        L, V     No tracks        –        64
                                                                         application
                  OH-018        Unidentified            ALA/GBIF         Online biodiversity atlas           O     2009–2012        L, V     No tracks        –         2
                  OH-019        Unidentified              WWF            Opportunistic sightings by          O        2015           V       No tracks        –         3
                                                                         partner organization

Dolphin sightings (total number, N) were compiled from a variety of sources, including systematic (S) and opportunistic (O) surveys conducted from a range of sampling
platforms (vessels, V; kayaks, K; aircraft, A; and land-based sites, L). Surveys undertaken by trained personnel and/or marine mammal experts (primary class) were
considered accurate and reliable. Sightings crowdsourced from online repositories or provided by members of the public (secondary class) may be subject to taxonomic
and positional errors, and were treated as more uncertain (see main text for details). Sampling effort is expressed in km of tracklines searched, wherever this is known
(i.e., where records of GPS tracks existed and were either complete or partially available). Data collectors are listed in Supplementary Table S1, with individuals in bold
font also being authors on this manuscript. Affiliations are given in Supplementary Table S2, and are correct as of the time of the surveys, but may have changed since.
Note that Coastal Walkabout was decommissioned in 2015. For more information about the initiative, see https://sites.nicholas.duke.edu/johnston/2013/11/28/coastal-
walkabout-launch/.

but predicted to be declining (Brooks et al., 2017), and/or                              yielding single threat classifications that do not explicitly
where such estimates are not available over most of the species’                         reflect the amount and reliability of their underlying inputs
range (Parra and Cagnazzi, 2016); both of which apply directly                           (Akçakaya et al., 2000). Some efforts to tackle this issue have
to snubfins. Nonetheless, crowdsourcing disparate datasets                               been made (e.g., using fuzzy logic or Bayesian networks), but
brings forth a number of challenges related to variability                               existing solutions are not readily accessible as they rely on
in both data quality (e.g., taxonomic misidentifications,                                proprietary software available only through expensive paywalls
measurement/recording errors, differences in field protocols)                            (e.g., the RAMAS Red List Pro package) (Akçakaya et al., 2000;
and quantity (e.g., spatio-temporal bias in sampling effort,                             Newton, 2010).
different data storing/sharing/access policies) (Akçakaya et al.,                            Here, we rely on a simple kernel-based weighted resampling
2000; Guttmacher, 2016; Rueda-Cediel et al., 2018; Fletcher                              approach that treats the veracity of sightings probabilistically,
et al., 2019). While this uncertainty is inherently acknowledged                         allowing a straightforward assessment of uncertainty. Our
in IUCN nomenclature (e.g., criterion A1 specifies population                            analyses build on what is, to our knowledge, the most
reductions as being “observed, estimated, projected, inferred,                           comprehensive repository of geo-referenced snubfin sightings
or suspected”) (IUCN Standards and Petitions Committee,                                  for the Kimberley. These were obtained from dedicated surveys
2019), it is seldom addressed in practice, with most assessments                         carried out in partnership with the Indigenous Rangers associated

Frontiers in Marine Science | www.frontiersin.org                                    4                                           January 2021 | Volume 7 | Article 614852
Bouchet et al. Conservation Status of Snubfin Dolphins
with the Yawuru, Dambimangari, Wunambal Gaambera, Bardi in Table 1), (b) four 20-day offshore biodiversity surveys
Jawi, and Balanggarra Native Title groups, as well as from a conducted under contract with industry (OH-003) in the waters
range of additional sources such as citizen science initiatives, of the Bonaparte Archipelago and Browse Basin (Jenner et al.,
government archives, and the peer-reviewed literature, among 2014); (c) 46 daily surveys of Roebuck Bay run along pre-
others. Our study provides an example of how to successfully determined transect lines (OH-004) (Thiele, 2010); (d) 36
incorporate disparate datasets to conduct RLs of elusive cetaceans collaborative surveys undertaken by coastal Indigenous Ranger
in isolated seascapes. groups (Nyamba Buru Yawuru, Dambimangari, Balanggarra, and
Uunguu) on their respective Sea Countries [OH-005005; see
https://bit.ly/snubfin230dolphins-Yawuru for an example (last
MATERIALS AND METHODS accessed November 2020)], in addition to a 3-day intensive
census of snubfins in the Yawuru Nagulagan/Roebuck Bay Marine
Study Area Park (Raudino et al., 2019) (Figure 2 and Supplementary
The study area extends for approximately 7,000 km along the Figure S2); (e) extensive dedicated genetic sampling and photo-
northern coast of Western Australia between Roebuck Bay identification surveys (OH-006) targeting important shallow-
(122.21◦ E, 18.17◦ S) and the Northern Territory border (129◦ E) water sites along the Kimberley coast, including Beagle Bay,
(Figure 1). The inshore environment of the Kimberley is a Roebuck Bay, Cygnet Bay, Cone Bay, and the Inner Cambridge
complex matrix of convoluted narrow embayments, drowned Gulf (Brown et al., 2014b, 2016); (f) 14 surveys completed
valleys, rocky outcrops, and coral-fringed headlands or islands in the northern part of Roebuck Bay in July 2014 (OH-007)
subject to monsoonal climate cycles (Wilson, 2014). Coastal concurrently to the deployment of an acoustic logger used
waters are characterized by high levels of turbidity and some of for soundscape monitoring (Brown et al., 2017); (h) an array
the most extreme tidal ranges in the world, in excess of 10 m of opportunistic detections reported by biologists and other
in some areas (Wood and Mills, 2008). An array of habitats can experienced marine professionals from partner institutions (OH-
be found throughout the region, including mangroves, seagrass 008 to OH-012) during miscellaneous research and non-research
meadows, mudflats, and extensive reef systems. These provide activities, some of which have been published in the peer-
foraging, resting, and breeding grounds for a large diversity of reviewed literature (e.g., Allen et al., 2012). Complete or partial
marine vertebrates, including cetaceans (Thums et al., 2018). GPS tracks were available for most primary datasets and were
Supplementary Figure S1 shows the locations of all marine used to characterize sampling effort (Supplementary Figure S3).
areas, stream outflows, river systems, and reefs/islands referred “Secondary” data included incidental sightings collected as
to throughout the main text. In Western Australia, coastal waters part of large-scale aerial surveys targeting dugong (Dugong
out to three nautical miles fall under the jurisdiction of the dugon) (OH-013), as well as records crowdsourced from
State Government, with Indigenous people having management open-access, online biodiversity portals (e.g., Atlas of Living
responsibility for their Sea Country where Native Title has been Australia), citizen science mobile applications (DolphinWatch,
determined (Rist et al., 2019). A network of marine parks has and Coastal Walkabout), government archives (NatureMap),
also been implemented across much of the State’s coastal fringe and anecdotal community reports from members of the public
(Supplementary Figure S2), with co-management agreements (e.g., recreational ocean users, wildlife tour operators, etc.; OH-
in place between the State Government and Indigenous people 014–OH-019, Table 1). With the exception of aerial surveys
in some cases (e.g., the Uunguu Indigenous Protected Area also (Supplementary Figure S3), sampling effort for secondary
encompasses coastal waters). Both marine park and Healthy datasets was unknown (Table 1).
Country management plans identify marine values within their Note that we only considered visual detections, although
respective areas and include objectives and targets for their interest in developing long-term acoustic monitoring programs
long-term management (Balanggarra Aboriginal Corporation, for the species is rising (Brown et al., 2017; Marley et al., 2017;
2011; Bardi and Jawi Niimidiman Aboriginal Corporation, de Freitas et al., 2018).
2013). Snubfins are recognized as an ecologically important
and culturally significant marine species by State and Healthy Survey Methods
Country managers across their range. A full description of field procedures for individual surveys is
given elsewhere (e.g., Brown et al., 2016; Bayliss and Hutton,
Dolphin Data 2017) and these are only briefly summarized here. On-water
Data Sources surveys were conducted aboard a range of visual platforms,
Sightings of snubfins were collated from a variety of published including catamarans, fishing vessels, small-sized rigid inflatables
and unpublished sources and split into two categories reflecting (i.e., zodiacs), research powerboats, and charter yachts (Table 1).
observers’ perceived level of expertise (Table 1). “Primary” All surveys adhered to well-established methodology (Smith
sightings consisted of reports made by highly trained personnel and Reeves, 2000; Dawson et al., 2008) with 2–5 experienced
(including Kimberley Indigenous Rangers and/or professional observers maintaining constant watch 180◦ ahead of the platform
marine mammal scientists), and included data from: (a) two from the bow, side, and upper bridges (on larger vessels). Visual
14-day surveys (led by DT) undertaken between Darwin and searches took place during daylight hours, when the boats were
Broome to describe the presence of snubfins in nearshore motoring or sailing and both weather and visibility conditions
tidal river environments (datasets ID OH-001 and OH-002 were deemed suitable, i.e., Beaufort sea state ≤ 3 (Barlow, 2015).
Frontiers in Marine Science | www.frontiersin.org 5 January 2021 | Volume 7 | Article 614852Bouchet et al. Conservation Status of Snubfin Dolphins
FIGURE 2 | Collaborative snubfin dolphin research on Kimberley Sea Countries. (A) Australian snubfin dolphins (Orcaella heinsohni) are small-sized coastal
cetaceans endemic to Northern Australia and Papua New Guinea. Adults can grow up to 2.7 m in length, and have a characteristically rounded head with no beak or
rostrum. Most dolphins occur in small pods of 2–5 animals, though larger groups have occasionally been observed. Photo: Deborah Thiele. (B) Good quality
photographs enable the reliable identification of snubfin dolphins during wildlife surveys and can facilitate the estimation of population abundance using
mark-recapture methods. Photo: Phil Bouchet. (C–E) Ranger-led surveys such as those on Dambimangari, Yawuru, and Balanggarra Sea Countries are critical for
supporting ongoing population monitoring throughout the remote Kimberley region. Photos: Ellen D’Cruz and Alex Brown. (F) Training workshops combine
theoretical learning and practical activities to build capacity among Traditional Owners in the collection of scientific data on coastal marine wildlife. Photo: Tanya
Vernes/WWF-Australia.
During systematic surveys, the locations of all dolphin sightings 1986), though not always differentiated with absolute certainty.
were marked using GPS. Animals were approached at close range Confidence in taxonomic identification typically varies with
whenever possible in order to confirm estimates of group sizes survey conditions (e.g., Beaufort sea state, glare, water clarity),
and photograph individual dolphins to support the development as well as by observer (e.g., individual experience, eyesight,
of a regional photo-identification catalog1 . fatigue levels, and viewing angle from the airplane), and by
Aerial surveys were flown aboard a fixed-wing GA8 Airvan in species (e.g., group size, morphological traits, diving behavior)
September–October 2015 and May 2017, traveling at 100 knots (Dunshea et al., 2020). Bayliss and Freeland (1989) claimed
ground speed and 500 ft, an altitude at which small-bodied that after several flights, most observers had little difficulty in
marine mammal species can be confidently detected (Bayliss, telling snubfins apart from other species under favorable viewing
conditions. However, other studies reported up to 5–11% of
1
https://dolfin.dbca.wa.gov.au/ uncertain sightings/disagreements between observers (Hodgson
Frontiers in Marine Science | www.frontiersin.org 6 January 2021 | Volume 7 | Article 614852Bouchet et al. Conservation Status of Snubfin Dolphins
et al., 2013; Dunshea et al., 2020) (see section “Taxonomic and and OH-014, Table 1) included a measure of certainty in
geographic errors” for the treatment of taxonomic uncertainty). species identifications, which we relied on to filter out any
Surveys followed the procedures outlined in Sobtzick et al. (2013) “guesses,” retaining only those detections labeled as “certain,”
and Bayliss and Hutton (2017). A team of tandem observers “relatively certain,” and “probable.” Sightings from the Atlas of
recorded their sightings with at least one experienced observer Living Australia (ALA) and the Global Biodiversity Information
on each side of the aircraft. Surveys encompassed coastal waters Facility (GBIF) (OH-018) are subjected to extensive quality
out to the 20 m bathymetric contour between Broome and the tests, and only those that passed taxonomic checks were
Northern Territory border, and were completed in collaboration considered. In the absence of relevant taxonomic information,
with Indigenous Rangers following a 5-day intensive training all other records were assumed to have been correctly assigned
course at Gambimerri Ranger station on Wunambal Gaambera to Orcaella heinsohni. Any on-land observations were also
Country (Bayliss and Wilcox, 2015). randomly reassigned to the nearest ocean area within a
1 km-wide buffer surrounding each point. This allowed us
Data Processing and Treatment to discard a small number of clearly erroneous sightings
All analyses were undertaken in R v4.0.0. The underlying code is (i.e., located several tens to hundreds of km inland), whilst
freely available at https://github.com/pjbouchet/orcaella_eoo. providing a reasonable approximation of the possible distribution
Data integration is increasingly commonplace in ecological of dolphins when the only sighting coordinates available
research (Isaac et al., 2020), yet efforts to synthesize vast amounts were those of land-based vantage points (e.g., Broome Bird
of heterogeneous information often lead to the assimilation of Observatory, Supplementary Figure S4). Both true and likely
data burdened with different evidentiary standards (Domisch duplicate records were identified within and across datasets
et al., 2016; Fletcher et al., 2019). Typically, structured datasets and excluded from the analysis. True duplicates stemmed
obtained during surveys that follow explicit sampling designs mostly from the fact that online data infrastructures such
are deemed of high quality but remain in short supply, whereas as ALA or GBIF often harvest information from common
unstructured data collected without strict protocols are growing source providers (including each other), and were defined
plentiful but may be ambiguous and subject to important as sightings with identical Julian dates, group sizes, and
biases (Isaac and Pocock, 2015). Conservation decisions can be geographic coordinates (i.e., latitude and longitude) — these
highly sensitive to these biases and the potential errors caused were manually discarded. Likely duplicates were taken as
by falsely choosing to reject valid observations or accepting sightings made within 100 m of each other on the same
anomalous ones (McKelvey et al., 2008), yet many equivocal (but date (e.g., repeat observations of the same dolphin group by
unverifiable) reports are made by experienced amateur naturalists different citizen scientists). These were spatially thinned using a
or well-intentioned members of the public whose contributions randomized algorithm, as implemented in the R package spThin
are difficult to justify excluding (Lee et al., 2014; Brook et al., (Aiello-Lammens et al., 2015).
2019). The careful treatment of occurrence records is therefore
crucial in geographic range assessments of little-studied, rare, and Inclusion Probabilities
elusive taxa from mixed-certainty datasets (Roberts et al., 2010). Recently, several studies have proposed ways of incorporating
We adopted a two-pronged approach to data processing, focusing sighting veracity into ecological inference, either by applying
firstly on quality control and the correction of a range of common scoring systems developed through expert elicitation (Jarić
errors (Soberón and Peterson, 2004; Robertson et al., 2016; Zizka and Roberts, 2014; Lee et al., 2014, 2015), or via Bayesian
et al., 2019; Jin and Yang, 2020), and secondly on the calculation frameworks (Solow et al., 2012; Solow and Beet, 2014).
of plausibility (inclusion) scores, which can be interpreted as the The idea of allocating inclusion probabilities to individual
probability that each sighting is a true record of the species. The sightings is appealing as it relaxes the conventional ‘accept-
latter step was essential given that snubfins are cryptic and can be or-reject’ paradigm of data processing and allows every data
easily mistaken for other visually similar and sympatric species point to be fully considered and used, thereby maximizing
(e.g., dugong), especially when detected momentarily from a its analytical value (Brook et al., 2019). However, Bayesian
distance (Bayliss, 1986; Dunshea et al., 2020), and permitted the models can be mathematically and computationally intensive,
probabilistic inclusion of all data points, including potentially may require prior information that is often missing for data-
controversial sightings (Jarić and Roberts, 2014). deficient species, and can be challenging to benchmark against
other methods (Saltré et al., 2015). Likewise, expert judgments
Taxonomic and Geographic Errors are necessarily subjective and unlikely to be thoroughly
Primary sightings, most of which were supported by high- reproducible (i.e., they are prone to vary depending on
quality digital photographs of the animals (Figures 2A,B), were personal beliefs and experiences, as well as the way in which
considered unambiguous and treated as geographically and information is elicited), ultimately limiting their applicability
taxonomically accurate. In contrast, secondary records were (Martin et al., 2012).
likely prone to greater inconsistencies owing to differences in A simpler alternative is to assess ambiguous sightings in
the competence, commitment, and capacity of observers (e.g., terms of their similarity to locations where the species has
eyesight, access to vessels), in addition to the wide range of been documented to occur, for example by down-weighting (or
surveying conditions associated with each data source (Dickinson filtering) records associated with environmental conditions that
et al., 2010). Two of the seven secondary datasets (OH-013 deviate from those encountered in verified datasets collected by
Frontiers in Marine Science | www.frontiersin.org 7 January 2021 | Volume 7 | Article 614852Bouchet et al. Conservation Status of Snubfin Dolphins
professionals (Allouche et al., 2008; Lin et al., 2017; Fletcher implemented in package ks (Duong, 2007). The hpi estimator
et al., 2019; Robinson et al., 2020). We did this for snubfins is gaining traction in aquatic research as it has been found
using an adaptation of the 2D smoothing protocol described by to outperform other algorithms and to avoid issues related to
Tarjan and Tinker (2016). Specifically, we fitted bivariate kernel convergence failures, skewness, as well as over- and under-
density functions to primary sightings within the landscape space smoothing (e.g., Schofield et al., 2013; Jones et al., 2015; Graham
defined by both (i) seabed depth and (ii) proximity to the nearest et al., 2016; Nifong and Silliman, 2017). Where necessary, h values
freshwater outflow using the bkde2D function in the KernSmooth were adjusted by visual inspection of the results to ensure that
package (Wand, 2015). These variables were chosen as the output kernels were in accordance with our prior knowledge
most commonly reported putative drivers of snubfin occurrence about dolphins’ environmental preferences (Sprogis et al., 2016;
throughout their range (Parra et al., 2002, 2006b, 2017; Parra, Doherty et al., 2017). To account for sampling effort, we divided
2006; Cagnazzi et al., 2013b), and the resulting density surface the dolphin kernel by the density surface obtained after applying
can thus be thought of as mapping the relative intensity of species the same procedure to a set of points placed at regular 10 km
presence along two key dimensions of its niche. Depth values intervals along survey track lines (N = 3,389, Supplementary
were extracted from a high-resolution (30 m) bathymetric grid Figure S3; Pennay et al., 2011; Derville et al., 2016). Following
of the Kimberley curated by Geoscience Australia2 . Freshwater the above approach, we set h to 1 m on the y-axis (depth) and
outflows were identified as all perennial streams (major and 1.5 km on the x-axis (distance to freshwater outflows) for dolphin
minor) registered in the Australian Bureau of Meteorology’s sightings, and 15 m and 25 km for effort points, respectively.
Hydrological Geospatial Fabric spatial database V2.1.13 , which Inclusion probabilities for secondary sightings were taken as the
intersected a 1 km buffer around the shore (as marked from the values of the final, standardized kernel (rescaled to 0–1, Brook
Global, Self-consistent, Hierarchical, High-resolution Geography et al., 2019) at the coordinates of each point in landscape space.
Database v2.3.74 ). To account for the complexity of the Kimberley All primary sightings were given an inclusion probability of 1
coastline, geodesic distances to freshwater outflows (i.e., shortest (Figure 3). We also calculated 25 and 90 percent volume contours
‘least-cost’ trajectories by water, taking into account the presence (PVCs) from the fitted kernel surface. PVCs are slices through the
of intervening land such as islands or capes) (Parra et al., 2006b) three-dimensional kernel which contain a given percentage of the
were calculated using bespoke code modified from functions volume under the fitted surface (e.g., the 90 PVC encloses 90% of
available in the movecost R package (Alberti, 2019). Kernel the volume beneath the kernel) (Tancell et al., 2012). Doing so
density estimators are known to be sensitive to the choice of allowed us to delineate regions encompassing the densest 25 and
smoothing parameter (i.e., the bandwidth, h), yet selecting an 90% of observations (after back-transformation to geographic
appropriate bandwidth is notoriously challenging, with currently space), which we interpreted as being indicative of the species’
no consensus on how to do so consistently (Gitzen et al., 2006). core areas and full range, respectively (Sveegaard et al., 2011).
Here, we elected to use the hpi (‘plug-in’) estimation method
2
http://www.ausseabed.gov.au/surveys-data/data Conservation Assessment
3
http://www.bom.gov.au/water/geofabric/ The IUCN relies on two key metrics to assess the conservation
4
https://www.soest.hawaii.edu/pwessel/gshhg/ status of wildlife species under criterion B: the EOO and the
FIGURE 3 | Inclusion probabilities for snubfin dolphin (Orcaella heinsohni) sightings derived from secondary sources. (A) Bivariate kernel probability density surface,
defined in landscape space along the axes of water depth (in m) and least-cost distance to the nearest freshwater outflow (in km). The surface was calculated from
primary sightings collected by trained marine mammal personnel. (B) Summary of the range of inclusion probability values for each secondary data source. Boxplot
widths are proportional to sample sizes in each group. Dataset IDs and attributes are listed in Table 1.
Frontiers in Marine Science | www.frontiersin.org 8 January 2021 | Volume 7 | Article 614852Bouchet et al. Conservation Status of Snubfin Dolphins AOO (IUCN Standards and Petitions Committee, 2019). The approach, whereby each data point is weighted in proportion to EOO (criterion B1) is defined as the area contained within the its reliability. In practice, we performed the analyses iteratively outermost boundaries of all known, projected, or inferred records on n = 1,000 replicate datasets created by resampling (i) of a species, excluding cases of vagrancy. The AOO (criterion primary sightings with replacement, and (ii) secondary sightings B2) refers to the sub-area occupied by the species within the without replacement, but with weights equal to their inclusion larger EOO. Both indices are highly relevant to the estimation probability. We then calculated summary statistics, including of extinction risk, as population resilience to catastrophic events means and 95% percentile confidence intervals. may be impaired if either is small or decreasing (Keith et al., In addition to the EOO/AOO, the focal taxon must fulfill at 2017). The EOO can be calculated in a number of ways (see least two of the three criteria listed under criterion B, namely Gaston and Fuller, 2009), yet this is routinely done by drawing a that: (a) populations are severely fragmented or known to exist minimum convex polygon (MCP) around occurrence points, i.e., in no more than a few locations, (b) a continuing decline has the smallest polygon encompassing species records and in which been observed, estimated, inferred, or projected in either the no internal angle is greater than 180◦ . Despite known caveats EOO, AOO, extent and/or quality of habitat, number of locations (Burgman and Fox, 2003; Borger et al., 2006), IUCN guidelines or subpopulations, or number of mature individuals, or (c) strongly encourage the use of the MCP for RLs conducted against extreme fluctuations in the above are apparent (IUCN Standards criterion B (IUCN Standards and Petitions Committee, 2019), and Petitions Committee, 2019). Recent photo-identification largely for pragmatic reasons related to conceptual simplicity and and molecular evidence indicates that snubfins form resident, the need to estimate EOO consistently across taxa (Joppa et al., genetically isolated populations with low migration rates, limited 2016). Alternative methods include the α-hull, which is preferred gene flow (Brown et al., 2014b), and potentially high site fidelity when investigating temporal trends in the EOO, particularly in (Parra et al., 2006a). Although there is presently no range-wide the context of suspected population declines (see Supplementary abundance estimate for snubfins and only scant information on Appendix 1). Likewise, multiple techniques have been proposed population trends (Parra et al., 2017), no subpopulation studied for measuring the AOO, the most common of which entails to date exceeds 250 mature individuals (Parra et al., 2006a; superimposing a regular grid over the EOO and summing the Cagnazzi et al., 2013b; Palmer et al., 2014a; Brown et al., 2016, area of those cells occupied by the species. The AOO is highly 2017). Recent projections of the Kimberley marine system to the scale-dependent (Hartley and Kunin, 2003; Willis et al., 2003), yet year 2050 suggest that snubfins are likely to undergo consistent a resolution of 4 km2 (i.e., 2 × 2 km cells) is deemed appropriate declines in population size as a result of climate warming in most cases, as it ensures that AOO estimates are commensurate and other pressures (Boschetti et al., 2020), and it is expected with the implicit scale of the thresholds used for delineating that future changes in abundance will be sufficiently large and categories of threat (i.e., coarser scales preclude listings as pervasive to cause a net reduction for the entire species of at least critically endangered, whilst finer scales may list more taxa at 20% over a period of two generations (Parra et al., 2017). For these higher threat categories than the definitions of these categories reasons, we assumed that both criteria (a) and (b) were met. inherently imply) (Hartley and Kunin, 2003; Willis et al., 2003; Callmander et al., 2007). The AOO can also vary depending on the location of the grid origin (Breiner and Bergamini, RESULTS 2018), however, this issue can be alleviated by iteratively testing different grid positions and choosing the one that minimizes the We obtained 3,099 occurrence records of snubfins throughout number of occupied cells (Moat et al., 2018). Several R packages the Kimberley. After data cleaning and filtering, our final data exist for performing RLs, including Redlistr (Lee et al., 2019), comprised 1,207 primary and 390 secondary sightings (total red (Cardoso, 2017), and ConR (Dauby et al., 2017), all with N = 1,597) spanning the period 2004–2020 (Table 1). Primary largely similar functionalities. Here, we used ConR to quantify sightings were collected along 34,865 km of vessel-based survey the EOO and the AOO for snubfins across the Kimberley. As tracklines crossing seven Sea Countries and encompassing a per Cagnazzi et al. (2013b), both metrics were computed based diverse range of habitat types, from mangroves to mud/sand on the positions of snubfin groups rather than individuals. We flats, reefs, and seagrass meadows. Sampling effort covered a kept the package defaults, which align with IUCN guidelines total depth range of 902 m (median ± SD = 11.5 ± 80.2 m), and treat the EOO as an MCP, computing the AOO at 4 km2 both in proximity to, and away from, freshwater outflows resolution (IUCN Standards and Petitions Committee, 2019). (median ± SD = 9.7 ± 64.3 km) (Supplementary Figure S3). For comparative purposes, we also ran a complementary analysis Consistent with previous findings (e.g., Parra et al., 2006b), the where the EOO was calculated as an α-hull (see Supplementary majority of visual detections were made in shallow, nearshore Appendix 1). We set the nbe.rep.rast.AOO argument to 50, waters less than 21.3 m deep [i.e., N = 1,526 detections so that 50 raster translations with random starting points within the 95% highest density interval (HDI) of the associated would be generated during AOO calculations (Dauby et al., univariate kernel distribution] and no more than 15.4 km 2017). Importantly, failure to explicitly consider variance in from the nearest freshwater outflow (N = 1,533 within the IUCN metrics may lead to incorrect range assessments and 95% HDI) (Supplementary Figure S5). This pattern held true inconsistent threat evaluations (Akçakaya et al., 2000; Currey even after correcting for sampling effort (Figure 3). A small et al., 2009). Following Brook et al. (2019), we quantified number of primary sightings (N = 11), however, also occurred uncertainty in both the EOO and AOO using a resampling in deeper waters (up to 39 m) far from any source of freshwater Frontiers in Marine Science | www.frontiersin.org 9 January 2021 | Volume 7 | Article 614852
Bouchet et al.                                                                                                                 Conservation Status of Snubfin Dolphins

  FIGURE 4 | Distributions of regional geographic range estimates obtained by weighted resampling for snubfin dolphins (Orcaella heinsohni) in the Kimberley.
  (A) Extent of occurrence (EOO) calculated as the area of a minimum convex polygon encompassing all occurrence points. (B) Area of occupancy (AOO), measured
  as the number of 2 × 2 km grid cells occupied by dolphins. Both metrics are expressed in km. A smooth kernel density line is overlaid to facilitate interpretation.
  Medians and 95% percentile confidence intervals are shown in black as filled circles and segments, respectively.

(up to 63.8 km). Most dolphins occurred in groups of five                              and 13 in Parsons et al., 2015). Our results indicate that snubfins
or less (mean ± SD = 4.4 ± 6.2). The mean inclusion                                    may be regionally listed as VU B2(a,b), consistent with the threat
probability (i.e., weights) for secondary sightings was 0.49 (± 0.25                   category currently assigned to the species globally (Parra et al.,
SD), with some marginal variation apparent between datasets                            2017). Given that much of the species’ range across the Kimberley
(Figure 3). Roebuck Bay (Yawuru Sea Country), Cygnet Bay                               lies within jointly managed marine parks or areas managed as
(Bardi Jawi Sea Country), King Sound (Mayala, Bardi Jawi,                              Indigenous Protected Areas, this listing highlights the priority
Bindunbur Sea Countries), Doubtful Bay (Dambimangari Sea                               need for ongoing monitoring by both the State Government
Country), Prince Regent River (and surrounding embayments,                             and Traditional Owners. Importantly, our study also confirms
Dambimangari Sea Country), the seaward end of Napier Broome                            snubfins’ strong (though not exclusive) preferences for shallow
Bay (Wunambal Gaambera Sea Country) and the upper parts of                             (
Bouchet et al.                                                                                                         Conservation Status of Snubfin Dolphins

recreational fishing remains a popular activity, and although                while fine grains demand levels of sampling coverage that
no incidental entanglements of snubfins have been documented                 are typically incompatible with most field budgets (Joseph
to date (Gaughan and Santoro, 2020; Tulloch et al., 2020),                   and Possingham, 2008). Ideally, cell sizes would be selected
the limited availability of observer programs, combined                      according to biological relevance, e.g., to match the size of
with ineffective mitigation technologies (Soto et al., 2013)                 individual home ranges in mobile taxa (Gaston, 1991; Keith
and an absence of records of bycaught animals suggest                        et al., 2000). Recent studies suggest that the accuracy of AOO
that under-reporting is likely. Additionally to fishing, the                 as an indicator of extinction risk may be maximized when grid
Kimberley also boasts a rapidly growing nature-based tourism                 cells are between 0.1 and 1 times the largest area plausibly
industry (Strickland-Munro et al., 2016), produces a large                   impacted by a pressure event (Keith et al., 2017). Under this
proportion of the country’s offshore/onshore hydrocarbons                    definition, the optimal resolution for grid-based AOO may
(Moore et al., 2016), and is affected by heatwaves and other                 be more closely related to the spatial scale and intensity of
climatic extremes that are growing in frequency and intensity                threats faced by organisms than to their ecology (Keith et al.,
(Le Nohaïc et al., 2017).                                                    2017). Regardless, both ideas pose challenges for data-deficient
    These diverse and spatio-temporally varying pressures are                species like snubfins, for which limited quantitative estimates of
likely to have strong impacts on coastal dolphin populations                 habitat use, home ranges or threats currently exist. We note,
(Wild et al., 2019), especially those following independent                  however, that a number of efforts are underway to map human
evolutionary trajectories (Crain et al., 2009; Wallace et al., 2010).        activities across northern Australian seascapes5 . Such knowledge
As such, genetically isolated populations of snubfins may be                 is crucial to performing spatial risk assessments and will be key
unable to sustain even limited levels of anthropogenic mortality             to identifying the proximate factors underlying extinction risk
(Meager and Sumpton, 2016). Recent model simulations for                     for the species.
Kimberley marine ecosystems indicate that snubfins will also be                  Criterion B is also the most commonly misused IUCN
negatively impacted by future environmental and development                  criterion (IUCN Standards and Petitions Committee, 2019).
pressures (Boschetti et al., 2020), making regional RLs paramount            Given the aforementioned issues, it is paramount that the
for establishing monitoring baselines for the species going                  precision of EOO/AOO estimates should be considered and
forward (Brown et al., 2014b, 2016, 2017).                                   reported in RLs (Akçakaya et al., 2000; Knapp et al., 2003;
    The applicability of IUCN criteria at sub-global level has               Wilson et al., 2011; Fourcade et al., 2013; Connors et al., 2014;
received mounting scrutiny in recent years (e.g., Milner-Gulland             Rueda-Cediel et al., 2018). Uncertainty accumulates over the
et al., 2006; Brito et al., 2010; Maes et al., 2012) in light                assessment process, meaning that the way in which it is handled
of disagreements between conservation assessments performed                  can profoundly influence classifications of risk (Gillespie et al.,
at different scales (Mounce et al., 2018). We are aware of                   2011) and may ultimately affect management decisions (Regan
only one other example of a regional RL being conducted                      et al., 2002; D’Eon-Eggertson et al., 2015). This is especially
for snubfins, which indicated a lower level of threat across                 pertinent to RLs undertaken from mixed datasets with potentially
the Northern Territory (Palmer et al., 2017). However, both                  ambiguous sightings, whereby multiple uncertainties are likely
the EOO and AOO can be calculated in multiple ways,                          to be confounded and cannot necessarily be easily disentangled.
including via cartographic (i.e., grid-based) and areographic                When this is the case, one of the simplest ways to represent
(i.e., buffer-based) methods, as well as their individual variants           uncertainty is to specify a best estimate and a range of plausible
(Breiner and Bergamini, 2018) and combinations (Hernández                    values, as advocated in the Red List guidelines (IUCN Standards
and Navarro, 2007). Different methods will often yield disparate             and Petitions Committee, 2019). Great strides have been made
estimates of threat (Gaston and Fuller, 2009), an issue which is             toward developing strategies for incorporating uncertainty into
exacerbated by the continuing emergence of alternative metrics               RLs (Akçakaya et al., 2000; Knapp et al., 2003; Currey et al.,
(e.g., Area of Habitat, AOH; Ocampo-Peñuela et al., 2016; Brooks             2009; Newton, 2010), even though this is seldom apparent in
et al., 2019; Palacio et al., 2020), and by lingering confusion              the final IUCN listing itself. However, most of these methods
surrounding how the metrics recommended by the IUCN                          are either data-intensive (e.g., Currey et al., 2009), technically
should be implemented in practice (Breiner and Bergamini,                    advanced (e.g., Bayesian networks; Newton, 2010), or require
2018). Without a clear consensus on which approach is most                   proprietary software that is not freely available. In this study,
appropriate, comparisons of conservation status across areas are             we used an intuitive empirical approach to compute confidence
likely to be blurred by methodological decisions that remain                 bounds around EOO and AOO estimates, which is not predicated
largely subjective. For instance, ecologists have measured the               on any statistical assumptions and obviates the need for complex
AOO using grids constructed at a range of spatial resolutions                modeling machinery. The approach relies on the weighted
(Gaston and Fuller, 2009; Maes et al., 2012; Groom et al.,                   resampling of the sighting record, and can be easily implemented
2018), from fine (e.g., 1 × 1 km; Fordham et al., 2013) to very              in the free software package R (Brook et al., 2019) (see code
coarse (e.g., 100 × 100 km; Scott et al., 2012). Determining                 on Github at https://github.com/pjbouchet/orcaella_eoo). Rather
a suitable cell size is not trivial and has key implications                 than being arbitrarily discarded, ambiguous observations are
for characterizing the occupancy-abundance relationship that                 assigned lower weights (i.e., inclusion probabilities), thereby
underpins many conservation and monitoring programs (He                      ensuring that their contribution to the estimation is proportional
and Gaston, 2000; Steenweg et al., 2018). All else being equal,
coarse grains risk failing to detect local population declines,              5
                                                                                 https://bit.ly/nesp-a12-pressure-mapping

Frontiers in Marine Science | www.frontiersin.org                       11                                             January 2021 | Volume 7 | Article 614852
Bouchet et al. Conservation Status of Snubfin Dolphins
to their veracity. The assignment of inclusion probabilities can it is thus possible that other forms of interspecific interactions
be tailored to specific scenarios and need not be subjective if such as antagonistic encounters or resource competition with
benchmark datasets of high reliability are available, as was the sympatric species may dictate space use decisions by snubfins
case here. Specifically, we down-weighted snubfin records made to a greater extent than predation. This has been suggested
in deeper areas away from freshwater stream networks, as these in Queensland, where snubfins may avoid the aggressive and
represent conditions in which animals were rarely detected by sometimes dominant Australian humpback dolphin males
professional observers (Allouche et al., 2008; Lin et al., 2017; (Parra, 2006).
Fletcher et al., 2019) (Figure 3 and Supplementary Figure S5). Within Western Australia, snubfins have been recorded as
far south as the Pilbara and the North West Cape/Exmouth
Snubfin Distribution and Habitat Use Gulf (22.41◦ S) (Allen et al., 2012; Hanf, 2015). Such sightings
Shallow bathymetry and proximity to freshwater are remain uncommon, however, and it is unknown whether
defining features of the preferred habitats of many dolphin they reflect infrequent movements by vagrant individuals, the
species at cold-temperate latitudes, including Chilean presence of a remnant population residing in the area (Raudino
(Cephalorhynchus eutropia) (Viddi et al., 2016; Heinrich et al., 2018) and/or may signify the potential for a southward
et al., 2019), Commerson’s (Cephalorhynchus commersonii) distribution shift of the species with warming seas (MacLeod,
(Garaffo et al., 2011), Hector’s (Cephalorhynchus hectori), 2009). By contrast, our results confirm that the coastal fringe
Maui’s (Cephalorhynchus hectori maui) (Derville et al., 2016), of the Kimberley is a stronghold for snubfins, consistent
and bottlenose (Tursiops truncatus) dolphins (Mendes et al., with previous knowledge of dolphin occurrence throughout
2002). In the tropics, Guiana (Sotalia guianensis) (Rossi- the region (Supplementary Figure S6). Importantly, we found
Santos et al., 2010), snubfin, Irrawaddy (O. brevirostris), that the breadth of habitat space utilized by snubfins may be
Indo-Pacific humpback (Sousa chinensis), and Australian more limited than previously thought, as (1) our best AOO
humpback (S. sahulensis) dolphins are also commonly sighted estimate is relatively low (i.e.,You can also read