Literature Review: Upper Clutha Water Quality - Prepared for the Upper Clutha Lakes Trust
←
→
Page content transcription
If your browser does not render page correctly, please read the page content below
Literature Review:
                         Upper Clutha Water Quality
             Prepared for the Upper Clutha Lakes Trust

                                           August 2019

© Landpro Ltd 2019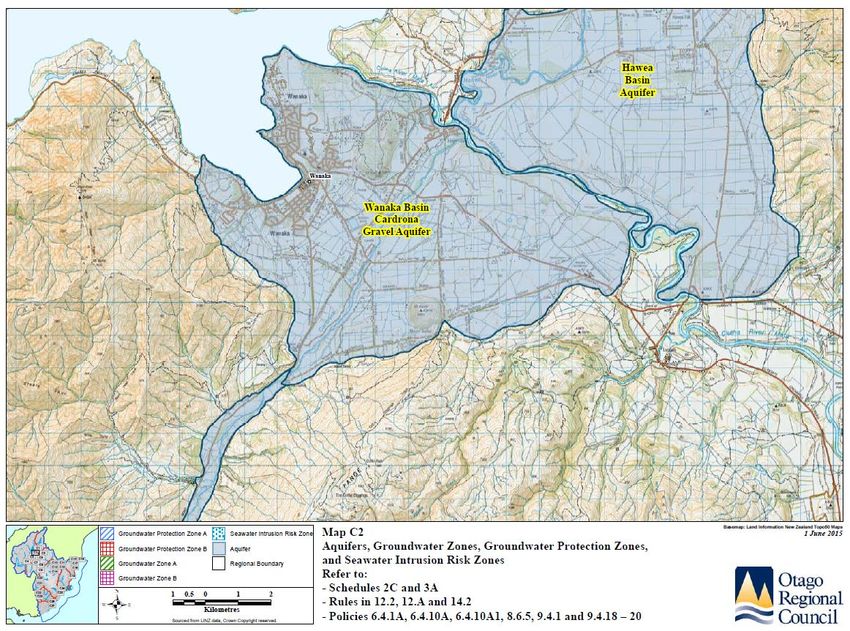
Prepared For
Upper Clutha Lakes Trust

Prepared By
Landpro Ltd
13 Pinot Noir Drive
PO Box 302
Cromwell

Tel +64 3 445 9905

© Landpro Ltd 2019

                           2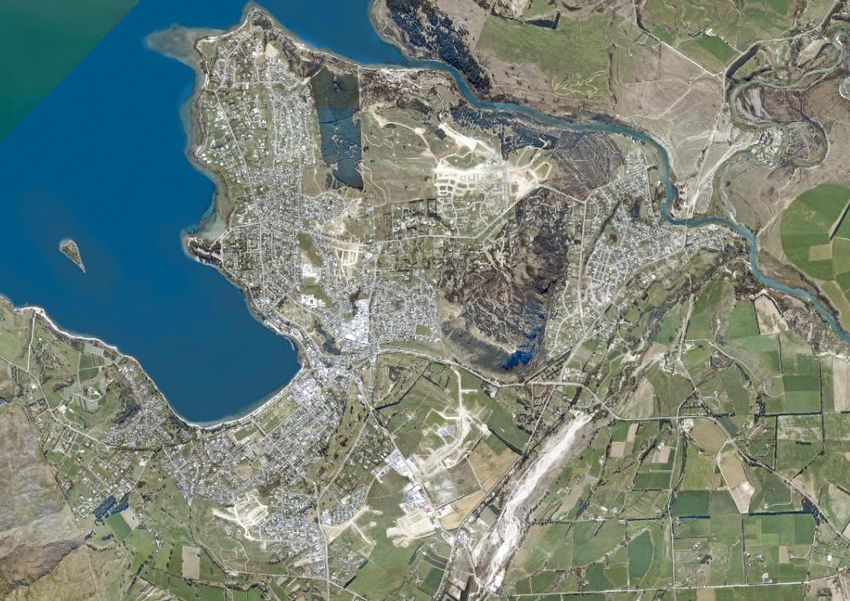
QUALITY INFORMATION

Reference:                   L:\18379 - Upper Clutha Lakes Trust - Upper Clutha Integrated Catchment
Management Plan\Docs\190627 Literature Review FINAL.docx

Date:                        11 August 2019

Prepared by:                 Tim Muller, Nick Boyens & Claire Perkins

Reviewed by:                 Kate Scott

Client Review:               UCLT

Version Number:              REVISED

Disclaimer:
We have prepared this report for our client based on their instructions. They may use it, as agreed between us. Landpro
has no duty, and does not make or give any express or implied representation or guarantee, whatsoever to any person
other than our client. If you are not our client then, unless this report has been provided to you as a local authority or
central government agency as part of a public process:
    •    you have no right to use or to rely on this report or any part of it, and
    •    you may not reproduce any of it.
We have done our best to ensure the information is fit for purpose at the date of preparation and meets the specific
needs of our client. Sometimes things change or new information comes to light. This can affect our recommendations
and findings.
                                                                                                                        3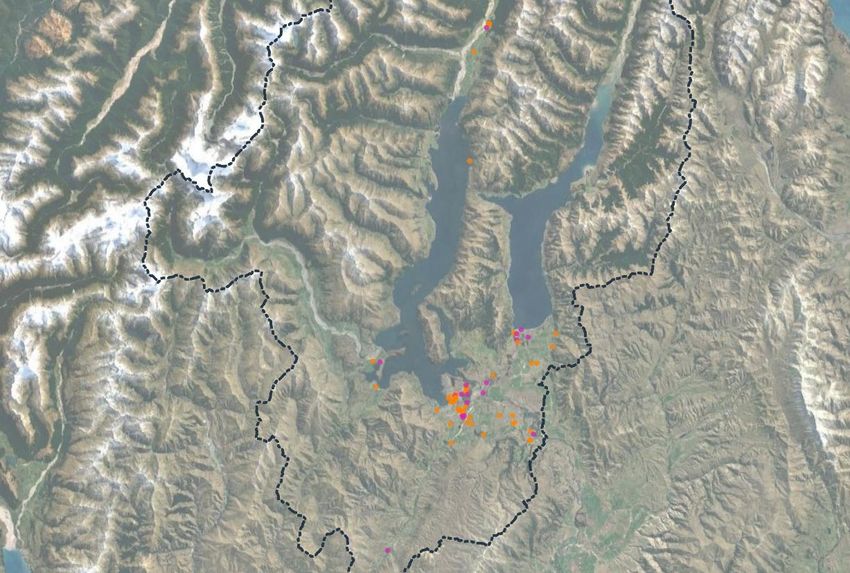
TABLE OF CONTENTS

     INTRODUCTION .................................................................................................................................................................. 6

     STATE OF THE ENVIRONMENT ..................................................................................................................................... 6

               Location ....................................................................................................................................................................... 6
               History .......................................................................................................................................................................... 7
               Climate ......................................................................................................................................................................... 9
               Topography and land use ...................................................................................................................................13
               Geology and soils...................................................................................................................................................18
               Hydrology and hydrogeology ...........................................................................................................................19
                    Clutha River/Mata-Au ......................................................................................................................................19
                    Hāwea catchment ..............................................................................................................................................20
                    Wānaka catchment ...........................................................................................................................................21
                    Clutha/Mata-au main stem and lower tributaries ................................................................................21
               Current water quality ............................................................................................................................................22
               Ecology .......................................................................................................................................................................34
               Freshwater values ...................................................................................................................................................36
                    Tangata whenua values ..................................................................................................................................36
                    Upper Clutha community values .................................................................................................................36
                    ORC Water Plan values ...................................................................................................................................39

     POLICY AND PLAN DIRECTION ..................................................................................................................................39

               Resource Management Act 1991 ....................................................................................................................39
               National Policy Statement for Freshwater Management .......................................................................40
               Regional Plan: Water for Otago .......................................................................................................................40
               Queenstown Lakes District Plan .......................................................................................................................42
               Other relevant guidance .....................................................................................................................................43
                    Lake Wānaka Preservation Act 1973 ..........................................................................................................43
                    Conservation Act 1987.....................................................................................................................................43
                    Catchment scale management examples .................................................................................................43

     RISKS TO CATCHMENT ..................................................................................................................................................44

               Pressure – State – Impact Framework ............................................................................................................44
               High Country in the Upper Catchment Above the Lakes .......................................................................45
                    Pressures ...............................................................................................................................................................45
                    Information Gaps and Monitoring Recommendations .........................................................................47
               Lake Wānaka and Lake Hāwea .........................................................................................................................47
                    Pressures ...............................................................................................................................................................50
                    Information Gaps and Monitoring Recommendations .........................................................................51
               Significant rivers not directly feeding the lakes (Cardrona River and Luggate Creek) ...............52
                    Pressures ...............................................................................................................................................................56
                    Information Gaps and Monitoring Recommendations .........................................................................57
               Wānaka/Hāwea Basin outwash plains including Clutha River/Mata-Au and the underlying
 aquifers ......................................................................................................................................................................................57
                    Pressures ...............................................................................................................................................................62
                    Information Gaps and Monitoring Recommendations .........................................................................64

                                                                                                                                                                                                4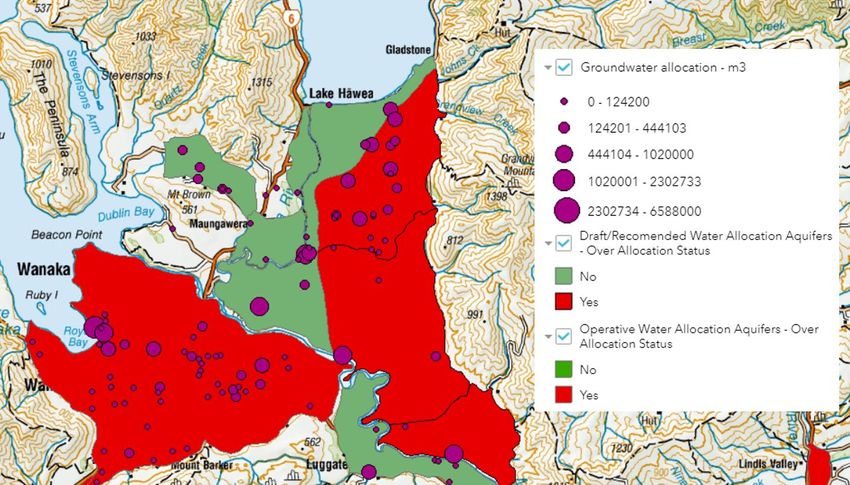
SUMMARY OF GAPS AND RECOMMENDATIONS ..............................................................................................65

        NEXT STEPS.........................................................................................................................................................................68

        REFERENCES .......................................................................................................................................................................68

        ACKNOWLEDGMENTS ...................................................................................................................................................71

APPENDIX 1: BIBLIOGRAPHY .................................................................................................................................................72

                                                                                                                                                                                           5
INTRODUCTION
Upper Clutha Lakes Trust (UCLT) is working with the community to prepare an Integrated Catchment
Management Plan (ICMP) for the Upper Clutha catchment. This plan will assist future sustainable
management of the Upper Clutha’s diverse catchments.
As part of the development of this ICMP there is a need to understand the background state of the
environment, risks and pressures the catchment is facing and subsequently gaps in background data
that currently exist.
Below follows a review of the available literature and reports as they relate to water in the Upper Clutha.
This report includes:
• A state of the environment summary covering location, history, climate, topography and land
use, geology and soils, hydrology, hydrogeology, water quality, ecology and freshwater values.
• High level policy and plan direction.
• Risks to the catchment addressed using a Pressure-State-Impact framework split into four sub-
catchments with similar characteristics:
− High country in the upper catchment above the main lakes;
− Lakes Wānaka and Hāwea;
− Other significant rivers not directly feeding the lakes (e.g. Cardrona River and Luggate
Creek);
− Wānaka Basin outwash plains including Clutha River, Hāwea River and the underlying
aquifers.
A wide range of literature was found during the search process. The most relevant literature is referred
to directly in the text and other literature of interest that is not directly referenced is included in an
appendix listing all found literature (Appendix A). Some of this literature has been collated by Dr Simone
Langhans as part of her freshwater management research project Saber-CULTURAL.
STATE OF THE ENVIRONMENT
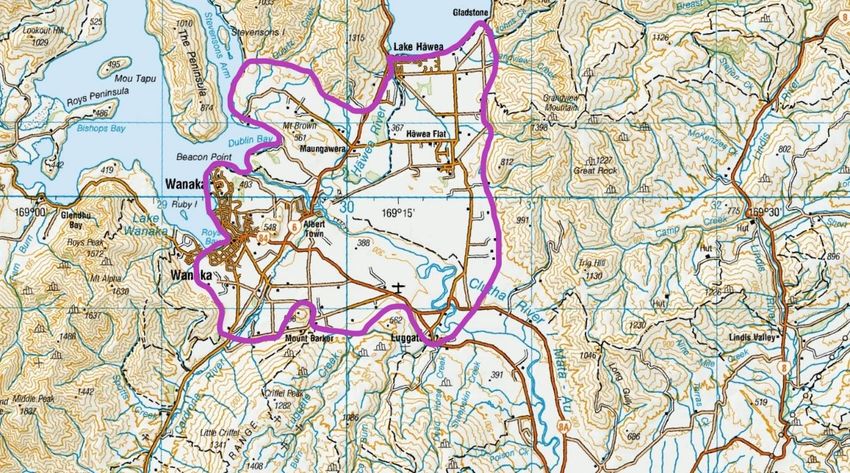
Location
The study area for this ICMP is the catchment of the Clutha River/Mata-Au from the confluence with
Luggate Creek at the downstream end to the mountains, including Lakes Wānaka and Hāwea and all
tributaries. The area is defined by the watershed of the Southern Alps in the north, various smaller
mountain ranges to the east and west, and the boundaries of the Cardrona River and Luggate Creek
catchments in the Crown and Pisa Ranges to the south.
The Upper Clutha is the northernmost part of Otago Region, within Queenstown Lakes District. The area
includes the towns of Wānaka and Hāwea, as well as various smaller communities such as Luggate and
Makarora.
6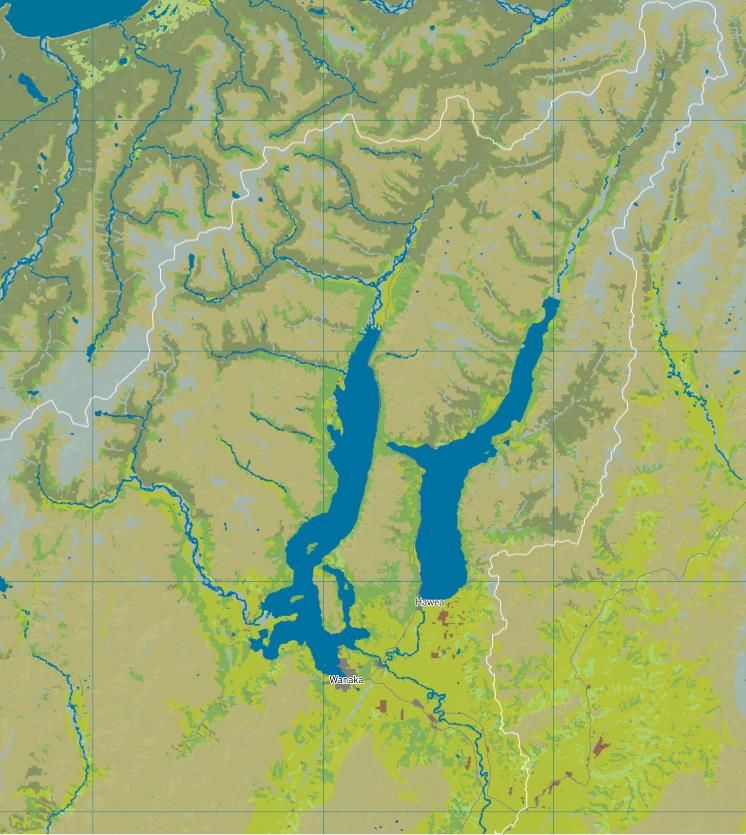
Figure 1: Upper Clutha catchment boundaries

      History
The schist rocks which dominate the geology of the Central Otago and Upper Clutha areas were
deposited around 250-130 million years ago (mya). Now known to geologists as the Rakaia Terrane, this
formation was initially laid down as sandstone and finer-grained sediments. The rocks were then buried
by subsequent sediments and subjected to increasing pressure and temperature. These were the
conditions under which metamorphosis into the rocks which define today’s landscape occurred, peaking
at around 160-180 mya at a depth of around 15 km. The gold which defined much of the early European
history of the area was deposited from hot water solutions in similar conditions over the last 140 million
years. (Reay, 2003).

Geological changes have also had a significant influence on waterways in the region, much of the
present Upper Clutha catchment once flowed south to the Kawarau via the Cardrona and Motatapu
valley, before uplift in and near the Crown range cut off this flow path (Craw and Norris, 2003).

More recently (in geological terms), the present valleys of the area were carved by glaciers, mostly over
the last 2 million years. There were various sequences of glacial and warmer periods, with the last glacial
maximum occurring around 15,000 years ago. Rock debris (till) carried by these glaciers was deposited
when they melted, and this material dams all of the large southern lakes. This process resulted in a

                                                                                                         7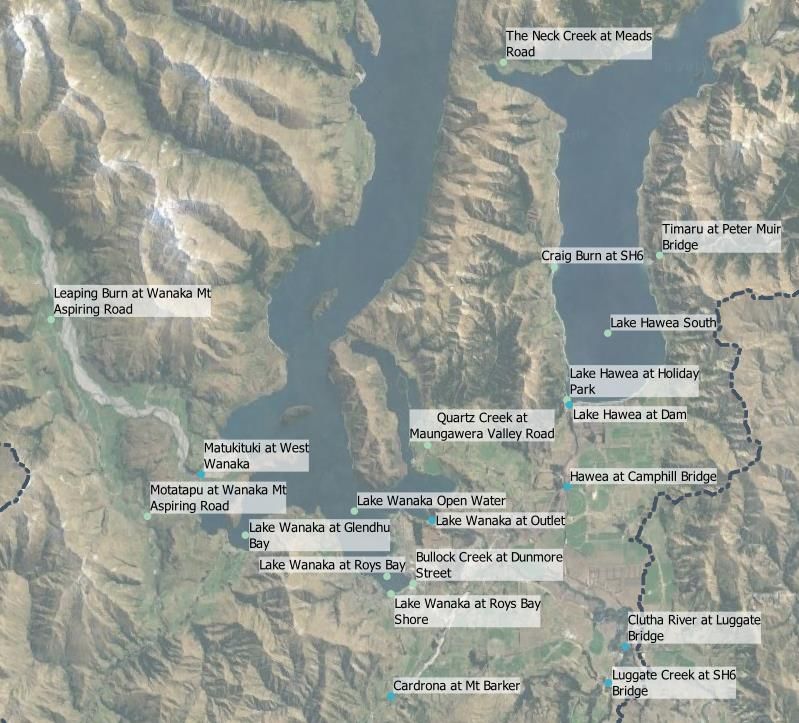
complex mixture of sorted alluvial deposits and mixed glacial materials in the plains in the southern part
of the Upper Clutha, most notably south of Hāwea (Wilson 2012, Craw and Norris, 2003).

In Māori tradition, both Lakes Hāwea and Wānaka were dug by the Waitaha explorer Rākaihautū with
his kō (Polynesian digging stick). Lake Hāwea was named after a member of his party (Hāwea Ki Te
Rangi), while Lake Wānaka’s name “associates it with lore of the tohuka” (Aukaha, 2019). “Wānaka” is
the southern dialect pronunciation of “wānanga”, which can refer to tribal knowledge, a wise person, or
an educational institution). There are also accounts of a whare kura (school) where children from coastal
and Central Otago went for cultural education (Anderson, 1983, cited in Aukaha 2019).

Māori settlement of New Zealand occurred in the early 2nd Millenium AD. There is potentially conflicting
information on the nature of Māori settlement in the Upper Clutha, with Higham et al (in Hewitt, 2017)
suggesting that the area was not permanently occupied but only visited on resource-gathering trips.
Conversely, Allingham (2000, in Hewitt, 2017) identified up to 6 pā sites in the area. Anderson (1982, in
Hewitt, 2017) notes that Māori settlements at Wānaka and Hāwea appear to have become permanent
in the early years of European settlement, enabled by potato agriculture, which may at least partially
explain this apparent discrepancy. Similarly, Hale (2019) describes both permanent settlement and
hunter-gatherer activity in the area. The Upper Clutha area was also the scene of battles in the 1700s
and 1800s, between Ngāi Tahu and Waitaha, and later between Ngāti Tama and Ngāi Tahu. (Anderson,
1982, in Hewitt, 2017)

Weka and eels were among the primary source of food in the area (Anderson, 1982, in Hewitt, 2017),
and Moa were also hunted, probably from early in the history of Māori settlement (Allingham, 2000, in
Hewitt, 2017). It was said that, at Makarora, “Counting the eels is like counting a swarm of sandflies”
(H.K. Taiaroa, quoted in Hewitt, 2013). In addition to the above, there were numerous bird, fish and
tree/plant species available, of which Hewitt (2018) has compiled a comprehensive list. Probably the
most marked impact of Māori settlement on the landscape was fire, with significant deforestation
occurring between the arrival of Māori and later European settlement (Wardle, 2001, McWethy et al,
2009, both in Hewitt, 2017).

European settlement of the Upper Clutha began in the 1850s, with Albert Town (then called Newcastle)
initially the largest settlement. Cardrona was also briefly a significant settlement during the gold rush
(c. 1863-1878). The town of Pembroke (later Wānaka) had its beginnings in 1867 with the construction
of a hotel there. According to Roxburgh (1990), farming was the dominant industry in the area for much
of its history, with sawmilling and flaxmilling also significant industries in the early years. Tourism has
also played a role in the area’s economy since the early days, and became more significant from the
1960s and 1970s onwards with the establishment of Mt Aspiring National Park, Cardrona and Treble
Cone skifields, and also the completion of the Hāwea to Haast Rd.

From an environmental perspective, the European settlers brought various introduced species, including
rabbits, deer, and trout, which were released into Lake Wānaka in 1876 and Lake Hāwea in 1911
(Roxburgh, 1990). Sawmilling, which took place primarily in the Matukituki and Makarora areas,
obviously resulted in some land clearance, with 1,000 metres of timber floated in rafts from Makarora
to Lowburn up to three times per week (Young and Young, 2013). Despite this, Wardle (2001, in Hewitt,
2017) notes that survey maps of the Upper Clutha from pre-1860 show similar forested areas to the
early 21st Century. Deforestation, as well as the introduction of rabbits and gold mining (particularly
sluicing and dredging) all resulted in an increase in erosion and sediment generation to the
Clutha/Mata-Au system (Young and Young, 2013), although the Upper Clutha was probably spared the

                                                                                                         8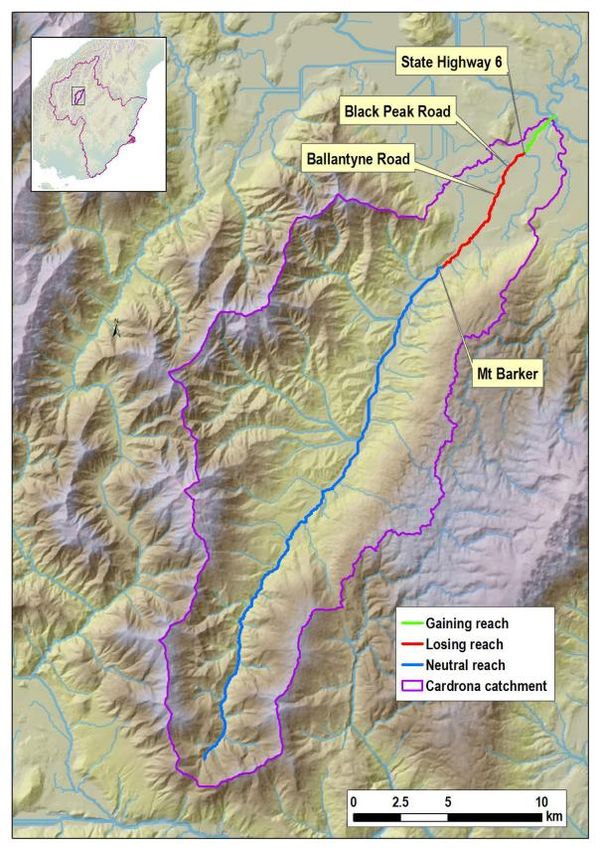
worst of these impacts with much of the sluicing and dredging occurring downstream of or in the
Kawarau catchment.

Urban development (albeit modest initially) also brings its own pressures. Roxburgh (1990) notes that
in the late 1950s Wānaka had no public sewerage system or water supply, with most residents sourcing
their water from bores or Bullock Creek. The water source from Bullock Creek “was a potential danger
to health especially when someone’s kitchen and stormwater drains emptied… into the same stream”.
A municipal water supply scheme was established in c. 1959, although many residents initially continued
to take water from Bullock Creek or from bores as they objected to the public supply being chlorinated.

Environmental standards for three waters infrastructure have of course improved significantly since
then, but this is countered to some extent by more extensive and intensive urban development.
Roxburgh notes that the population of Wānaka was “not many more than 100 households” in 1940, and
“a little under a thousand” in the late 1960s, compared to approximately 9,000 today and 12,500 total
in the wider Upper Clutha area (Maynard, 2017).

The second half of the 20th Century brought further significant changes to the function of the Clutha
River system with construction of dams at Roxburgh, Hāwea and then Clyde for hydroelectricity
generation. Under subsequently abandoned plans for additional dams at Queensberry and Luggate,
“artificial lakes would run toe-to-toe unbroken for a distance of 100 km” downstream of Wānaka, apart
from a few remnant sections (Young and Young, 2013). Aside from forming new lakes (or increasing
lake levels, in the case of the Hāwea Dam) and resulting in highly controlled flow environments, these
dams have also altered the ecology and morphology of the Clutha/Mata-Au system by restricting fish
passage and altering sedimentation patterns.

In more recent years, the Upper Clutha area has experienced significant economic and population
growth. The Wānaka Ward of Queenstown Lakes District (effectively the same as the study area) almost
doubled in population between 2001 and 2013, from 4,900 to 9,500 usual residents, while average daily
visitor numbers rose from 4,300 to 5,700 (Maynard, 2017). During approximately the same time period,
increased irrigation enabled more intensive agricultural land use, most notably in Hāwea Flat and
surrounding areas.

The pressures brought by these changes in land use are countered to some extent by increased
environmental awareness, with water quality recently topping the list of political issues New Zealanders
were concerned about in a national survey conducted for Fish and Game (Colmar Brunton, 2018). This
has manifested itself in increased conservation and reforestation/replanting efforts, more extensive and
intensive environmental monitoring, and stricter enforcement of environmental regulations.

In the Upper Clutha area, much of this work has been driven by the Guardians of Lake Wānaka and
Guardians of Lake Hāwea groups, and more recently, the Upper Clutha Lakes Trust who commissioned
this ICMP. The intent of the ICMP is to build upon existing environmental restoration efforts and to
present a blueprint for future environmental action to improve water quality as close as possible to its
predevelopment state, while also respecting other community values.

      Climate
Wānaka is located at a latitude of about 44.5 oS, an altitude of around 300 masl, and is 100 km from the
nearest coastline. It experiences a temperate climate comparable to the neighbouring Central Otago
area, with hot dry summers and cold dry winters meaning the area has New Zealand’s closest equivalent
to a semi-arid continental climate (Macara, 2015).
                                                                                                      9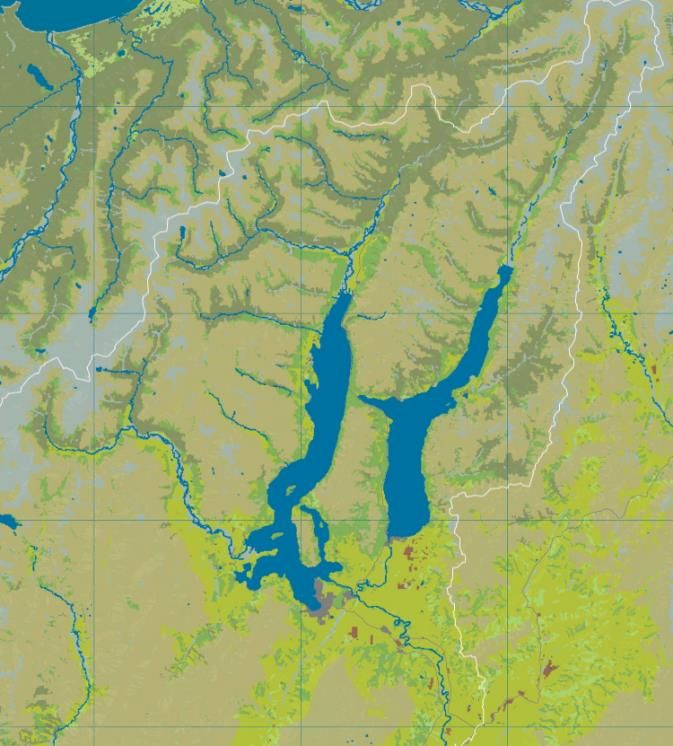
Figure 2: Wind compass for Wānaka Airport, showing prevailing wind from the west and (to a
lesser extent) the south-east). Source: Macara, 2015.

The prevailing wind is from the west (see Figure 2), meaning the area is sheltered from rain by the
Southern Alps to the west. Over the period 1981-2010, the weather station at Wānaka Airport
experienced a mean of 594 mm of rainfall per year. An average of 66 mm of rain falls in the wettest
month of December, while the two driest months (November and February) both experience 35 mm of
rainfall typically (Macara, 2015).

As shown in Figure 3, annual rainfall increases significantly towards the northern end of the Upper Clutha
catchment, and exceeds 2,000 mm in the mountains north of the Lakes. Makarora, for example,
experiences an average of 2,447 mm of rainfall annually, ranging from 134 mm in the driest month of
February to 251 mm in the wettest month.

                                                                                                       10
Figure 3: Modelled median annual rainfall for Otago. Note that although rainfall in the Wānaka
and the surrounding area is relatively low, areas further north in the Upper Clutha catchment
closer to the Southern Alps receive significantly more rainfall. Source: Macara, 2015.
Evapotranspiration data for Wānaka is only available since 2015 (at the Wānaka CWS site), with annual
evapotranspiration in the three completed years during that period ranging from 726-929 mm/year. A
longer evapotranspiration record (since April 2006) is available for the Cromwell EWS site, 40 km to the
south. Figure 4 shows a simple monthly water balance model based on comparison of rainfall at Wānaka
Airport with evapotranspiration at Cromwell EWS, for the ~13-year period where both datasets are
available. Note that this is a different time period from that discussed in NIWA’s report, and therefore
the monthly distribution of rainfall is somewhat different (e.g. May was the wettest month during the
period graphed, not December). This data presented in the graph shows that Wānaka experiences a
significant excess of evapotranspiration over rainfall for much of the year, with limited excess rainfall
occurring in the winter months.
Note that the annual ET at Wānaka CWS was approximately 100-150 mm lower than at Cromwell for
the 3 complete years when data was collected at both sites. Also, the 13-year period for which the data
is shown is less than would ideally be used for meteorological analysis. As such, the magnitude of the
excess evapotranspiration and excess rainfall indicated in Figure 4 should be interpreted as indicative.
Also, it is likely that the typical period during which excess rainfall occurs extends into April and
potentially even September. Nonetheless, Figure 4 is considered generally representative of the local
climate system, taking into account the limitations of the data available.
11Figure 4: Monthly water balance summary comparing mean monthly rainfall at Wānaka Airport
with mean monthly evapotranspiration at Cromwell. Data source: NIWA Cliflo database, for the
period April 2006-May 2019.
To the best of our knowledge, evapotranspiration data is not available near Makarora. However, this is
likely to be comparable to or lower than Wānaka, in which case rainfall would exceed evapotranspiration
throughout a typical year. This is reflected in modelled data for the number of days of soil moisture
deficit per year – there are approximately 80-90 days per year in the southern part of the Upper Clutha
near Wānaka, reducing to approximately 20 days per year at the northern end of the Lakes and near-
zero in the mountains (Macara, 2015).
As noted above, the area experiences a pseudo-continental climate with a large seasonal temperature
variation. Mean monthly temperatures at Wānaka are 15-20 oC in summer, with highs approaching or
exceeding 30 oC common. In winter, the mean monthly temperature reduces to approximately 5 oC, with
frosts common. For the 30 years from 1981-2010, there were typically 3 days per year with a maximum
temperature above 30 oC, and 73 days with a minimum temperature below freezing point. While the
taller mountains in the area typically hold snow throughout the warmer months, snow to valley level is
rare (Macara, 2015).
Under various climate change scenarios, temperatures in Otago are expected to increase by 0.6-0.9 oC
by 2031-2050 and 0.6-2.8oC by 2081-2100, compared to the 1986-2005 climate. This will be associated
with an increase in rainfall, particularly in winter and spring, and potentially with more extreme rainy
days. Significantly less snowfall is projected, which will also change the hydrological cycle as there will
be less snowmelt to contribute to base flow during summer. Winter flooding may also increase as less
precipitation at that time of year falls as snow. Droughts are expected to become more frequent, and
lakes are likely to have slightly higher levels and warmer temperatures, with potential ecological effects.
(Ministry for the Environment, 2018).
12Topography and land use
The southern part of the Upper Clutha is a generally flat valley set at approximately 300-400 masl. Lakes
Wānaka and Hāwea define the northern end of this zone, with water levels of approximately 280 and
340 masl, respectively, according to contour data available from LINZ (Harriss, 2019). The Clutha/Mata-
Au and Hāwea Rivers flow through the valley landscape through relatively incised channels set below
the flat terraces. This is the area where the majority of the population lives (including the towns of
Wānaka and Hāwea), while the rural land is used predominantly for pastoral farming. This includes some
relatively intensive agricultural activities on irrigated pasture, primarily on the Hāwea Flat. The hillsides
defining this valley are also generally used for low-intensity agriculture (i.e. drystock farming).
In most places the land rises steeply from the sides of the two lakes, with numerous peaks of ~1,000-
2,000 masl present within approximately 5 km of the lake shores, including on the narrow isthmus
between Lakes Wānaka and Hāwea. The various mountain ranges are separated by smaller river valleys,
most notably the Cardrona, Matukituki and Hunter Rivers and the Makarora-Wilkins-Young River
system. All of these are relatively flat-bottomed, narrow valleys, and therefore make up a small
proportion of the catchment area.
Further to the north and west of the lakes, the catchment includes large parts of Mount Aspiring
National Park. This is a mixture of native bush and alpine landscapes, with some glaciers. The catchment
boundaries in this area are defined by large peaks, most notably Mt Aspiring/Tititea (3,033 masl).
Data on land cover in Otago available from the LAWA (Land, Air, Water Aotearoa) website indicates that
land use change at a catchment scale has been relatively modest in recent years. As shown in Figure 5,
between 1996 and 2012 the urban centres in the southern part of the catchment expanded, some native
scrub/shrubland was converted to exotic grassland (presumably pasture) in the Matukituki and
Makarora catchments and on the western shore of Lake Wānaka, and there was a modest increase in
horticulture/cropping near Hāwea and elsewhere. However, this information may tend to suggest less
land use change than is actually occurring because:
• The dataset on which it is based covers a relatively short time period (~16 years), and does not
account for land use change before 1996 (or after 2012).
• The land use categories are relatively broad and land use changes that may be significant for
water quality could fall into the same category – for example an area which changed from
drystock farming to more intensive irrigated pasture would likely be categorised as exotic
grassland both before and after this change. Similarly, there is no distinction made between
residential, commercial, industrial, and other urban landuses.
As Figures 6 and 7 show, land use change is clearly evident in the Wānaka and Hāwea Basins (the most
populated parts of the catchment) over the past ~50 years.
13Figure 5: Catchment-scale land cover changes between 1996 (left) and 2012 (right). Source: LAWA.
© Landpro Ltd 2019Figure 6: Hāwea Flat in 1966 (left) and 2018 (right). Sources: Retrolens and QLDC GIS viewer, respectively.
15Figure 7: Wānaka in 1966 (top) and 2018 (bottom). Sources: Retrolens and QLDC GIS viewer,
respectively.
© Landpro Ltd 2019 16Another aspect of land use with the potential to affect water quality is activities which lead to
contamination of soil and/or groundwater. Discharges from these sites may then indirectly affect surface
water quality. Otago Regional Council have provided co-ordinates and basic details of all known sites
on which activities on the Ministry for the Environment’s Hazardous Activities and Industries List (HAIL,
2011) may have occurred. These are taken from the Council’s HAIL register.
These sites include a wide range of activities with a correspondingly wide range of risk levels: from
landfills and sawmills to small-scale horticultural activities and sites that may have stored relatively small
quantities of dangerous goods. Similarly, there are varying amounts of information available on each
site, from detailed investigations confirming the presence of contamination through to sites where
hazardous activities are suspected but no investigation has been carried out. It is also important to note
that the list is a “work in progress” and is not exhaustive. For example, airports are included on the HAIL,
but Wānaka Airport is not explicitly listed (it is included indirectly in relation to a fuel tank that was
formerly present there).
Accounting for all of these factors to assess the risk to water quality posed by these sites would be a
major undertaking and is beyond the scope of this review. However, the sites recorded in ORC’s register
(excluding verified non-HAIL sites) are mapped in Figure 8. In the map, landfills are shown in pink, with
all other sites in orange. This reflects the fact that, of the activities recorded in the register for the Upper
Clutha, landfills generally pose the highest risk to water quality due to the potential for ongoing leachate
discharges. The likelihood of this is highly site-specific, depending on the scale, age, use and design of
the landfill, and some of these sites are farm landfills or other small fill sites unlikely to have wide-
ranging effects (if any). Conversely, it is possible that some of the non-landfill HAIL sites may be highly
contaminated and could be affecting water quality.
Figure 8: Landfills (pink) and other potentially contaminated sites (orange) in the Upper Clutha.
Data source: ORC.
17Setting aside the above issues, and also acknowledging the limitations of this high-level approach, it is
noteworthy that there are several closed landfill sites recorded near waterways (in particular the
Makarora, Cardrona and Hāwea Rivers, and the Clutha near Luggate). We understand that QLDC
manage the four relevant landfills in accordance with long-term discharge consents, which in the case
of the former Wānaka landfill near the Cardrona River includes a requirement for groundwater and
surface water quality monitoring.
While this document is intended to cover water quality issues at catchment-scale, potential effects of
these and other contaminated sites near waterways is one issue that should be taken into account when
assessing any localised issues.
Geology and soils
The GNS Science/Te Pū Ao 1:250,000 NZ Geology Webmap (Heron, 2018; see Figure 9) shows that the
geology of the catchment is dominated by schist and other metamorphic rocks of the Rakaia Terrane,
typically of Permian-Triassic stratigraphic age.
Figure 9: Geological map extract, showing locations of Rakaia terrane rocks (purple and blue
areas) and more recent materials in yellow/light brown. Source: Heron, 2018.
18The floors of the Hunter, Matukituki, Cardrona, and Makarora-Wilkins-Young valleys are made up of
younger (primarily Holocene) river gravel deposits, with some Pleistocene deposits in the Cardrona
Valley.
The geology of the Wānaka and Hāwea Basins are dominated by Late Pleistocene river and glacial
deposits. This area was affected by at least four glacial periods, resulting in a complex arrangement of
areas with permeable river gravels and less permeable glacial till (Dale and Rekker, 2011, Wilson, 2012,
Thomas, 2018).
Some younger (Holocene) deposits are present near Lake Wānaka, the lower reaches of the Cardrona
River, and on the eastern side of the Hāwea Terrace.
Figure 10: Soil map extract showing mapped soil units in the southern part of the catchment,
coloured by drainage (from dark blue = very poorly-drained to light brown = very well-drained).
Source: SMap, Landcare Research, 2018.
Data on surface soils are also available for the southern part of the catchment (with limited data
elsewhere). As shown in Figure 10, most of the soils in the Wānaka and Hāwea Basins are relatively free-
draining, with smaller areas of poorly-drained soils in the Matukituki catchment and (to a lesser extent)
near Hāwea. The soils in each sub-area of the catchment are described in more detail (where data is
available) in Section 4
Hydrology and hydrogeology
Clutha River/Mata-Au
The Clutha/Mata-Au is one of New Zealand’s largest rivers. Its 21,000 km2 catchment covers
approximately two-thirds of Otago Region, from the mountains north of Lakes Wānaka, Hāwea and
Wakatipu in the north down towards Balclutha in the south. Those three lakes contribute approximately
75 % of the total flow at Balclutha, with the Upper Clutha lakes contributing a significant majority of
that (Murray, 1975).
19As discussed in Section 2.1, the area covered by the proposed ICMP is the Upper Clutha, defined as the
main stem of the Clutha/Mata-Au and all lakes and tributaries from the confluence with Luggate Creek
upstream. In this section, the hydrology of the catchment is discussed in three sub-catchments: the
Hāwea, and Wānaka catchments (the lakes and all streams feeding them), and the lower catchment
below the lakes (including the main stem, the Cardrona River and Luggate Creek).
Hāwea catchment
Lake Hāwea was raised by approximately 20 m in the 1950s by the construction of the Hāwea Dam, as
part of the Roxburgh hydroelectricity scheme (Martin, 2019). It is now managed by Contact Energy to
provide storage for both the Clyde and Roxburgh generation dams. Contact Energy holds a suite of
resource consents from Otago Regional Council to operate the Hāwea Dam, including:
• Consent 2001.383, which requires the levels of Lake Hāwea to be managed between 338 and
346 masl (with some exceptions for flood and electricity shortage situations).
• Consent 2001.392.V5, which requires the flow in the Hāwea River at Camp Hill Bridge to be
managed. In summary (and ignoring some exceptions), the conditions require the flow to be
maintained generally between 10 and 60 m3/s, and no higher than 200 m3/s, except in flood
emergency conditions. Otago Regional Council’s Water Monitoring and Alerts webpage states
that the mean annual low flow at the Camp Hill site is 7.3 m3/s (ORC, 2019c), although this is
for a calculation period that largely predates the current resource consent (1968-2007) and
therefore does not reflect current management of the Hāwea River.
The major tributary of the Hāwea catchment is the Hunter River, which flows from the Southern Alps in
the north through a narrow valley between the Huxley and Young Ranges. Other significant tributaries
include the Timaru River and the Dingle Burn, both of which flow into the eastern side of Lake Hāwea.
The Hāwea Basin also holds significant groundwater resources, most notably the Hāwea Flat and High
Terrace aquifers. These are unconfined aquifers which are connected to surface water (predominantly
Lake Hāwea and the Hāwea and Clutha Rivers, with recharge both from surface water and from soil
drainage. In recent years there has been significant expansion of groundwater use, particularly for
irrigation (see Section 2.4).
20Figure 11: Lake Hāwea and the Hāwea River in 1951, before the Hāwea Dam was built. Source:
National Library's Timeframes database. Reference: WA-28373-F.
Wānaka catchment
Lake Wānaka extends a distance of approximately 43 km from Wānaka in the south to Makarora in the
north. The principal tributaries are the Matukituki and the Makarora-Wilkins-Young River system. ORC
(2019) monitor the flow of the Matukituki at West Wānaka, where the median flow is approximately
45 m3/s, with flood flows sometimes exceeding 1,500 m3/s. There is no flow monitoring station on the
Makarora, but a rain gauge maintained by ORC records a mean annual rainfall of 2,396 mm, and NIWA’s
Rivermaps model predicts a median flow of 97 m3/s (Booker and Whitehead, 2017).
Clutha/Mata-au main stem and lower tributaries
The largest tributary within the Upper Clutha but downstream of the lakes is the Cardrona River, which
has a mean annual flow of 1.18 m3/s at Mt Barker (Ravenscroft et al., 2017), and a median flow of
1.95 m3/s (ORC, 2019). The middle and lower reaches of the Cardrona overlie the Wānaka Basin
Cardrona Gravel Aquifer, which is part of an interconnected ground-and-surface water system that also
includes Lake Wānaka, Bullock Creek and various other spring-fed streams within or near Wānaka. The
middle reaches of the Cardrona River are the major source of groundwater to this aquifer. Water then
flows generally to the north or north-west before discharging into the Lake Wānaka/Clutha River system,
either directly or via smaller waterways such as Bullock Creek, Creek 2, or the lower reaches of the
Cardrona. Because of this, the middle reaches of the Cardrona frequently run dry in summer (Dale and
Rekker, 2011; Golder Associates, 2015; Thomas, 2018). There is also a limited groundwater resource (the
Cardrona Alluvial Ribbon Aquifer) in the upper reaches of the Cardrona, within the Cardrona valley.
21The other tributary in this area is the much smaller Luggate Creek. There is limited information on the
hydrology of this catchment, but irrigators in this catchment have a minimum flow cut-off of 0.18 m3/s
(ORC, 2019).
The outlet from Lake Wānaka is near the south-eastern corner near Dublin Bay, north east of Wānaka
town. Both the Cardrona and Hāwea Rivers join the Clutha near Albert Town, approximately 5 km
downstream from the outlet. Below those confluences (but above the Luggate confluence), the Clutha
has a mean annual low flow of approximately 120 m3/s, with occasional flood flows above 1,000 m3/s.
Current water quality
ORC maintain a network of 22 water quality monitoring sites, including 7 which have at least 10 years’
worth of historical data available. A large number of sites were added to the network in 2018, which
significantly increases the spatial coverage. However, most of these sites have been operating for less
than a year, and therefore have limited data available. It is also important to note that even the longest-
running sites have only been monitored since the 1990s or late 1980s, and therefore the results are
reflective of a catchment already altered by centuries of human activity, including approximately 130
years of more dramatic land use changes during and since the colonial era.
22Figure 12: ORC surface water quality monitoring sites. Sites marked in blue have at least 10 years
of data available, sites marked in green are newer (mostly started 2018). Not shown: Makarora
River at Makarora (to the north) and Upper Cardrona at Tuohys Gully Road (to the south), both
new sites.
The Clutha/Mata-Au at Luggate Bridge site is the furthest down-stream site in the Upper Clutha, and
also has equal-longest record (alongside the Luggate Creek site), since February 1989. Water quality at
this site is a useful indicator of overall water quality in almost the entire Upper Clutha catchment;
Luggate Creek is the only significant Upper Clutha waterway to join the Clutha below Luggate Bridge.
The concentrations of key water quality variables measured at this site are presented in Figure 13.
In summary, the graph (and the more detailed summary of the recent part of the data set available on
the LAWA website) show that water quality at the site is excellent, in the best 25 % of comparable sites
for all parameters reported by LAWA. To contextualise the data plotted, the water quality guidelines
relevant to each variable are included (for attribute state “A” from the National Policy Statement for
Freshwater Management 2014, or for Cool Dry Low-elevation rivers from the Australian and New Zealand
Guidelines for Fresh and Marine Water Quality, 2018). These are upper limits intended to be compared
with median concentrations, with the exception of dissolved oxygen, which is a lower limit (7-day
minimum).
23As can be seen, there have been two spikes in the E. coli concentration (out of more than 150 samples)
which have significantly exceeded the limit which is intended to be compared with median
concentrations. The median concentration of E. coli (1 cfu/mL) is less than 1 % of the limit for safe
recreation. Turbidity values exceed the relevant guideline more regularly (60 of 356 samples), although
turbidity is largely an aesthetic variable and may be naturally elevated during high flow conditions. The
long-term median turbidity value is 0.6 NTU, which is approximately half of the limit (1.3 NTU). Turbidity
is related to clarity, and the data available on LAWA shows that black-disc visibility, another measure of
clarity, is typically 5 m (5-year median).
Otherwise, all of the other parameters shown have complied with the relevant guidelines throughout
the monitoring period, even if maxima are compared with the guidelines rather than medians. The data
presented in the graph are consistent with LAWA’s characterisation of the water quality at the site as
“excellent”, and there is no obvious indication from the data plotted in Figure 13 that this is changing
significantly.
While excellent water quality downstream is reflective of activities upstream, it is important to note that
the water quality at this site effectively “averages” water quality for a large number of upstream
tributaries, and the Clutha results do not rule out that smaller water bodies upstream could be
significantly impacted. Also, water quality impacts associated with some activities may take a long time
to be reflected in water quality downstream, particularly in the case of activities that involve a discharge
to groundwater, such as agriculture/horticulture, some stormwater systems and potentially
contaminated sites.
24Figure 13: Key water quality variables measured at the Clutha at Luggate Bridge, 1989-2018. Data
source: NIWA. Shaded bands show 5-year periods; horizontal dotted lines show relevant water
quality guidelines. Note: ppm/ppb = parts per million/billion; cfu = colony forming units, NTU =
nephelometric turbidity units; non-detects treated as detection limit.
25Error! Reference source not found. shows water quality data for the five Upper Clutha sites monitored
regularly during the period 2008-2019, which is the period for which data is available from the LAWA
website (supplemented with more recent data from ORC and the above Clutha data from NIWA). This
time period also overlaps with that covered in the ORC reports discussed below. The results presented
show that water quality in the smaller rivers included in the monitoring programme (the Hāwea,
Matukituki, Cardrona, and Luggate) is also generally good. In comparison to the Clutha site discussed
above though, these sites have more variability in water quality and higher peak contaminant
concentrations. NNN is very low in all of the water bodies monitored, and apart from a few spikes,
ammoniacal nitrogen concentrations comply with the guideline (which is intended to be compared with
median concentrations, rather than peaks). The record for DRP, E. coli and turbidity are marked by
significant spikes on Luggate Creek in a single sample from May 2014. The cause of this is unknown,
but it is not representative of the broader dataset. E. coli concentrations generally comply with the
guidelines, apart from occasional spikes. Guidelines for DRP and turbidity are not shown as these vary
slightly depending on the River Environmental Classification for each site. DRP concentrations were
frequently elevated above the guideline in Luggate Creek, but otherwise generally compliant. Turbidity
concentrations exceeded the relevant guidelines more regularly, although again, this is largely an
aesthetic guideline.
Similar data is available for the two lakes from LAWA and other publicly available sources. This is
discussed in Section 4.3.
26Figure 14: Key water quality parameters for 5 Upper Clutha river sites monitored from 2008-2019.
Shaded bands show 2-year periods; horizontal dotted lines show relevant water quality
guidelines. Note: non-detects treated as detection limit.
27The data from the ORC monitoring sites from 2017 and earlier has been summarised in three State of
the Environment (SOE) reports by ORC (ORC, 2007 and Ozanne, 2012, Uytendaal and Ozanne, 2018).
These include a detailed analysis of the water quality data available at those dates, of which a brief
summary is presented here. It is important to note that there have been significant changes in
regulations and best practice for environmental reporting during the period when these reports were
produced. Consequently, the measures and statistics used changed somewhat between the reports,
making direct comparisons of the results given difficult in some cases.
Figure 15 shows a region-wide summary of the Water Quality Index (WQI) for all sites considered in the
2012 report, showing that the Upper Clutha catchment and the neighbouring Kawarau catchment have
probably the highest WQI ratings in the region. The WQI is a high-level water quality indicator based
on comparison of median values of the following individual water quality variables with their respective
guideline values:
• Dissolved reactive phosphorus (DRP, guideline ≤ 0.9 mg/L)
• Nitrate and nitrite nitrogen (NNN; guideline ≤ 0.444 mg/L)
• Ammonium (NH4; guideline ≤ 0.9 mg/L)
• Escherichia coli (E. coli; guideline ≤ 126 cfu/mL)
• Turbidity (a measure of water clarity; guideline ≤ 5.6 NTU)
• Dissolved oxygen (DO, guideline ≥ 80 %)
Note that many of these guidelines have now been superseded, and the WQI itself was not calculated
in the most recent ORC report. Nonetheless, the WQI is a convenient and simple summary indicator,
and the findings presented in Figure 13 are broadly consistent with those of the 2018 report.
As shown on Figure 15, the WQI for all but one Upper Clutha monitoring site was “very good” (all six
variables comply with guideline values), with the Luggate Creek site “good” (five out of six variables
compliant). An Appendix to the report suggests that the water quality at the Luggate Creek site is in
fact also “very good”, although it does have a noticeably lower compliance percentage (84 %, versus
approximately 96 % for most other Upper Clutha sites). Lake Hāwea was one of three sites in the region
at which the guideline values for all six variables was met in every sample collected during the 2006-
2011 monitoring period (i.e. 100 % compliance), while the same occurred for Lake Wānaka in 2001-2006
(ORC, 2007 and Ozanne, 2012).
28Figure 15: Water Quality Index (WQI) for the 62 core water quality monitoring sites in Otago,
based on 2001-2011 data. Source: Ozanne, 2012.
The most recent report (Uytendaal and Ozanne, 2018) assesses the water quality results somewhat
differently, primarily due to the regulatory changes discussed in detail in Section 3. In brief, the 80th
percentile concentrations for samples collected at below median flow are used rather than medians,
and many of the guidelines have changed; mostly becoming lower (more stringent). However, the
conclusions are similar in that most sites are compliant with the new standards. The main exceptions to
this are the Cardrona at Mount Barker site, where NNN concentrations were “marginally non-compliant”
with the new standard of 0.075 mg/L, and Luggate Creek, where DRP and E. coli both slightly exceeded
29the new guidelines. The Matukituki monitoring site also very slightly exceeded the standards for
ammoniacal nitrogen and E. coli.
All Upper Clutha sites were found to be in the ‘A’ attribute state (the highest grade) under the National
Objectives Framework for nitrate nitrogen and ammoniacal nitrogen, as was also the case for E. coli for
all sites except the Matukituki. The Matukituki received a ‘C’ grade (the lowest ‘passing’ grade), which
appears to be primarily related to occasional significant spikes, rather than high average concentrations.
ORC also carried out statistical analysis to identify trends in the water quality, with the results for the
Upper Clutha sites for both monitoring periods summarised in Table 1. It is noteworthy that very few
trends were observed consistently between the three monitoring periods (the last two of which
overlapped). If there was a genuine meaningful trend in the concentrations of a given variable at a
particular site caused by land use change or other ongoing activities, this would probably be evident in
this trend being detected in multiple assessments. However, the statistical methodology changed
between the three reports (briefly, the first report considered only statistical significance of any change,
while the second also considered whether the change was greater than 1 % per year, and the third
considered an 11-year, rather than 5-year period). This may partially explain the lack of consistent trends
between the three reports.
30Table 1: Summary of ORC water quality trends analysis.
Site 2001-2006 trend (ORC, 2006-2011 trend 2006-2017 trend (Uytendaal
2007) (Ozanne, 2012) and Ozanne, 2018)
Improving Degrading Improving Degrading Improving Degrading
Lake Wānaka conductivity, - - - - turbidity
E. coli, NNN,
suspended
solids (SS),
turbidity
Lake Hāwea NH4, - - - - NNN,
conductivity, turbidity
SS
Clutha/Mata- NH4 conductivity, NH4, TN, - - NNN, TN,
Au at Luggate total nitrogen NNN, TP
(TN), total
phosphorus
(TP)
Cardrona River NNN, SS, NH4 E. coli, SS - - E. coli
(at Mt Barker) TN, turbidity
Matukituki No data No data - - - turbidity
River
Hāwea River at No data No data - NNN - NNN,
Camphill turbidity
Bridge
Luggate Creek No data No data No data No data - TP, turbidity
at SH6
Note: “-“ indicates no statistically significant/meaningful improving/degrading trend was observed for the
variables monitored during that time period. Monitoring suite monitors between sites. See Tables 6.2-6.4
of ORC (2007) and Tables 26-27 of Ozanne (2012) for details.
As noted above, ORC added a number of sites in the Upper Clutha to their monitoring network in August
2018. There is insufficient data from these to meaningfully analyse for trends (typically only 9 samples
per site). Figure 16 shows a simple summary of this data (and the data for the previously existing sites
during the same period) by sub-catchment. Wānaka includes all tributaries of the Lake, Hāwea includes
the Hāwea River and the tributaries of Lake Hāwea, and lower catchment includes the Cardrona River
and Luggate Creek. This figure gives a broadly consistent picture to the previous figures and discussion,
indicating that water quality downstream on the main stem is generally slightly better than further
upstream, presumably due to the averaging effect of the large water body minimising the effect of any
localised discharges. In particular, parts of the Wānaka sub-catchment and Lower Catchment areas
have elevated concentrations of NNN and DRP, respectively, while elevated E. coli concentrations can
occur in both sub-catchments.
31With additional data and more detailed, site-by site analysis, in the near future it will become possible
to identify the principal sources of these contaminants to the Upper Clutha catchment, including
approximate mass balance calculations (if sufficient flow data is available). In turn, this will enable more
targeted interventions to improve water quality.
As part of completing this review, it has been identified that groundwater quality data in the catchment
is very limited, apart from single samples that are often collected when wells are drilled. Some data for
the Hāwea Basin aquifers was analysed by Wilson (2012). This included analysis of data from two wells
with a relatively short time series, in addition to others with single samples. Groundwater quality was
found to be generally excellent, but with elevated nitrate concentrations in the vicinity of Hāwea Flat
township, probably due to septic tank contamination (Wilson, 2012).
Aside from this, there appears to be limited groundwater quality data, and even more limited reporting
on that data. Given the high degree of connection between surface and groundwater in the Upper
Clutha this should be a priority for further research.
32Figure 16: Jitter plot of key water quality parameters by sub-catchment for recent (post August 2018) water quality monitoring sites. Note: non-detects are
shown as the detection limit. NH4-N and DRP detection limits vary somewhat between sites.
© Landpro Ltd 2019 33Ecology
Before human settlement, it is understood that the Upper Clutha catchment was largely forested.
Kanuka, kowhai and Hall’s totara were likely the dominant species in the southern part of the catchment,
while significant beech forests existed elsewhere (Walker et al., 2003, McGlone et al., 2003). Numerous
bird species, including kiwi, weka, kakapo, kaka, laughing owls, Haast’s eagle, falcons, morepork and
several moa species are known to have lived in the area (McGlone et al, 2003).
Fires occurred naturally in southern forests, but pollen records and other evidence shows a significant
increase in fires around 800-600 years ago after Māori settlement. Further deforestation occurred after
the arrival of European colonists due to farming and forestry, although in the case of the Upper Clutha
this seems to have had a relatively modest effect (see Section 2.2). Exotic species introduced by the
Māori and, to a greater extent, Europeans significantly reduced native bird populations, and in many
areas displaced them with an entirely exotic fauna (McGlone et al, 2003)
In terms of surface water ecology, the ORC reports (ORC, 2007 and Ozanne, 2012) referenced in the
previous section also include measurements of some ecological variables, though for a limited number
of sites. The variables monitored were:
• The macroinvertebrate community index (MCI), a measure of the sensitivity of
macroinvertebrates to pollution. The numerical values were converted by ORC to a four-level
qualitative rating shown in Figure 5.1 of ORC (2007): very good > good > fair > poor.
• The EPT species index, a measure of the population of mayflies, stoneflies and caddisflies (which
are some of the most sensitive species to pollution) as a percentage of the total number of
species found at a site. Note that the EPT % was not reported in ORC’s 2012 report, but was
estimated from data in Appendix 9 of that report. The EPT % values are also converted to a
qualitative rating (see Figure 5.3 of ORC, 2007), with the following grades: very high > high >
moderate > low > very low.
• Taxa richness, the total number of species collected at a sampling site. This is also reported as
a qualitative rating with the same grades as for EPT %, as shown in Figure 5.4 of ORC (2007).
Note that the reporting of these attributes has also changed between the three reports. Summary values
based on the qualitative scales used in the ORC (2007) reports are used for simplicity and consistency,
although these were not always reported in the later reports and had to be calculated from the raw
results in some cases.
© Landpro Ltd 2019 34You can also read