Cook Islands Ridge to Reef Island Diagnostic Analysis Technical Report
←
→
Page content transcription
If your browser does not render page correctly, please read the page content below
Cook Islands Ridge to Reef
                      Island Diagnostic Analysis Technical Report

Cook Islands Ridge to Reef
Island Diagnostic Analysis
     Technical Report

                                                                    1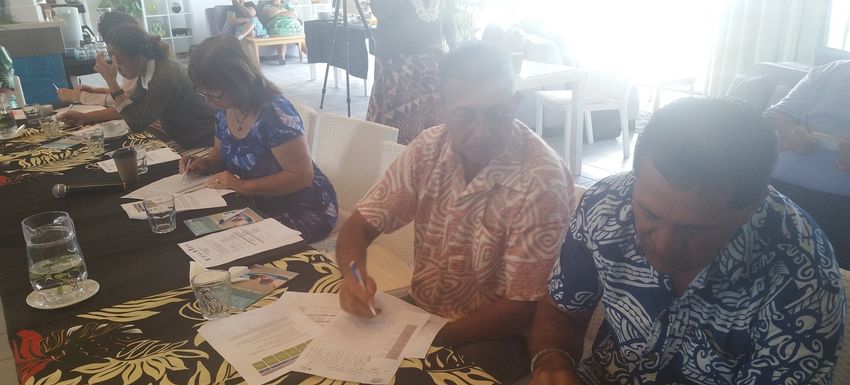

Cook Islands Ridge to Reef
  Island Diagnostic Analysis Technical Report

Prepared by Pacific R2R Regional Programme Coordination Unit

                      Suva, Fiji, 2021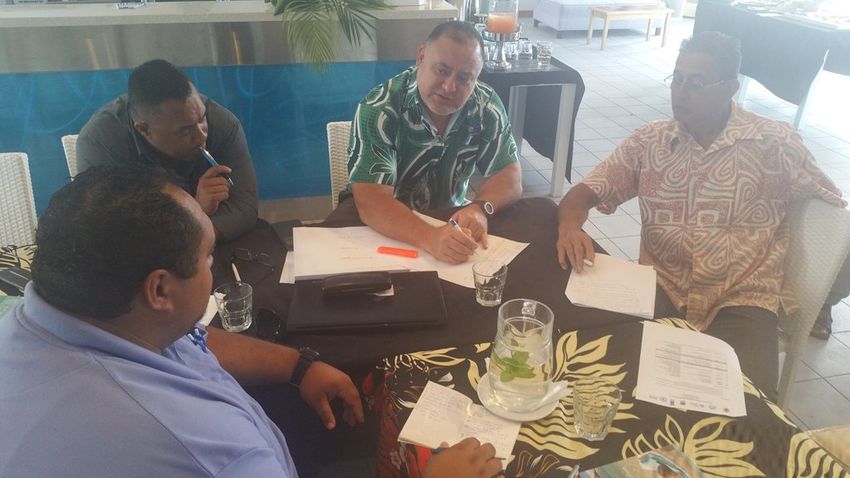
© Pacific Community (SPC) 2021
       All rights for commercial/for profit reproduction or translation, in any form, reserved.
         SPC authorises the partial reproduction or translation of this material for scientific,
         educational or research purposes, provided that SPC and the source document are
    properly acknowledged. Permission to reproduce the document and/or translate in whole,
    in any form, whether for commercial/for profit or non-profit purposes, must be requested
        in writing. Original SPC artwork may not be altered or separately published without
                                              permission.

                                       Original text: English

Prepared by Pacific R2R Regional Programme Coordination Unit

Edited by: Seema Deo (Footprints in the Sand Consulting)

Layout and Design by Navneet Lal/Pacific Community (SPC)

     Prepared for publication at SPC’s Suva Regional Office, Private Mail Bag, Suva, Fiji, 2021
                                    www.spc.int | spc@spc.int

                             Printed by Quality Print, Suva, Fiji, 2021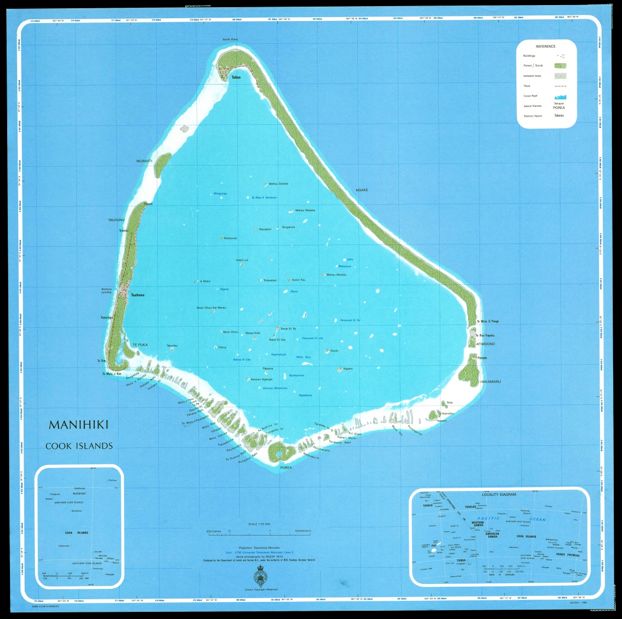
Cook Islands Ridge to Reef
                                                                                                                               Island Diagnostic Analysis Technical Report

Contents
Abbreviations ............................................................................................................................... vi
List of Tables................................................................................................................................. vii
List of Figures...............................................................................................................................viii
Executive Summary........................................................................................................................ 1
1. Introduction............................................................................................................................... 2
2. Methodology.............................................................................................................................. 3
   2.1 Background.........................................................................................................................................................3
   2.2 Cook Islands Methodology.................................................................................................................................3
       2.2.1 Identifying and prioritising environmental problems:.................................................................................3
       2.2.2 Island Environmental Problem Prioritisation Criteria:.................................................................................3
       2.2.3 Determining environmental and socioeconomic impacts:..........................................................................3
       2.2.4 Developing causal chains:............................................................................................................................4
       2.2.5 Report back and discussion:........................................................................................................................4
3. Description of Cook Islands........................................................................................................ 5
   3.1 Physical and Geographical Characteristics..........................................................................................................5
       3.1.1 Geology.......................................................................................................................................................6
       3.1.2 Soils and Topography...................................................................................................................................6
       3.1.3 Vegetation...................................................................................................................................................6
       3.1.4 Climate........................................................................................................................................................6
       3.1.5 Natural disasters..........................................................................................................................................8
       3.1.6 Sources of Potable Water............................................................................................................................8
   		 3.2 Socioeconomic Situation....................................................................................................................................9
       3.2.1 Demographic data.......................................................................................................................................9
       3.2.2 Migration processes..................................................................................................................................10
       3.2.3 State of Economy.......................................................................................................................................10
       3.2.4 Agriculture.................................................................................................................................................11
       3.2.5 Livestock....................................................................................................................................................12
       3.2.6 Social development and living conditions.................................................................................................12
       3.2.7 Health and Hygiene...................................................................................................................................12
   3.3 Ecological Status...............................................................................................................................................13
       3.3.1 Assessment of legislation/policy that defines National Protected areas..................................................13
       3.3.2 Identification of hotspots − the characteristics that are used to assess a hotspot...................................13
       3.3.3 Species of note..........................................................................................................................................14
       3.3.4 Major threats and concerns......................................................................................................................15
       3.3.5 Review of Rapid Coastal Assessment........................................................................................................15

                                                                                                                                                                                iii
4. Ridge to Reef Management in Cook Islands............................................................................. 16
        4.1 Resources..........................................................................................................................................................16
            4.1.1 Freshwater.................................................................................................................................................16
            4.1.2 Coastal.......................................................................................................................................................16
            4.1.3 Solid Waste................................................................................................................................................18
            4.1.4 Liquid Waste..............................................................................................................................................18
            4.1.5 Land rehabilitation....................................................................................................................................18
            4.1.6 Forest.........................................................................................................................................................18
            4.1.7 Minerals.....................................................................................................................................................19
        4.2 Nature Reserves and Protected Areas..............................................................................................................21
            4.2.1 The Cook Islands........................................................................................................................................21
                4.2.1.1 Suwarrow Atoll National Park............................................................................................................22
                4.2.1.2 Marae Moana..................................................................................................................................... 23
                4.2.1.3 Manaue and Takutea Wildlife Sanctuary............................................................................................24
                4.2.1.4 Aitutaki Island Reserve.......................................................................................................................25
                4.2.1.5 Manihiki Island Reserve.....................................................................................................................26
                4.2.1.6 Mitiaro Island Reserve.......................................................................................................................27
                4.2.1.7 Nassau and Pukapuka Island Reserve................................................................................................28
        4.3 Island Vulnerability...........................................................................................................................................29
            4.3.1 Types of disasters......................................................................................................................................29
            4.3.2 Issues and concerns...................................................................................................................................30
            4.3.3 Measures to manage impacts...................................................................................................................36
     5. Institutional, Legal and Policy Factors...................................................................................... 36
        5.1 Institutional Setting...........................................................................................................................................36
            5.1.1 Sector-based Laws.....................................................................................................................................36
                5.1.1.1 Environment....................................................................................................................................... 36
                5.1.1.2 Water................................................................................................................................................. 36
                5.1.1.3 Coast.................................................................................................................................................. 37
                5.1.1.4 Land.................................................................................................................................................... 37
                5.1.1.5 Forest................................................................................................................................................. 37
                5.1.1.6 Agriculture......................................................................................................................................... 37
                5.1.1.7 Minerals............................................................................................................................................. 37
                5.1.1.8 Disaster and Climate Change.............................................................................................................38
        5.2 Linkages between policies................................................................................................................................38
        5.3 Multilateral Environmental Agreements...........................................................................................................42
        5.4 Constraints and Limitations..............................................................................................................................43
        5.5 Public and Stakeholder Participation................................................................................................................44
     7. Results: National Priority Issues............................................................................................... 44
        7.1 Key Problems, Sectors, and Immediate Causes................................................................................................44
     8. Options for Reform and Action................................................................................................ 52

iv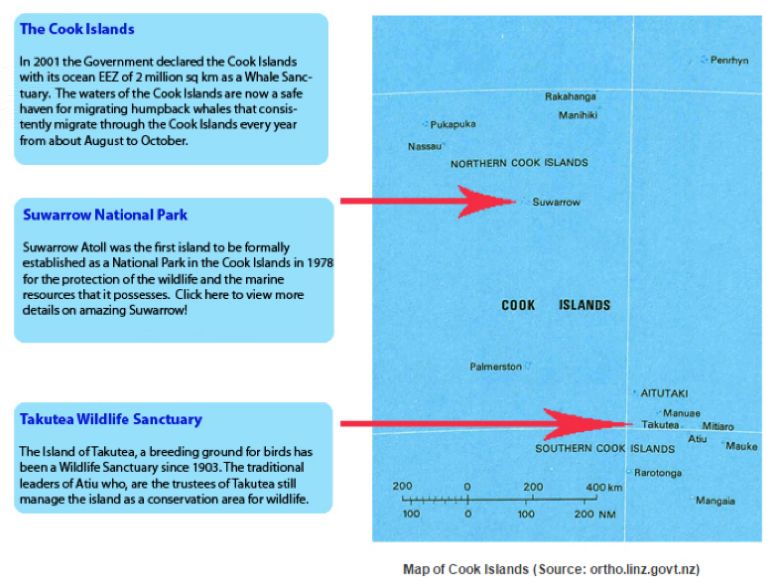
Cook Islands Ridge to Reef
                                                                                                                       Island Diagnostic Analysis Technical Report

9. Recommendations................................................................................................................... 53
   9.1 Key Sectors Contributing to the Problem.........................................................................................................58
   9.2 Linkage to other environmental problems.......................................................................................................58
   9.3 Geographical location of impacts.....................................................................................................................58
   9.4 Ridge-to-reef continuum..................................................................................................................................58
   9.5 Relevant institutional legal factors....................................................................................................................59
References.................................................................................................................................... 60
Annex		......................................................................................................................................... 63
   Annex 1: Guiding material for the IDA workshop...................................................................................................63
   Annex 2: Globally threatened species that occur in the Cook Islands....................................................................66
   Annex 3 Summary of Data on Existing Protected Areas in the Cook Islands..........................................................68
   Annex 4 Multilateral Environmental Agreements signed by the Cook Islands.......................................................69

                                                                                                                                                                     v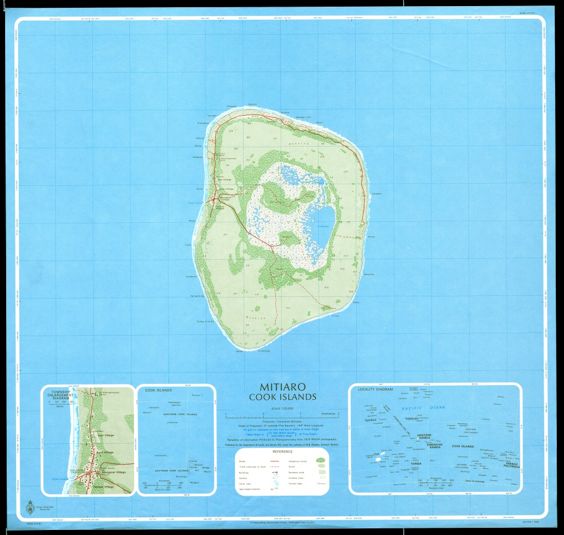
Abbreviations
     ADB        Asian Development Bank
     CEDAW      Convention on the Elimination of all forms of Discrimination Against Women
     CIMP       Cook Islands Marine Park
     CSO        Civil Society Organisation
     DIN        Dissolved Inorganic Nitrogen
     DRM        Disaster Risk Management
     DSM        Deep sea minerals
     EEZ        Exclusive Economic Zone
     ENSO       El Niño Southern Oscillation
     ETA        Electronic Travel Authority
     FAO        Food and Agriculture Organization
     FRA        Forest Resource Assessment
     GDP        Gross Domestic Product
     GEF        Global Environment Facility
     GIWA       Global International Waters Assessment
     GLAAS      Global Analysis and Assessment of Sanitation and Drinking Water
     IDA        Island Diagnostic Analysis
     IDP        Island Development Plan
     IUCN       International Union for Conservation of Nature
     IWRM       Integrated Water Resources Management
     MEA        Multilateral Environmental Agreement
     MEC        Muri Environment Care
     MMR        Ministry of Marine Resources
     NBSAP      National Biodiversity Strategy and Action Plan
     NCD        Non-communicable disease
     NES        National Environment Service
     NESAF      National Environment Strategic Action Framework
     NGO        Non-governmental organisation
     NIWA       National Institute of Water and Atmospheric Research
     OPM        Office of the Prime Minister
     R2R        Ridge to Reef
     REE        Rare-earth elements
     SAP        Strategic Action Plan
     SBM        Seabed Minerals
     SEAFRAME   Sea Level Fine Resolution Acoustic Measuring Equipment
     SIDS       Small Island Developing States
     SOPAC      South Pacific Applied Geoscience Commission
     SPC        Pacific Community
     SPREP      Secretariat of the Pacific Regional Environment Programme
     UN         The United Nations
     UNCED      United Nations Conference on Environment and Development
     UNEP       United Nations Environment Programme
     V&A        Vulnerability & Adaptation
     WASH       Water Sanitation and Hygiene
     WATSAN     Water, Waste & Sanitation
     WHO        World Health Organisation

vi
Cook Islands Ridge to Reef
                                                                                                    Island Diagnostic Analysis Technical Report

List of TABLES
Table 1:      Census information on Cook Islands (2019).................................................................... 9
Table 2:      Showing the various environmental legislations with formal status............................. 13
Table 3:      Status of species in the IUCN Red List in the Cook Islands............................................ 14
Table 4:      Highlights on the R2R related efforts in the forest sector............................................. 19
Table 5:      Protected areas in the Cook Islands.............................................................................. 21
Table 6:      Average damage cost per cyclone stands at about $4.5 million which is about
		            2% of the countries GDP. (COP23 Fiji: UN Climate Change Conference 2017).............. 30
Table 7:      Summary of Cook Islands legislation relevant to the management of the catchment,
		            coastal and marine environment, and resources.......................................................... 38
Table 8:      Coordinating mechanism, objectives, tasks and activity areas of the
		            Environment Act............................................................................................................ 39
Table 9:      Coordinating mechanism, objectives, tasks and activity areas of the
		            Marine Resources Act.................................................................................................... 40
Table 10: Coordinating mechanism, objectives, tasks and activity areas of the
		        Islands Government policy/legislation.......................................................................... 40
Table 11: Coordinating mechanism, objectives, tasks and activity areas of the IWRM Policy...... 41
Table 12: Coordinating mechanism, objectives, tasks and activity areas of the
		        National Sanitation Policy.............................................................................................. 41
Table 13: Major multilateral environmental agreements signed by Cook Islands........................ 42
Table 14: Environmental and socioeconomic impacts, immediate and underlying causes,
		        root causes, linkage to other environmental problems and geographical
		        location relating to the identified problem of deterioration of water quality............... 44
Table 15: Environmental and socioeconomic impacts, immediate and underlying causes,
		        root causes, linkage to other environmental problems, and geographical location
		        relating to the identified problem of stress on ground and surface water resources... 47
Table 16: Environmental and socioeconomic impacts, immediate and underlying causes, root
          .causes, linkage to other environmental problems, and geographical location relating to
		         the identified problem of deforestation, riparian, and vegetation clearance.............. 48
Table 17:     Environmental and socioeconomic impacts, immediate and underlying causes,
		            root causes, linkage to other environmental problems, and geographical location
		            relating to the identified problem of near shore, terrestrial and surface water,
		            inland flora and fauna and wetlands ecosystem degradation....................................... 49
Table 18: Environmental and socioeconomic impacts, immediate and underlying causes,
		        root causes, linkage to other environmental problems, and geographical location
		        relating to the identified problem of eutrophication.................................................... 50
Table 19: Environmental and socioeconomic impacts, immediate and underlying causes,
		        root causes, linkage to other environmental problems, and geographical location
		        relating to the identified problem of solid and liquid waste management................... 51
Table 20: Identified options for reform of each environmental problem..................................... 52
Table 21: Identified environmental problems and relevant aspects for decisions makers........... 54
                                                                                                                                                  vii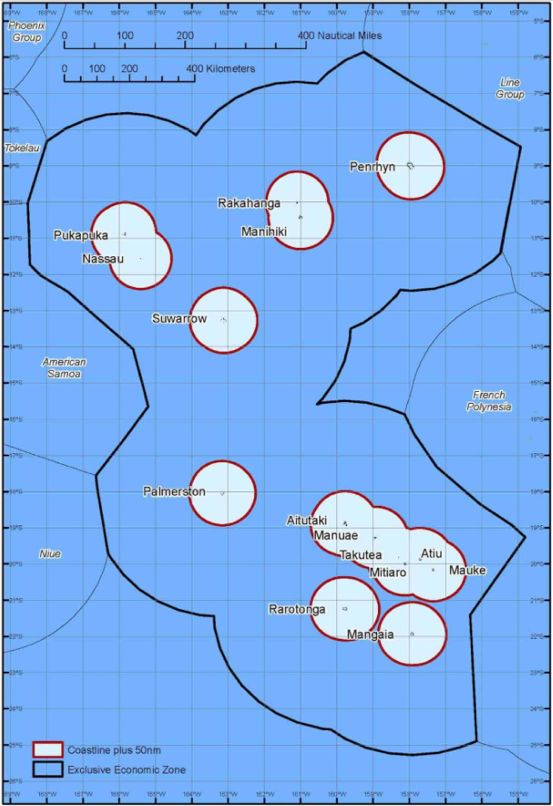
List of Figures
Figure 1: Location of Cook Islands in the Pacific Ocean (Parakoti and Davie 2007)...................... 5
Figure 2: Map of Cook Islands (highlighting Avarua as the Capital) (Parakoti and Davie 2007).... 5
Figure 3: Monthly Temperature and Rainfall in Rarotonga, Cook Islands (2020).......................... 7
Figure 4: The average positions of the major climate features in November to April.
The arrows show near surface winds, the blue shading represents the bands
of rainfall convergence zones, the dashed oval shows the West Pacific Warm
Pool and H represents typical (Parakoti and Davie 2007)............................................... 8
Figure 5: Water intakes in relation to the main upper catchment in Rarotonga
(Data source: Ministry of Works).................................................................................... 9
Figure 6: Vulnerability & Adaptation (V&A) Assessments........................................................... 17
Figure 7: The seafloor of the Cook Islands (McCormack 2002)................................................... 20
Figure 8: Map of the Cook Islands and locations of Suwarrow National Park and
Takutea Wildlife Sanctuary........................................................................................... 21
Figure 9: Map of Suwarrow Atoll National Park.......................................................................... 22
Figure 10: Marae Moana Marine Park........................................................................................... 23
Figure 11: Map of Manaue and Takutea Wildlife Sanctuary......................................................... 24
Figure 12: Map of Aitutaki Island Reserve..................................................................................... 25
Figure 13: Map of Manihiki Island Reserve................................................................................... 26
Figure 14: Map of Mitiaro Island Reserve..................................................................................... 27
Figure 15: Map of Nassau and Pukapuka Island Reserve.............................................................. 28
Figure 20: Mortality and combined economic losses caused by natural and other disasters....... 29
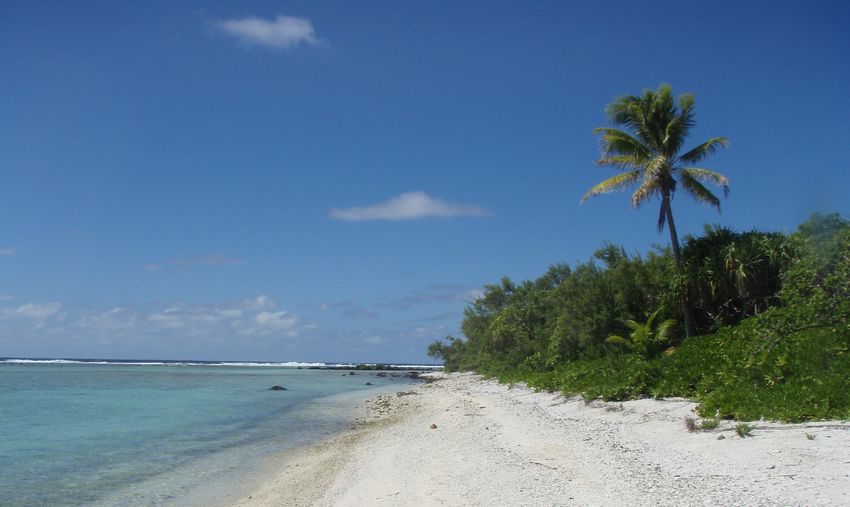
Figure 21: View of Muri Beach in Rarotonga Island, Cook Islands, 2010....................................... 31
Figure 22: The regional distribution of the rate of sea-level rise measured by
satellite altimeters from January 1993 to December 2010, with the location of
Cook Islands indicated.................................................................................................. 34
Figure 23: Annual rainfall in Rarotonga for the past few decades (1950 – 2009).......................... 35
viiiCook Islands Ridge to Reef
Island Diagnostic Analysis Technical Report
Executive Summary
Environmental problems that affect Pacific Island countries affect the livelihood, socioeconomic and
general well-being of local communities. Many of these problems are cross-sectoral in nature, and
influence the entire system, from ridge to reef. The rising onslaught of climate change and the issues
relating to unsustainable and irresponsible management of natural resources, compounds the
problem. This report is a diagnostic analysis of priority environmental problems that were identified
during a stakeholder consultation held in Muri district in Rarotonga, Cook Islands in 2018. In the
one-day workshop, representatives from government, civil society organisations and traditional
community leaders gathered in Rarotonga to discuss, identify, and prioritise current issues of concern.
The main discussions and cluster group work revolved around highlighting all existing environmental
problems from ridge to reef, prioritising them, and coming up with the six most important issues,
which were as follows:
• Deterioration of water quality
• Stress on ground and surface water resources
• Deforestation, riparian, and vegetation clearance
• Ecosystem degradation – including fauna/flora in near shore, terrestrial and surface
water, inland, lagoon and wetlands
• Eutrophication of coastal waters
• Solid and liquid waste management
The impact and socioeconomic consequences of these problems were also part of the discussions,
and these were listed and recorded. Analyses were then conducted to identify the root causes of
these problems, along with practices and sources from which these environmental threats have
risen.
What transpired from the consultation was that the main causes of the environmental problems
were related to poor water, waste, and land management practices. These would form the basis of
potential leverage points where options for reform and intervention may be introduced. Reviewing
current policies, stronger enforcement measures (i.e., harsher penalties and fines), building local
capacity and technical expertise (workshops as well as awareness materials), and tighter stakeholder
collaborations could be preliminary measures towards addressing and mitigating these problems.
The thirteen (13) principles of ridge to reef provide guidance and a planning framework to address
challenges and implement commitments to ensure ecosystem integrity, and to conserve and
sustainably use goods and services in Rarotonga and the whole country.
“The key to making real change is to upskill the people and to build their knowledge and understanding.
That’s quite an iterative process, and one that takes time” Dr. Julie Hall, NIWA regional manager.
11. Introduction
The ‘Ridge to Reef’ system in Small Island Developing States (SIDS) covers a significant part of the
land, water and coastal ecological systems in each high island or atoll country in this region. The inter-
connectivity and inter-linkages are dominant considerations where the philosophy of cross-sectoral
coordination and integration of freshwater watershed management with coastal area management
is essential in the planning and management of these resources. These include planning and
management of freshwater use, sanitation, wastewater treatment and pollution control, sustainable
land use and forestry practices, balancing coastal livelihoods and biodiversity conservation, hazard
risk reduction, and climate variability and change.
The R2R island diagnostic analysis (IDA) is necessary to effectively mitigate and address issues and
challenges that affect the ‘ridge to reef’ system. This IDA framework work in the Cook Islands was a
focused exercise encouraging effective dialogue and consultations amongst relevant stakeholders.
The exercise provided the opportunity for frank exchanges and discussion with the initial purpose
of identifying and highlighting priority issues that affect the environmental and socioeconomic
landscapes of SIDS.
Gender considerations and social inclusion is a necessary part of the IDA for R2R projects. The R2R IDA
Guideline and Diagnostic Gender Guide aim to guide those preparing diagnostic analysis in project
sites and at the country level on collection of sex-disaggregated data and the inclusion of women,
youth, and other vulnerable members of community in all research areas and public consultations.
The IDA was designed as a tool and a collaborative stepwise process to identify, quantify, and set
priorities for environmental problems that are cross-sectoral (or from ridge-to-reef) in nature.
The IDA was also intended to help identify potential leverage points and options for reform and
intervention.
Consistent with the R2R IDA Guide, the Cook Islands diagnostic analysis process involved:
• Identifying and prioritising the ridge to reef problems.
• Gathering and interpreting information on the environmental impacts and
socioeconomic consequences of each problem.
• Analysing the immediate, underlying, and root causes for each problem, and in
particular identifying specific practices, sources, locations, and human activity sectors
from which environmental degradation arises or threatens to arise.
• Identifying and evaluating options for reform and action.
2Cook Islands Ridge to Reef
Island Diagnostic Analysis Technical Report
2. Methodology
2.1 Background
The approach taken for the Ridge to Reef Programme Island Diagnostic Analysis (IDA) was derived
from the Global International Waters Assessment (GIWA), the GEF Transboundary Diagnostic Analysis,
and Pacific IWRM Diagnostic Analysis methodologies. The substance of these methodologies has
been adapted to suit the broader ecosystem approach of the Ridge to Reef Programme and include
terrestrial and marine ecosystems as well as water (IW:LEARN, 2021).
Stakeholders from the various sectors and disciplines were present for the IDA and included
representatives from government, the private sector, Civil Society Organisations (CSOs) and leaders
of the local communities. Both genders were equally represented at the workshop.
2.2 Cook Islands Methodology
2.2.1 Identifying and prioritising environmental problems:
i. With the aid of a facilitator and the predefined list of common environmental problems
(Annex 1), the IDA Development Team was encouraged to brainstorm a complete list of
the environmental problems in country.
ii. Once the list was refined, the participants focused on the ‘real’ environmental problems
(as opposed to things that were governance causes or impacts).
iii. Finally, the participants prioritised the problems based on the criteria provided in
Annex 1 using printed score sheets. Each team member was requested to score the
environmental problems individually.
2.2.2 Island Environmental Problem Prioritisation Criteria:
Based on the set of defined criteria, a score was assigned to each transboundary problem1 between 0
(no importance), 1 (low importance, 2 (moderate importance) and 3 (high importance) to determine
the relevance of the problem.
2.2.3 Determining environmental and socioeconomic impacts:
i. Initially in plenary to describe the process followed by small breakout groups. After
plenary, IDA Development Team members divided into groups of between 3 and 8. Groups
were either by discipline, environmental problem or mixed. Groups were gender and
socially inclusive, making sure there were women, youths and vulnerable represented.
ii. The lead facilitator defined the groups prior to the workshop. At the end of the group
work, each working group reported back in plenary.
iii. Each group decided on a facilitator/chair, a rapporteur and ensured that all members
knew each other.
1 The Island Diagnostic Analysis (IDA) is based on the Transboundary Diagnostic Analysis (TDA) implemented
for International Waters (GEF) projects. This methodology is to scale the relative importance of sources and
causes, both immediate and root, of transboundary ‘waters’ problems, and to identify potential preventive
and remedial actions. The TDA provides the technical basis for development of a Strategic Action Programme
(SAP) in the area of international waters of the GEF.
3iv. One of the priority cross-sectoral problems was taken and the following were identified:
• The environmental impacts
• The direct and indirect socioeconomic impacts
• Linkages between impacts and other island environmental problems
• Geographical location(s) of impacts/consequences.
v. A set time was allowed for each island environmental problem, e.g., 20 minutes.
2.2.4 Developing causal chains:
i. IDA Development Team members worked in facilitated groups to discuss a selected island
environmental problem. Effort was made to have mixed discipline groups ensuring that
a range of expertise areas was represented. This included natural scientists, social, legal,
political, and economic experts.
ii. The priority problems were reviewed, and their associated environmental and
socioeconomic impacts identified.
iii. For each problem, the following were identified and listed:
• The key sectors (e.g., industry, agriculture, fisheries, etc)
• The immediate causes
• The underlying resource uses and practices that contribute to each immediate cause
• The underlying social, economic, legal, and political causes of each immediate cause
• Link the resource uses and practices, and social, economic, legal, and political causes
• Determine the root causes.
The groups also needed to make linkages, which was done on butcher paper.
The causal chain was developed, and each group presented their results and discussion points.
2.2.5 Report back and discussion:
In plenary, each group was asked for feedback. Critical discussions were then encouraged within the
group; these comments and important points were captured by a rapporteur.
4Cook Islands Ridge to Reef
Island Diagnostic Analysis Technical Report
3. Description of Cook Islands
3.1 Physical and Geographical Characteristics
The Cook Islands are in the Pacific Ocean between latitudes 14° S and 22° S, and longitudes 159° W
and 164° W (Figure 1).
Source: SPC Pacific Community
Figure 1: Location of Cook Islands in the Pacific Ocean
The Cook Islands are a Pacific Polynesian Island group (Figure 1) comprising of 15 widely dispersed
islands, surrounded by an Exclusive Economic Zone of 1.8 million km2. The country consists of
two main island groups: the southern group of Rarotonga, Aituki, Atiu, Mangaia, Manuae, Mauke,
Mitiaro, Palmerston and Takutea; and the northern group of Manihiki, Nassau, Penrhyn, Pukapuka,
Rakahanga and Suwarrow (Figure 2).
Source: SPC Pacific Community
Figure 2: Map of Cook Islands (highlighting Avarua as the Capital)
53.1.1 Geology
The islands of the southern group differ widely in form, structure, and relief, which makes it difficult to
deduce a generalised geological history that is consistent for the whole group (Wood and Hay 1970).
The group includes the high mountainous island of Rarotonga, four raised coral islands with volcanic
cores (Mangaia, Mauke, Mitiaro and Atiu), one atoll (Manuae), one near atoll with a volcanic core
(Aitutaki), and a sand cay (small island of sand) on a coral foundation (Takutea). Several of the islands
are isolated submarine mountains, but those between Aitutaki and Mauke form distinct chains that
trend northwest in parallel, such as the Austral Group to the southeast (Wood and Hay 1970). The
northern group consists of atolls, with one exception of a sand cay on a coral reef foundation known
as Nassau. These islands are widely scattered, and their surrounding bathymetry shows that some
are parts are submarine ranges of volcanic mountains, and others are summits of single volcanic
cones rising some 4500 m to 6700 m above the ocean bed (Wood and Hay 1970).
3.1.2 Soils and Topography
Soil fertility varies from island to island, and islands of the southern group are much richer in flora
than the northern group. The thin layer of soil on the atolls of the islands of the northern group
provide an environment which cannot support a wide range of flora, whereas the islands of the
southern group, with richer volcanic soils, provide a good environment for plant growth.
Twelve different soil types have been identified based on the topography and parent materials
available in Atiu (Campbell 1982). On the island of Mangaia in the southern Cook Islands there are
makatea types of soil (the literal meaning in Polynesian is “white rock”). This is a coral limestone
island which has been uplifted so that pure lime is at a considerable elevation above sea level. Thus,
this area consists of soils that are derived from limestone and are usually of very high pH; very poor
soils are weathered from the old limestone reef. On the inner lowlands, clay-rich soils are formed on
alluvium, which is derived from the volcanic bedrock. The lowland soils are the most fertile and have
been extensively used for agriculture and horticulture. Interior upland soils are dark red, clay-rich
materials typically produced in tropical climates by weathering of basaltic volcano bedrock. These
upland soils are generally less fertile due to nutrient deficiencies (Mataio and Syed 1993, McKean
and Baisyet 1994).
3.1.3 Vegetation
The vegetation for the Cook Islands is lush tropical on Rarotonga and the fertile southern group of
islands. Vegetation on the coral atolls is sparse; mainly pandanus and coconuts. The inland area of
Rarotonga (above 400 m) contains introduced species (Space and Flynn 2002) as well as 26 species
of plants unique to the Cook Islands (Sykes 2016). These include the ascarina (kaiatea ko’u), the
glossy tongue fern and the Rarotongan freycinetia (kiekie), a plant like pandanus (ara). The marine
algal flora of the Cook Islands was most recently reported upon by Dr N’Yeurt (N’Yeurt 1999).
3.1.4 Climate
The Cook Islands’ climate is tropical and moderated by trade winds. The country experiences two
distinct seasons: the dry months from April to November and the wetter humid months from
December to March (Figure 3). The 1929−1992 average rainfall at Rarotonga airport was 2100 mm,
with a maximum in 1967 of 3000 mm and a minimum in 1982 of 1100 mm (Clement and Bourget
1992). Rainfall in the northern group of islands is generally higher than that in Rarotonga (in the
6Cook Islands Ridge to Reef
Island Diagnostic Analysis Technical Report
southern group) where a similar distribution of rainfall occurs throughout the year. The temperature
and rainfall in Rarotonga in 2020 showed that the least amount of rainfall occurred in June with an
average of 75 mm of rainfall. The highest amount of rainfall recorded is 218 mm in January (Figure
3).
Figure 3: Monthly Temperature and Rainfall in Rarotonga, Cook Islands (2020)
Drought is linked to the El Niño Southern Oscillation (ENSO) with significant droughts on Rarotonga
occurring in 1982, 1987 and 1997−1998 (El Niño years). Drought occurs through the lack of, or
very low, rainfall during a rainy season (Dec – April). El Niño linked drought is not a nationwide
phenomenon; the norm is that at the time of an El Niño event, the southern group of islands suffers
drought while the northern group has enhanced rainfall. A La Niña event causes the reverse effect.
Rainfall in the Cook Islands is strongly affected by the South Pacific Convergence Zone. This band
of heavy rainfall is caused by air rising over warm waters where winds converge, resulting in
thunderstorm activity. It extends across the South Pacific Ocean from the Solomon Islands to east of
the Cook Islands (Figure 4). It is centred close to or over the southern group from November to May.
This is when the South Pacific Convergence Zone is most active and furthest south. From November
to March the South Pacific Convergence Zone is wide and strong enough for the northern group to
also receive significant rainfall. The driest months of the year in the Cook Islands are from June to
October (Hunnam 2013).
73.1.5 Natural disasters
Natural hazards2 threaten the Cook Islands in the form of cyclones, storm surge, drought, coastal
flooding, river flooding, tsunamis, earthquakes, and landslides (Parakoti and Davie 2007). The
biggest natural hazard are tropical cyclones (typhoons or hurricanes) such as Category 5 Cyclone
Heta in January 2004, which caused widespread damage to infrastructure in the Cook Islands (other
SIDS affected include Samoa, Tonga, and Niue). Cyclone Pat is the most recent severe cyclone that
struck the Cook Islands in February 2010 and, despite no deaths or casualties, the entire population
of the island of Aitutaki was either directly or indirectly affected. In 2005, a series of five cyclones,
ranging from Category 3 to 5, passed over the islands in a period of just six weeks and in 1997, the
Cook Island’s worst disaster, Tropical Cyclone Martin, hit the atoll of Manihiki and left 19 people
dead. In addition to the natural disasters, the Cook Islands experienced a serious dengue outbreak
in May 2009 with nearly 1000 cases reported on the main island of Rarotonga.
Figure 4: The average positions of the major climate features in November to April. The arrows show near surface
winds, the blue shading represents the bands of rainfall convergence zones, the dashed oval shows the West Pacific
Warm Pool and H represents typical (Parakoti and Davie 2007).
3.1.6 Sources of Potable Water
The Cook Islands sources its potable water supply from two main sources. In the southern group
of islands, including the main island of Rarotonga, surface water is sourced from springs and
streams within catchment valleys, while in the northern group, water is sourced from rainwater
and groundwater. Figure 5 illustrates the location of main water supply intakes (▲) in Rarotonga.
Note that the main villages and neighbourhoods on Rarotonga surround the main upper catchment.
Avarua is the national capital, with the international airport.
2 Emergency Management Cook Islands is the government’s full-time disaster risk management coordination
office to manage crisis prevention, response, and recovery.
8Cook Islands Ridge to Reef
Island Diagnostic Analysis Technical Report
Figure 5: Water intakes in relation to the main upper catchment in Rarotonga (Data source: Ministry of Works)
3.2 Socioeconomic Situation
General migration of the younger population as seen in the past couple of decades leads to loss
of skills and deterioration in the quality of services, especially in the education and health sector
(Sharma 2007). Experts state that these losses of skills and lowering of quality of services have
implications on the quality and availability of the state of environmental leadership and governance
(SPREP, 2020).
3.2.1 Demographic data
A large proportion of the population resides in the capital island of Rarotonga. This suggests potential
developments and therefore possible elevated ecosystem goods and services exploitations occurring
in Rarotonga. The spread of demographic information from the 2019 census such as age structure,
urbanisation and other broad categories are important considerations for future R2R investments
and ICM planning.
Table 1: Census information on Cook Islands (2019)
Population 17,548 (2019)
Age structure 0-14 years: 21.61% (male 1,093/female 972)
15-24 years: 17.2% (male 877/female 767)
25-54 years: 38.08% (male 1,822/female 1,817)
55-64 years: 11.34% (male 584/female 500)
65 years and over: 11.76% (male 554/female 570) (2016 est.)
Median age total: 35.9 years
male: 35.3 years
female: 36.4 years (2016 est.)
Urbanisation urban population: 74.5% of total population (2015)
rate of urbanization: 0.88% annual rate of change (2010-15 est.)
9Population 17,548 (2019)
Sex ratio total population: 1.07 male(s)/female (2016 est.)
Ethnic groups Cook Island Maori (Polynesian) 81.3%, part Cook Island Maori 6.7%, other 11.9% (2011
est.)
Religions Protestant 62.8% (Cook Islands Christian Church 49.1%, Seventh Day Adventist 7.9%,
Assemblies of God 3.7%, Apostolic Church 2.1%), Roman Catholic 17%, Mormon 4.4%,
other 8%, none 5.6%, no response 2.2% (2011 est.)
3.2.2 Migration processes
New Zealand and the Cook Islands have been culturally and economically linked throughout the 20th
century, and while this relationship has been unequal, it has nevertheless meant that Cook Islanders
have been brought up with New Zealand as a key reference point. Furthermore, active recruitment
by New Zealand employers in the 1950s and 1960s, the opening of the Rarotonga International
Airport in 1973, combined with the ambitions of Cook Islanders to obtain better educational and
employment options, signaled a significant increase in the numbers of migrating Cook Islanders
in the mid-decades of the 20th century. The total Cook Islands population was at its peak in 1971
at 21,000 people, 17,700 as of 2011 (SPREP, 2020) and estimated at 18,000 in 2019 (Table 1). It is
also worth noting that all Cook Island citizens carry New Zealand passports and can freely migrate
between the two countries.
By the last decade, the Cook Islands were in some financial difficulty and New Zealand, as a key aid
donor, was requiring structural adjustment to reflect new financial challenges. At a government level,
relations have been strained at times, but the decline of the numbers employed in the Cook Islands
public service, and the economic difficulties of the economy generally, have encouraged ongoing
emigration to New Zealand. The size and relative affluence of the New Zealand-based population
presents significant challenges for a Cook Islands government that wants to stem outward migration
or attract Cook Islanders home.
3.2.3 State of Economy
The leading source of revenue in the Cook Islands is tourism, accounting for around 60% of gross
domestic product, ahead of offshore banking, pearl farming, marine industry, and fruit exports.
The Cook Islands is highly vulnerable to external economic shocks, especially falls in tourism. This
suggests that the country is reliant on a healthy state of environment as most tourists are coming to
the Cook Islands to experience the pristine natural environment.
The Tourism and Migration statistics are released by the Cook Islands Ministry of Finance and
Economic Management, which produces a monthly publication of the number of travellers crossing
its border, both visitors and residents. Since 1999 tourist numbers doubled in number from 53,000
to 121,000 as of 2012. In January 2017, compared to January 2016 visitor arrivals (9976) were up by
1750. The biggest changes were in arrivals from:
• New Zealand (up 1058)
• USA (up 373)
• Europe (up 213).
10Cook Islands Ridge to Reef
Island Diagnostic Analysis Technical Report
The positive rise in visitor arrivals continues to be the trend with large increases from the Americas,
Asia, and New Zealand.
In spite of this trend, the economy of the Cook Islands, as in many other Pacific island nations, is
hindered by the isolation of the country from foreign markets, lack of natural resources, periodic
devastation from natural disasters, and inadequate infrastructure.
Agriculture, employing more than one-quarter of the working population, provides an economic base
with major exports of copra and citrus fruit. Manufacturing activities are limited to fruit processing,
clothing, and handicrafts. Black pearls are notably the Cook Islands’ leading export product. Trade
deficits are offset by remittances from emigrants and by foreign aid overwhelmingly from New
Zealand. In the 1980s and 1990s, the country lived beyond its means, maintaining a bloated public
service, and accumulating a large foreign debt. Subsequent reforms, including the sale of state
assets, the strengthening of economic management, the encouragement of tourism, and a debt
restructuring agreement, have rekindled investment and growth. The Cook Islands has one of the
highest female labour force participation rates in the Pacific islands region and women combine
work for pay or profit with unpaid work in the home. A significant proportion of women work part
time. Youth unemployment, while decreasing, is an issue given the use of contract migrant workers
for technical, trade and tourism-related jobs (Pacific Community 2015).
3.2.4 Agriculture
The trend over the years has seen an increase in the service industry with a decrease in the agriculture
industry. This has implications as urban areas would have higher income whereas rural areas that
rely on agriculture and fisheries would have reduced income over the years.
Major determinants that directly impact the agricultural sector in the Cook Islands include land
availability, limited water resources and inter‐island communications, and related transport
logistics. It is important to note that imports have consistently outstripped exports in the Cook
Islands. Since the turn of the millennium, total imports increased from US$27.9 million to US$205
million in 2019. Exports, however, saw a growth in the same period from US$9.01 million to US$30.3
million. The share of food imports remained at around 20%−25% of total imports, whilst exports
dropped significantly. According to the 2011 agricultural census, out of the 2334 households that
took part in the census:
• 67.5% of households declared to be active in subsistence agriculture and 32.5%
primarily for sales; and
• 68.6% of households declared to be keeping livestock for subsistence and 31.4% for
sales.
Both males and females have equal rights to land and tenure, but men have a slight advantage over
women in land holdings under various arrangements. Women and men in the Cook Islands have
always participated in food production. In the case of traditional food crops such as the cultivation of
taro and yams, men have been mainly responsible for land preparation and planting. The rest of the
family, including women and children, participate in maintaining the plants and help in harvesting as
well as cleaning the tubers (Fact Sheet Cook Islands 2007).
In 2012, crop farming in the Cook Islands produced an estimated total of 7971 metric tonnes (MT) of
produce (excluding figures for noni production), which included 1329 MT of tropical fruits (of which
64% are grown in orchards); 1820 MT of coconuts; 1672 MT of various vegetables; and 3150 MT of
root crops.
113.2.5 Livestock
The 2011 agricultural census confirmed the predominance of the pork, poultry and goat production
livestock sub‐sectors as was also evidenced in the previous census. In 2011, a total of ± 14,000 pigs,
± 4400 goats and ± 34,000 chickens were reported. Indigenous species or low productive species
seem to predominate.
Disposal of animals is low. According to the 2011 agricultural census, only 20% of total numbers are
disposed of, of which 76% were slaughtered. Sales of slaughtered animals remain the exception (±
10%). The informal market (household direct consumption and gifts) seems to absorb most of the
slaughtered animals. In addition to the meat sales, one important sub‐sector for poultry is the egg
sub‐sector. The latter is predominantly established in Rarotonga and streamlined around one major
egg producer and a limited number of smaller operators. Imports of eggs have been increasing over
the past years and since 2014, the imports tariff on eggs has been discontinued.
3.2.6 Social development and living conditions
The Cook Islands is predominantly a lower-middle income nation but has far higher incomes than
other Polynesian countries as a result of a stronger private sector, well-developed commercial
agriculture, and extensively developed tourist industries. It also has one of the highest proportions
of formal sector employees in the Pacific and compared with other Pacific Island countries, a larger
number of employees in manufacturing and a smaller number in public and community services. In
2016, 77% of working-age men and 67% of women participated in the labour market in the Cook
Islands; unemployment rate was higher among women (6.8%) than among men (5%). The female
average annual income from all sources was eighty-five percent (85%) of that of men among the
adult population (ages 15 and above) (Fact Sheet Cook Islands 2007).
Most Cook Islands government agencies can produce sex-disaggregated statistics on topics such as
population, births and deaths, school enrolment, employment, hospital patients and parliamentary
representation. Sex-disaggregated statistics are also available in areas such as statistics on violence
against women (Pacific Community 2015).
3.2.7 Health and Hygiene
There are no central sanitation treatment or disposal facilities in the Cook Islands and reliance is on
septic tanks and individual systems. Individual assessments of households are undertaken by health
officers on a regular basis.
The Cook Islands has various policies and strategies relating to Water Sanitation and Hygiene (WASH)
with the review of the Water Policy currently underway (2017), which may include water treatment
requirements, water quality guidelines and water safety planning. A UN-Water project known as the
Global Analysis and Assessment of Sanitation and Drinking Water (GLAAS) based on water quality
monitoring, sanitary surveys of rainwater tanks and chlorine treatment is currently planned (World
Health Organization and UN-Water 2014).
The water supply in Rarotonga is untreated and the island suffers from a lack of water during drought
conditions, which appear to be occurring more frequently. A large water project, Te Mato Vai, is
being implemented with a focus on replacing the aging infrastructure, reducing water loss, and
increasing water storage capacity. This will help reduce demand on water extraction from freshwater
intake areas (SPREP, Cook Islands State of the Environment Report 2018, 2020).
12Cook Islands Ridge to Reef
Island Diagnostic Analysis Technical Report
Water quality monitoring is undertaken by the Ministry of Health and the samples are analysed
at the hospital laboratory. There are often competing demands on laboratory services and the
government has agreed to fund a central laboratory to increase the analytical capacity. The H2S
(hydrogen sulphide) test has also been used with good results in the outer islands to promote water
safety. Workshops facilitated by WHO on rainwater and water safety planning were held in Rarotonga
and Aitutaki, which raised awareness among the population and provided training to health officers,
government staff and community leaders. An integral part of these workshops was the promotion of
WASH activities, including hygiene.
3.3 Ecological Status
3.3.1 Assessment of legislation/policy that defines National Pro-
tected areas
The Cook Islands has installed legislations which protect areas of biological importance. The Acts
are concerned with the maintenance of biodiversity and the control of invasive species. The most
notable is the Environment Act in 2003. The legislations are put in place to conserve the nation’s
endangered species, develop systems of protected areas, reduce the effects of invasive species as
well as preserve knowledge relating to biodiversity (Pulea 1992). Under the Environment Act 2003
a national protected area is defined as that “where an Island environment authority proposes to
designate an area within its island having ecological, cultural, archaeological, historical or scenic
importance for the purpose of environment and natural resource conservation and management”.
Table 2: Showing the various environmental legislations with formal status
1984 Ministry of Marine Resources Act
1989 Marine Resources Act
1992 Declaration on Environment and Development
1994 Rarotonga Environment Act
1975 Plants Act
1998 Animals Act
1999 Natural Heritage Trust Act
2003 Environment Act
2005 Marine Resources Act
3.3.2 Identification of hotspots − the characteristics that are used
to assess a hotspot.
Though biodiversity hotspots are areas that support natural ecosystems that are intact and where
native species associated with the ecosystems are represented, criteria for a biodiversity hotspot
are that the area should have 1500 species of vascular plants as endemics, and loss of 70% of its
original habitat (Myers et al. 2000). Biodiversity hotspots are also characterised by a high diversity
of endemism. Hotspots help prioritise funding for management of areas of biological and ecological
importance.
13You can also read


