Our air 2018 DATA TO 2017 - New Zealand's Environmental Reporting Series - Ministry for the Environment
←
→
Page content transcription
If your browser does not render page correctly, please read the page content below
>> New Zealand’s Environmental Reporting Series

Our air 2018
DATA TO 2017

Crown copyright ©
Unless otherwise stated, this copyright work is licensed for re-use under a Creative
Commons Attribution 4.0 International licence. Except for any photographs, in essence, you
are free to copy, distribute and adapt the work, as long as you attribute the work to the
New Zealand Government and abide by the other licence terms. To view a copy of this licence,
visit Creative Commons Attribution 4.0 International licence. To reuse a photograph please
seek permission by sending a request to the stated image owner.
Please note that neither the New Zealand Government emblem nor the New Zealand
Government logo may be used in any way which infringes any provision of the Flags, Emblems,
and Names Protection Act 1981 or would infringe such provision if the relevant use occurred
within New Zealand. Attribution to the New Zealand Government should be in written form
and not by reproduction of any emblem or the New Zealand Government logo.

If you publish, distribute, or otherwise disseminate this work (or any part of it) to the public
without adapting it the following attribution statement should be used:
       Source: Ministry for the Environment, Stats NZ, and data providers, and licensed by the Ministry
       for the Environment and Stats NZ for re-use under the Creative Commons Attribution 4.0
       International licence.

If you adapt this work in any way, or include it in a collection, and publish, distribute, or
otherwise disseminate that adaptation or collection to the public, the following attribution
statement should be used:
       This work uses material sourced from the Ministry for the Environment, Stats NZ, and data
       providers, which is licensed by the Ministry for the Environment and Stats NZ for re-use under the
       Creative Commons Attribution 4.0 International licence.

Where practicable, please hyperlink the name of the Ministry for the Environment or Stats NZ
to the Ministry for the Environment or Stats NZ web page that contains, or links to, the
source data.

Disclaimer
While all care and diligence has been used in processing, analysing, and extracting data and
information for this publication, the Ministry for the Environment, Stats NZ, and the data
providers give no warranty in relation to the report or data used in the report – including its
accuracy, reliability, and suitability – and accept no liability whatsoever in relation to any loss,
damage, or other costs relating to the use of any part of the report (including any data) or any
compilations, derivative works, or modifications of the report (including any data).

Citation
Ministry for the Environment & Stats NZ (2018). New Zealand’s Environmental Reporting
Series: Our air 2018. Retrieved from www.mfe.govt.nz and www.stats.govt.nz.

Published in October 2018 by
Ministry for the Environment and Stats NZ
Publication number: ME 1384
ISSN: 2382-0179
ISBN: 978-1-98-852591-4

Cover photo: Mount Maunganui. (Getty Images)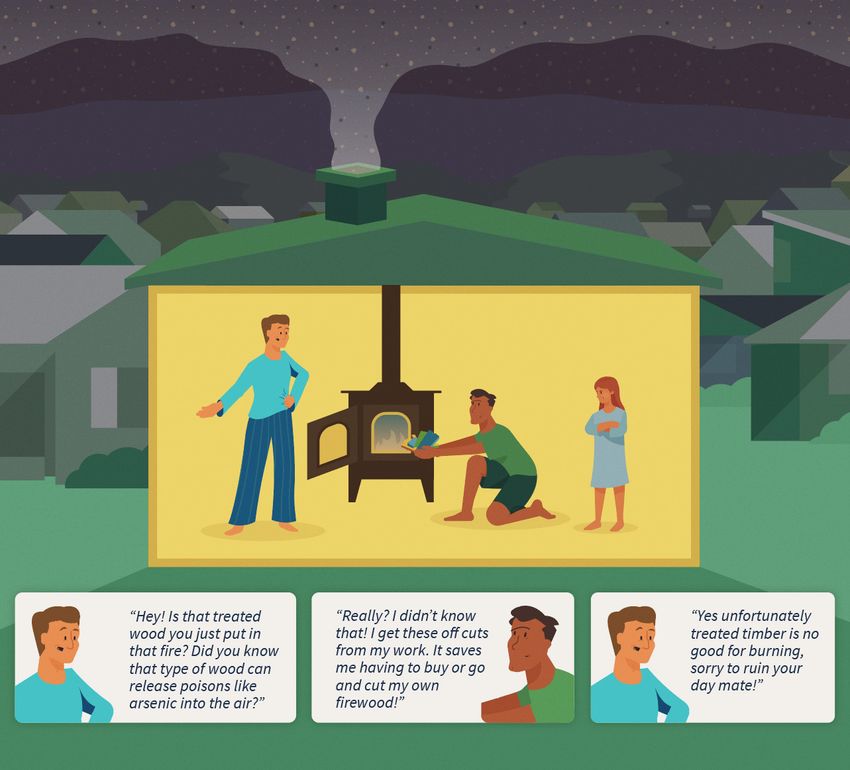
Contents

Message to our readers                                                                                5

Our air – key findings                                                                                6

Introduction to air                                                                                   8
      About Our air 2018                                                                              8
      Te ao Māori and air quality                                                                     9
      Air explained                                                                                 10
      The impacts of air pollution                                                                  12
      Air quality standards: legislation and guidelines                                             13
      Our data for the air domain                                                                   16

Processes influencing air quality                                                                   18
      Sources of air pollution                                                                      18
      Factors that influence air quality                                                            19

Particulate matter pollution                                                                        22
      Health impacts of particulate matter pollution                                                22
      Particulate matter in New Zealand                                                             27
      Emerging issues with particulate matter pollution                                             39

Gaseous pollutants                                                                                  40
     Impacts from gaseous pollutants                                                                40
      Gaseous pollutants in New Zealand                                                             42
      Emerging issues with gaseous pollutants                                                       53

Air pollution and the climate affect each other                                                     55
       Black carbon has multiple negative impacts                                                   55
      Sulphur dioxide has a cooling influence                                                       56
      Climate change affects air quality                                                            56

Quality-of-life impacts                                                                             57
      Night skies and light pollution                                                               57
      Noise pollution                                                                               61
      Odours                                                                                        62

Our air – our future                                                                                63
      Knowledge gaps and data requirements in the air domain                                        63

                                              New Zealand’s Environmental Reporting Series: Our air 2018   3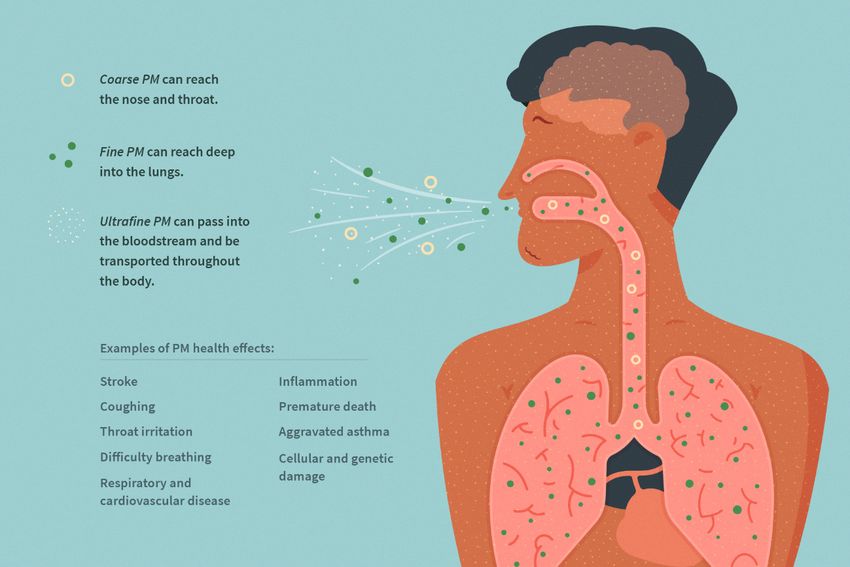
Acknowledgements                                                  65

Glossary                                                          66

References                                                        69

4    New Zealand’s Environmental Reporting Series: Our air 2018
Message to our readers
Air quality is essential to life, but we cannot take it for granted. We all make choices – perhaps
unwittingly – that directly affect the quality of the air we, and others around us, breathe.

It might be when smoke drifts onto our property from a neighbour burning rubbish, or when
we smell the smoky chimney from wet firewood being burnt that we consider air quality.

Our role at Stats NZ and the Ministry for the Environment is to report on the state of our
environment, including issues such as air pollution. We do this through our ongoing
environmental reporting series.

In this report, we are focused on air, and we present the available data on the pressures,
current states, and the impact of poor air quality on the health and well-being of New
Zealanders and our environment.

This is our second air report and the problems identified across both reports are similar.
However, in this report we explore in more detail the air quality issues that are important in
New Zealand, where they come from, and why they matter. This will help us make informed
decisions about the actions we need to take to improve our air quality.

The report shows that New Zealand’s air is generally good, particularly when compared with
heavily industrialised countries. But it’s not perfect. There are times in some areas when air
quality does not meet national air quality standards or international guidelines. Often this
happens during the cooler months.

When air quality is poor, there are health implications. Air pollution can cause shortness of
breath and coughing and potentially lead to more serious health effects particularly in the very
young, older people, and those with pre-existing lung and heart conditions.

Air quality is the main focus of this report, but we have also provided information on light
pollution, noise pollution, and odours because they too can affect our quality of life.

This report stresses that our knowledge of environmental issues in the New Zealand air
domain is incomplete. Knowledge gaps and data needs are described throughout the report
and summarised at the end.

How we tackle these environmental issues in the air domain is beyond the scope of this report.
However, understanding the problems that affect our air quality and the gaps in knowledge is
essential for us to continue making improvements.

Other products complement this report, giving readers the opportunity to delve deeper.
The Environmental indicators Te taiao Aotearoa website contains graphs, maps, tables, and
more detailed technical information. We’ve also produced an ‘at a glance’ summary which
gives a pictorial view of our key findings, while our data service provides the raw data we used
in our analysis.

Vicky Robertson                                               Liz MacPherson
Secretary for the Environment                                 Government Statistician

                                              New Zealand’s Environmental Reporting Series: Our air 2018   5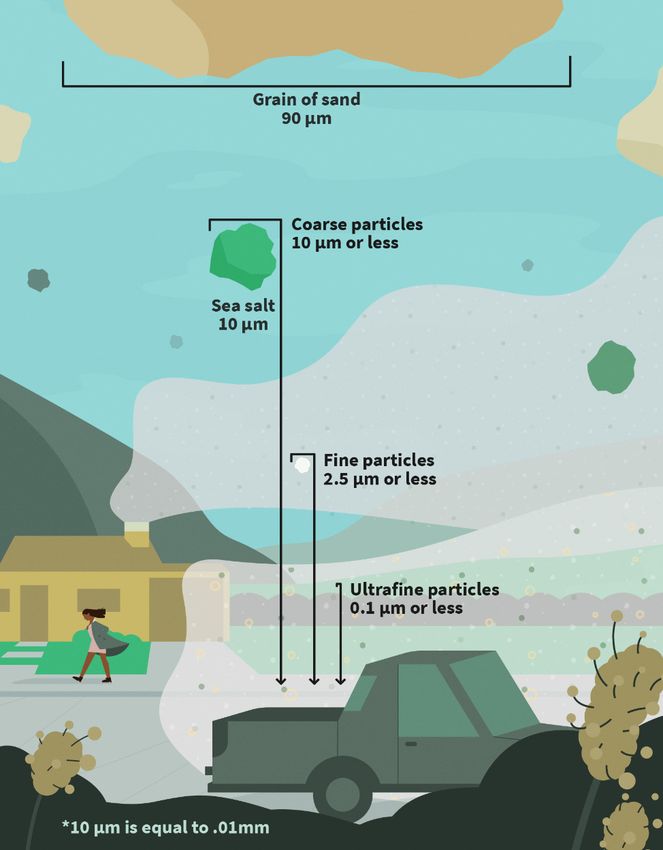
Our air – key findings
Our air quality is good in most places and at most times of the year. However, in cooler
months emissions from home heating can raise particulate matter to levels above standards
and guidelines, especially when the weather and landscape contribute to pollutants
building up.
•   The national emissions inventory indicates burning wood and coal for home heating was
    the biggest single human-made source of particles suspended in the air, or particulate
    matter (PM). In 2015, it made up 25 percent of PM10 (particles less than 10 micrometres)
    and 33 percent of PM2.5 (particles less than 2.5 micrometres).
•   Data from monitoring sites indicate air quality is poorer in autumn and winter when
    temperatures were cooler. From 2007 to 2016, 79 percent of instances when PM10 and
    PM2.5 were higher than guidelines occurred during winter. However monthly average PM10
    concentrations between 2007 and 2016 have seen decreasing (ie improving) trends in
    17 of 39 airsheds (monitoring areas) in winter, when home-heating emissions are at
    their highest.

Vehicle emissions contributed to poor air quality in places, particularly for nitrogen dioxide
pollution, which can cause serious health problems.
•   The national emissions inventory indicates on-road vehicles were the single biggest source
    of human-generated nitrogen oxides in 2015 (39 percent). But regional council and New
    Zealand Transport Agency data both indicate a slightly decreasing trend in Auckland, Bay
    of Plenty, Hamilton, Northland, and Wellington between 2004 and 2016.

International studies show that air pollution can affect people’s health. Effects include
shortness of breath and coughing, heart attack, stroke, diabetes, and premature death.
New Zealand specific studies on the health impacts are limited, but modelled data provides
information on the changes over time.
•   PM10
    In 2016, modelled data estimated the number of premature adult deaths per 100,000
    people from exposure to PM10 in New Zealand was 8 percent lower than in 2006. The
    number of days per 100,000 people when people were not able to go about their regular
    daily activities was 12 percent lower. But relative improvements in air pollution effects
    appear to be largely due to more people living in areas with lower PM10, such as Auckland,
    rather than a reduction in PM10.
•   PM2.5
    New Zealand is one of the few developed countries with no air quality standard for PM2.5,
    although monitoring is undertaken in some parts of the country. Reporting for PM2.5 is
    shown against the World Health Organization’s (WHO) guidelines.
    −      Long term: 4 of 11 airsheds with data for PM2.5 had an annual average higher than the
           WHO guideline between 2014 and 2016.
    −      Short term: 15 of 21 airsheds had at least one day with a 24-hour average higher than
           the WHO guideline between 2014 and 2016.

6       New Zealand’s Environmental Reporting Series: Our air 2018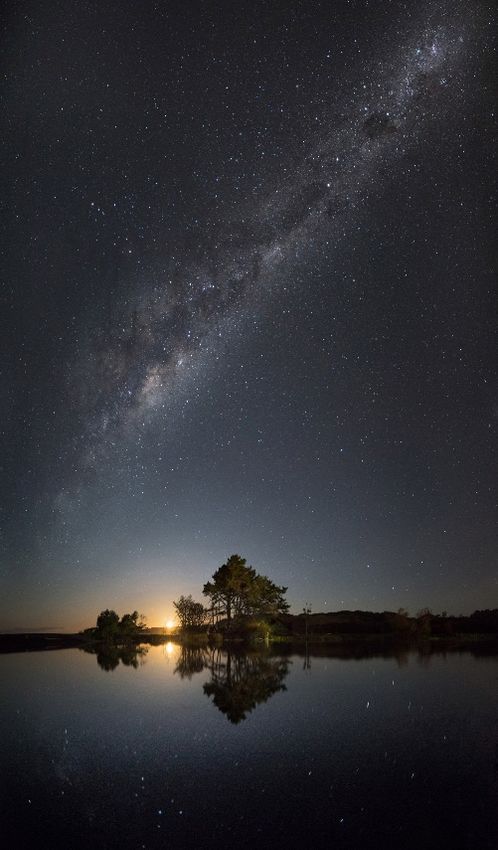
While New Zealand has low levels of light pollution and some areas have pristine night skies,
all major urban areas had light pollution. Light pollution could affect cultural practices
(including mātauranga Māori), natural ecosystems, and biodiversity.
• Based on estimates from satellite data in 2014, 74 percent of the North Island and
93 percent of the South Island had night skies that were either pristine or only degraded
by light pollution near the horizon. But 56 percent of New Zealanders are unable to see
the Milky Way.
Some emerging issues need more investigation to understand effects on our health, our
environment, and our economy.
• There is increasing evidence for health effects from ultrafine particulate matter (smaller
than 0.1 micrometres).
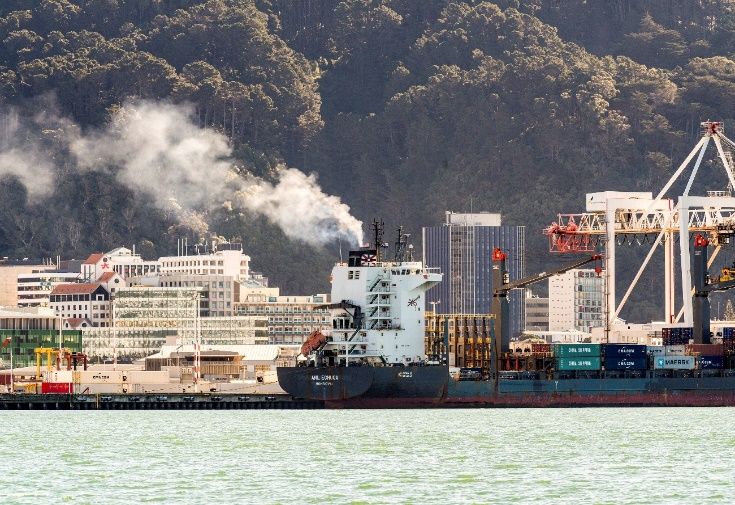
• Shipping is an important source of sulphur dioxide emissions, and the size and number of
international cargo ships and cruise ships visiting New Zealand continues to grow.
• Recent intensification of agriculture could be causing an increase in ammonia emissions,
which could affect ecosystems and biodiversity.
There are several knowledge and data gaps that prevent fuller understanding of the state
and trends of our air.
• Air pollutant monitoring is limited in its coverage over space and time because it is
generally only done where high air quality risks have already been identified.
• More consistent and improved data is needed on key sources of air pollutants; for
example, estimates of emissions from home heating.
• New Zealand specific research and data on the health impacts of exposure to air
pollutants, especially PM2.5 and nitrogen dioxide is required.
• There is very little data about the impact of air pollutants on natural ecosystems and
biodiversity.
• There is limited information on indoor air quality in New Zealand; this is important
because we spend 80 to 90 percent of our time inside and outdoor air (which could be
polluted) can make its way inside.
New Zealand’s Environmental Reporting Series: Our air 2018 7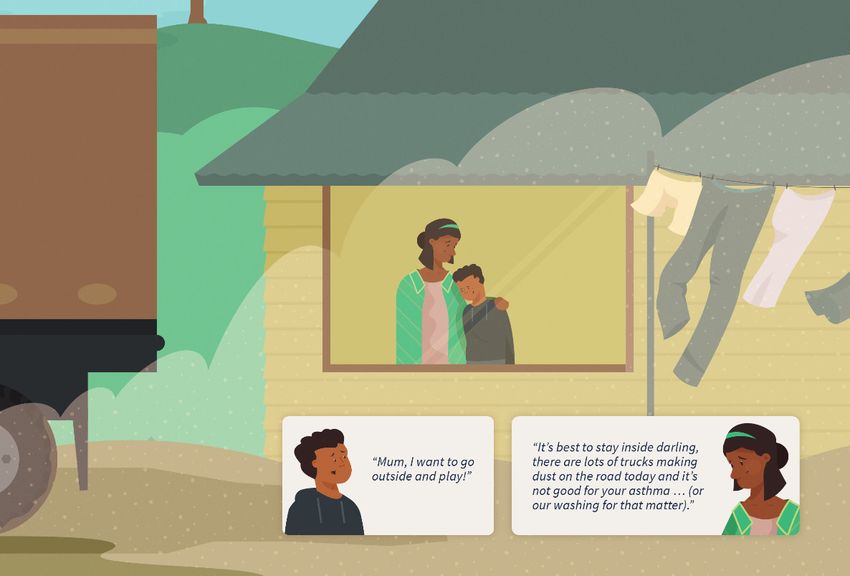
Introduction to air

About Our air 2018
We often take the air we breathe for granted, yet good air quality is fundamental to our
well-being. Our air can become contaminated by particulate matter (particles suspended
in the air) and gaseous pollutants. This can negatively affect our health, quality of life,
ecosystems, and primary production. Poor air quality can become a serious public health
issue and cost society greatly.

The quality of our air is directly affected by the personal choices we make. Emissions from
the way we heat our homes, or how we get to work, have a direct impact on our neighbours
and communities.

This report is written to:
•   raise awareness and understanding of air pollution
•   provide information on the health impacts of poor air quality
•   provide information on the current state of our air and explain how human activities are
    influencing air quality
•   provide information on other factors in the air that influence our quality of life, including
    light pollution, noise pollution, and odours
•   provide information to help people and organisations make informed decisions to protect
    air quality, and other aspects of air affected by human activities – including light and noise
    pollution and odours.

Environmental reporting and the scope of this report
Our air 2018 is part of New Zealand’s Environmental Reporting Series. It is the second
report in the series dedicated to air quality, following from 2014 Air domain, and is the first
written under the Environmental Reporting Act 2015. Under this Act, the Ministry for the
Environment and Stats NZ are required to report regularly on the state of the environment,
the pressures affecting this state, and the impacts on New Zealand’s environment and
human well-being.

New Zealand’s environmental reporting is in line with international best practice and provides
fair, accurate, and independent information to help the public and decision-makers
understand environmental issues.

Environmental reporting guidelines for topics covered in the air domain include the:
•   pressures on air quality from human activities, climate and natural processes, and the
    physical form of the land
•   state of air quality and concentrations of air pollutants
•   impacts of poor air quality on public health; the economy; biodiversity and ecosystem
    processes; mātauranga Māori (Māori knowledge and philosophy), tikanga Māori (Māori
    culture and customs), and kaitiakitanga (guardianship of the environment); customary
    use and mahinga kai (traditional food-gathering areas); sites of significance; and culture
    and recreation.

8     New Zealand’s Environmental Reporting Series: Our air 2018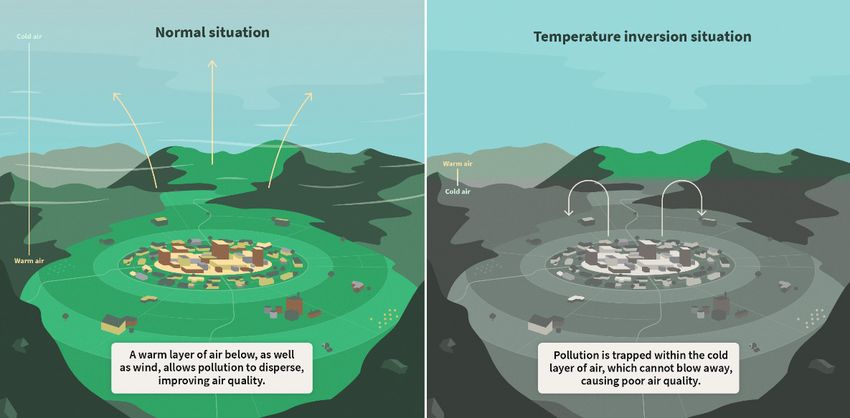
Five domains are regularly reported on: air, atmosphere and climate, marine, fresh water, and
land; as well as synthesis reports that incorporate information across all domains. A recent
environmental report, Our atmosphere and climate 2017, focused on greenhouse gas
emissions and subsequent impacts on climate.

In this report, air emissions that contribute to greenhouse gas emissions are mentioned,
although this is not the main focus of Our air 2018.

Our air 2018 largely focuses on the current state of our air, the pressures on our air
quality, and the impact of ambient (outdoor) air quality on the health and well-being of
New Zealanders.

Report structure
The report begins by describing the approach to developing Our air 2018 before explaining air,
air pollutants and their effects, and air quality standards – legislation and guidelines.

For the body of the report, after describing the processes influencing air quality, two main
types of air pollutants are discussed: particulate matter and gaseous pollutants. Most of the
report’s discussion of pressures, states, and impacts occurs within those chapters because
they are different for the two types of air pollutants.

Each chapter begins by describing the impacts of those particular air pollutants, mainly
on human health, to set the scene for why the reported pollutant concentrations (or
state) matter.

Ongoing economic, technological, and cultural changes, as well as shifts in our understanding,
mean that previously unimportant or unknown issues may currently be affecting our air quality
– some of these are identified as emerging issues in the sections on particulate matter and
gaseous pollutants.

Other issues are also examined, including:
•   arsenic from burning treated timber
•   dust from unsealed roads
•   Auckland brown-haze events
•   indoor air.

Other quality-of-life issues related to air, aside from air quality, are also explored. They include
light pollution, noise pollution, and odours.

Te ao Māori and air quality
Te ao Māori (the Māori world view) recognises the interconnectedness of all things, and the
holistic relationship that exists between people and the environment (Harmsworth & Awatere,
2013). This is reflected in the way mātauranga Māori (Māori knowledge system) has been
developed over thousands of years in close connection to the environment.

The whakapapa (genealogy) of the air domain can be derived from Māori creation traditions
that tell of the separation of Papatūānuku (Earth Mother) and Ranginui (Sky Father). A variant
of this story is shared below.

                                               New Zealand’s Environmental Reporting Series: Our air 2018   9
The origins of the realm of Ranginui – the air domain

     Papatūānuku and Ranginui once lived together in a tight embrace and their children, the atua
     (gods), lived in darkness between them. Fed up with living in perpetual darkness, the atua
     devised a plan to separate their parents so they could enter te ao mārama, the world of light.
     Tāwhirimātea opposed his siblings, and did not want to separate Papatūānuku and Ranginui.
     Nevertheless, the rest of the atua persisted with their plan and Tānemahuta eventually
     succeeded at separating Earth from the heavens. Enraged by this outcome, Tāwhirimātea
     decided to join Ranginui in the sky, where he became the guardian of the winds.

Good air quality is critical to sustain all life on Earth. As they exercise kaitiakitanga
(responsibilities as guardians of the environment in accordance with tikanga Māori), it is
important for Māori to ensure the mauri (life force) and hau (vitality) of the air is protected
and enhanced. Mauri can be compromised in many ways, such as through air and noise
pollution. Diminished mauri upsets the balance within a system and affects the relationship
between people and the environment, and the ultimate health of all living things.

Ensuring good air quality is achieved fits within a te ao Māori health paradigm that links the
physical, cultural, and spiritual well-being of people with the environment. Durie (1999) uses
the concept of waiora to outline the relationship between Māori well-being and the
environment. He says:

        Good health is difficult to achieve if there is environmental pollution; or contaminated
        water supplies, or smog which blocks the sun’s rays, or a night sky distorted by neon
        lighting, or earth which is hidden by concrete slabs or the jangle of steel which obliterates
        the sound of birds… health promotion must take into account the nature and quality of
        the interaction between people and the surrounding environment. (Durie, 1999).

At a broad level, a te ao Māori view sees all things as interconnected and part of a system
reflecting the deep and enduring relationship of the physical and spiritual worlds, in a
woven universe that spans the past, present, and the future in an interconnected way
(Marsden, 2003).

Air explained
Air is defined as the shallow gas layer surrounding Earth; that is, the lower atmosphere
(troposphere) in which people live. This gas layer is primarily made up of oxygen (21 percent)
and nitrogen (78 percent). It also includes small amounts of other gases, vapours, and
particulate matter.

Human activities can emit gases and particles into the air. Some of these emissions can have a
negative impact on air quality and can harm our health, our environment, and our economy.
There are also natural sources of pollutants that influence air quality. The main pollutants in
our air are classed as either particulate matter or gaseous pollutants.

Particulate matter
Particulate matter (PM) is a collective term for solid and liquid particles suspended in the air
that are small enough to be inhaled. PM varies greatly in structure and chemical composition,
depending on the source of the material; it correspondingly varies in the potential to cause
harm, as described below.

10      New Zealand’s Environmental Reporting Series: Our air 2018
PM comes from human activities and natural sources and is often classified according to its
size. PM10 has a diameter of 10 micrometres (µm) or less. PM2.5 has a diameter of less than
2.5 µm and is, therefore, a subset of smaller particles within the PM10 range. Ultrafine
particles are an even smaller subset (less than 0.1 μm or 25 times smaller than PM2.5). In
general, the smaller the particle, the greater the impact on human health, as the smaller
particles can penetrate more deeply into the human body. Figure 1 shows the relative sizes
of the PM size classes.
Figure 1: Relative sizes of particulate matter
Gaseous pollutants
Gaseous pollutants exist as a gas in the atmosphere and are generally released or generated by
human activities with some from natural sources (volcanic and geothermal activity). These
pollutants include nitrogen dioxide (NO2), sulphur dioxide (SO2), ground-level ozone (O3), and
carbon monoxide (CO). Although each gaseous pollutant is measured and reported separately,
we rarely encounter them in isolation. Most often the air is a complex mixture of varying
amounts of different gaseous pollutants, depending on what the main sources of air pollution
are at a particular locality.
New Zealand’s Environmental Reporting Series: Our air 2018 11Knowing what’s in our air
To understand the effects of air pollution, we must understand what is in the air and where it
comes from. Two tools that are often used are emissions inventories and monitoring.
Emissions inventories
Emissions inventories account for the quantities of different pollutants emitted to the air by
different sources, over a certain time period. This can be done in different ways. The simplest
method is to use readily available information at a national scale, such as fuel use or production
volume, and then translate that into the amount of pollution emitted. A more complex way is to
calculate the amount of emissions from individual sources, using customised emission factors,
and then add them together to calculate the amount of pollutants from different source types
and regions.
Emissions inventories can provide information on the relative contributions of different sources
and how they change over time, but they have a level of uncertainty in their estimates.
In this report, an emissions inventory was used to examine sources (pressures) of particulate
matter and gaseous pollutants.
Air quality monitoring
Knowing the amount of each different pollutant that is emitted to the air does not tell us how
much of it is present in the air (its concentration) at any given time. That is because
concentrations depend not only on how much of a pollutant is added to the air, but also how
quickly it is, or isn’t, dispersed. Monitoring directly samples the air to measure how much of a
pollutant is present. This results in much greater certainty about the amount of pollutant in the
air, but without additional analysis does not provide information on its sources.
In this report, air quality monitoring data from regional councils, unitary authorities, and the New
Zealand Transport Agency have been compiled and reported in the particulate matter and
gaseous pollutants concentrations sections.
The impacts of air pollution
Exposure to moderate or low concentrations of air pollutants may not be immediately obvious
but can be dangerous to our health. Serious adverse health effects can occur after short-term
(acute) exposure to air pollutants. However, studies indicate that the most important impacts
at a population-level are associated with the cumulative effects of long-term (chronic)
exposure. These health impacts result in premature deaths, hospital admissions, sick days,
and restricted-activity days. This creates a burden on the health system, the economy, and
society as a whole.
Air pollution has other impacts, including:
• damage to natural ecosystems, biodiversity, and crops
• limiting our enjoyment of outdoor recreational facilities and scenic areas
• effects on cultural values and quality of life.
12 New Zealand’s Environmental Reporting Series: Our air 2018Air pollution – a global problem
Many areas of the world experience poor air quality, and air pollution has been described as
the biggest environmental risk to health globally (Health Effects Institute, 2018). The United
Nations Sustainable Development Goal 3 also notes that globally “indoor and ambient air
pollution is the greatest environmental health risk” (United Nations, 2017).
New Zealand’s air quality profile is different to most of the rest of the world and our air
quality is good in most places and at most times of the year. However, in cooler months
emissions from home heating can raise pollutants to levels that affect human health and are
frequently higher than air quality standards and guidelines, especially when weather and
landscape (topography) are favourable for the build-up of pollutants. Pollutants from
vehicle emissions are a concern as well, mainly in large urban centres, while other pollutants
can be important locally.
Air quality standards: legislation and guidelines
Our air 2018 refers to the thresholds in three main regulations or guidelines when discussing
air pollutants in New Zealand (figure 2). Three regulations or guidelines are used because, for
some air pollutants, they differ or are absent. Standards and guidelines are often developed
for both the short-term (hours to days) and long-term (months to years) because health
effects can differ for different lengths of exposure.
The air pollutants and concentrations for each standard and guideline are summarised in
table 1 and table 2.
Figure 2: Air quality legislation, regulations, and guidelines
Legislation and regulations Guidelines (international and New Zealand)
World Health Ambient Air Quality
Resource Organization air Guidelines 1994
Management Act 1991 quality guidelines (last updated 2002)
(global update 2005)
National Environmental
Standards for Air Quality
2004
(last updated 2011)
Regional air plans
(required under the
Resource Management
Act) (regional councils)
National Environmental Standards for Air Quality
The National Environmental Standards for Air Quality (NESAQ) are regulations made under the
Resource Management Act 1991, which aim to set a guaranteed minimum level of health
protection for all New Zealanders.
New Zealand’s Environmental Reporting Series: Our air 2018 13The NESAQ came into effect on 8 October 2004 and were last updated in 2011. They are made up of 14 separate but interlinked standards that regulate air quality. Regional councils and unitary authorities are responsible for managing air quality under the Resource Management Act. They are required to identify and monitor areas where air quality is likely, or known, to exceed the NESAQ. These areas are known as airsheds. Airsheds and monitoring sites explained An airshed is a geographic boundary defined by the regional council or unitary authority for air-quality management, where part of the atmosphere is assumed to behave in a coherent way, particularly in how emissions disperse. Monitoring is done in airsheds that are at risk of breaching the NESAQ for one or more pollutants. The number of monitoring sites within an airshed varies. Airsheds may have more than one monitor, because individual sites are often not representative of the entire airshed and can monitor different sources of pollutants. World Health Organization guidelines The World Health Organization (WHO) air quality guidelines were developed in response to the threat that air pollution poses to public health globally. The WHO guidelines are not standards or legally binding criteria, but are designed to offer guidance in reducing the health impacts of air pollution, based on the ongoing expert evaluation of scientific evidence. They are relevant to the diverse conditions of all six WHO regions – New Zealand is in the Western Pacific Region – and support a broad range of policy options for air quality management. WHO guidelines are used in this report when there are no national standards, or for comparison when there are differences. The guidelines summarise the hazardous properties of air pollutants and indicate the risk related to exposure; that is, they provide a scientific contribution to developing strategies for air quality management (WHO, 2006). 14 New Zealand’s Environmental Reporting Series: Our air 2018
Table 1: National Environmental Standards for Air Quality (NESAQ) and international guidelines (WHO)

                                                                                         World Health Organization
                         National Environmental Standards for Air Quality                       Guideline
                                                    Permissible exceedance
                                                    (before a breach occurs)
 Air pollutant       Concentration Time period        See note below table              Concentration      Time period

 Particulate         50 µg/m3          24-hour          1 permissible exceedance        50 µg/m3           24-hour
 matter (PM10)                                          in 12 months
                                                                                        20 µg/m3           Annual
                                                        (Exceptions apply in some
                                                        cases. See clause 16B of
                                                        the NESAQ for details)

 Fine particulate                                  NA                                   25 µg/m3           24-hour
 matter (PM2.5)                                    NA                                   10 µg/m3           Annual

 Nitrogen            200 µg/m3         1-hour           9 permissible exceedances       200 µg/m3          1-hour
 dioxide (NO2)                                          in 12 months
                                                                                        40 µg/m3           Annual

 Sulphur dioxide     350 µg/m3         1-hour           9 permissible exceedances       500 µg/m3          10 minutes
 (SO2)                                                  in 12 months

                     570 µg/m3         1-hour                        NA                 20 µg/m3           24-hour

 Carbon              10 mg/m3          8-hour           1 permissible exceedance        30 mg/m3           1-hour
 monoxide (CO)                                          in 12 months
                                                                                        10 mg/m3           8-hour

 Ozone (O3)          150 µg/m3         1-hour                        NA                 100 µg/m3          8-hour

                     Data source: New Zealand Legislation, 1991; WHO, 2006; WHO Regional Office for Europe, 2000

Note: the air quality standard for a contaminant is breached if it is higher than its threshold concentration in an
airshed and the exceedance is not a permissible exceedance. NA = not applicable.

Ambient Air Quality Guidelines
In addition to the NESAQ, New Zealand has Ambient Air Quality Guidelines (AAQG) that take
into account a wider variety of pollutants and ecosystem health as well as human health
(Ministry for the Environment, 2002). They were first prepared in 1994 and updated in 2002 by
the Ministry for the Environment and the Ministry of Health. They precede the NESAQ and are
guidelines, rather than regulations. This report refers to them at times for comparison where
no NESAQ is set, or where it differs from other guidelines, particularly for the four air
pollutants in table 2.

Table 2: Ambient Air Quality Guidelines

                                                                      Ambient Air Quality Guideline
 Air pollutant                                                  Concentration                Time period

 Arsenic                                                 0.0055 µg/m3                                Annual

 Benzene                                                 3.6 µg/m3 from 2010                         Annual
                                                         onwards (10 µg/m3 initially)

 Benzo(a)pyrene                                          0.0003 µg/m3                                Annual

 Sulphur dioxide                                         120 µg/m3                                   24-hour

                                                                Data source: Ministry for the Environment May (2002)

                                                        New Zealand’s Environmental Reporting Series: Our air 2018      15
Our data for the air domain
This report is based on data that have been quality assured by Stats NZ and that meet quality
standards for the Environmental Reporting programme. Where possible, this report includes
data up to 2017. However, 2017 data were not available for all indicators, or could not be
collected, validated, and analysed in time to meet the publication schedule.
The main sources of information are data analyses derived from Environmental indicators
Te taiao Aotearoa: Air.
These indicators provide information on data collection and methodologies, and are available
on the Stats NZ website. Links to the data and additional analysis are provided on the Stats NZ
website. The datasets are available on the MfE Data Service. The data on ambient (outdoor) air
concentrations mostly come from regional councils and unitary authorities, the New Zealand
Transport Agency, the National Institute of Water and Atmospheric Research, and the Institute
of Geological and Nuclear Sciences.
Health impact data is mostly sourced from the Health and Air Pollution in New Zealand model.
Large portions of our data are from regional councils’ and unitary authorities’ monitoring sites.
Monitoring ambient air concentrations for some pollutants is required under the Resource
Management Act (for regulation purposes) where poor air quality might be expected (eg major
roading networks, residential areas, and industrial parks).
The Ministry for the Environment’s Good Practice Guide for Air Quality and Data Management
2009 guided data analysis.
In this report, we only report on data collected from sites:
• that have a timely record of reliable, good quality data
• where people are.
Although the data used in this report are reliable and accurate, several considerations should
be kept in mind when interpreting results:
• data from sites do not spatially represent the entire country because monitoring is only
undertaken when there is a perceived problem; therefore, data should not be used to
determine a single, nationwide picture of our country’s air quality
• caution is needed when comparing sites with each other; air quality issues can be highly
localised so issues relevant to one site may not be relevant for another
• although emissions can be a significant influence on air quality, use caution when
attempting to determine a link between emissions and pollutant concentrations – other
factors (particularly local weather patterns and topography) often influence the amount of
pollutants in the air at a given time and place
• use caution when comparing results in Our air 2018 with those from other reports, which
may use data from different locations, have different methodologies, or cover different
lengths of time – this may include comparisons with the previous 2014 Air domain report.
Where possible we have categorised sites into types (eg residential, traffic, industrial) based on
classifications compiled by Land, Air, Water Aotearoa (LAWA) and regional councils and unitary
authorities. This allows us to compare similarly situated sites in different locations, and reduce
the over-representation of urban areas with multiple monitoring sites. Different monitor
16 New Zealand’s Environmental Reporting Series: Our air 2018classes are also representative of different areas. For example, industrial-focused monitors are
generally targeted at a small number of localised sources while residential-focused monitors
usually spatially represent a wider area.
We assessed all trends described in this report at the 95 percent confidence level. For more
information about our trend assessments, see Trend assessment – technical information.
We assessed the majority of our trends using the most recent decade (2007–16) of monitoring.
At times we focus on averages and exceedances in the latest three-year period (2014–16) for
which we have complete data, to provide a timely snapshot of air quality in New Zealand.
We sourced data on the health impacts from exposure to particulate matter pollution in
New Zealand from the Health and Air Pollution in New Zealand model (Kuschel et al, 2012).
Where possible, air quality and health impact data are presented within the context of
national standards (NESAQ) and international guidelines (WHO).
Data gaps that became apparent are identified and discussed, based on peer-reviewed research.
We summarise these data gaps in the final chapter of this report, Our air – our future.
New Zealand’s Environmental Reporting Series: Our air 2018 17Processes influencing air quality
This section explains air pollution’s sources and other factors that affect air quality.
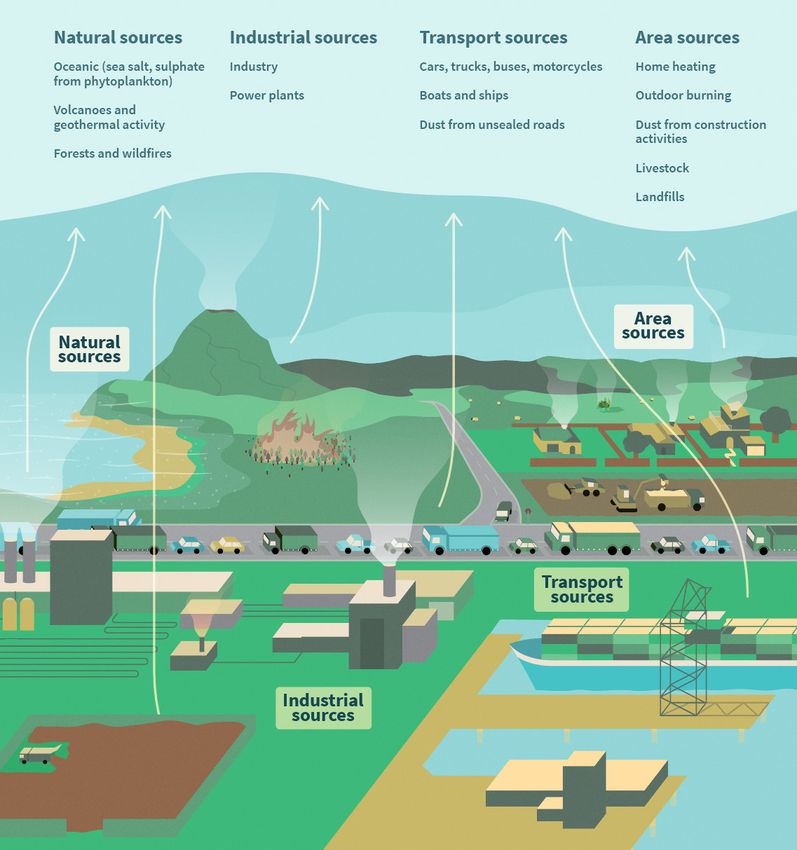
Sources of air pollution
Air pollution can either be the result of human activities or come from natural sources
(see figure 3). The main sources are:
• Human activities – eg burning fuels for home heating, vehicle exhaust from combustion
engines, emissions from industrial processes, power generation, agriculture, pesticides,
and dust from unpaved roads and unpaved areas such as quarries, farms, or
construction sites.
• Natural sources – eg wind-blown dust, pollen, smoke from wildfires, sea salt, and ash and
gases from volcanic activity.
Pollutants that are emitted directly into the air from their source are known as primary
pollutants. Particulate matter (PM), carbon monoxide, and sulphur dioxide are typically
primary pollutants. Secondary pollutants form when primary pollutants react in the
atmosphere to form new pollutants, such as ozone.
Nitrogen dioxide is present in the air as both a primary and a secondary pollutant since it can
be emitted directly from combustion processes, along with nitrogen oxide. Nitrogen oxide can
then oxidise to form more nitrogen dioxide. PM can also be present as a secondary pollutant
since gases such as sulphur dioxide, nitrogen dioxide, and ammonia can react to form sulphate,
nitrate, and ammonium particles.
The ozone layer in the upper atmosphere forms a layer that blocks out harmful ultraviolet
radiation and protects life on Earth. But at ground level, ozone is a gaseous pollutant that can
irritate our airways and eyes, and damage our lungs.
18 New Zealand’s Environmental Reporting Series: Our air 2018Figure 3: Air pollution sources in New Zealand
Factors that influence air quality
Some of our towns and cities are prone to air quality problems over the winter period,
whereas other locations with similar emissions have better air quality. This is because factors
other than emissions influence air quality. These factors include geography, topography,
weather, and time and seasonality, as described below.
Geography
New Zealand is an island nation, far from sources of pollution in other countries. This means
that, except for rare events such as bushfires and dust storms from Australia, we generate
most of our air pollution. Our location in the mid-latitudes means we have a windy climate that
dilutes and carries pollutants away quickly, but it also increases the proportion of natural sea
salt in our air.
New Zealand’s Environmental Reporting Series: Our air 2018 19Topography
The shape of the land is important, as pollutants can be trapped in valleys or basins. Towns
and cities located in basins (eg Alexandra and Rotorua) tend to have greater problems with air
quality, particularly when there are temperature inversions (see Temperature inversions
influence air quality) during clear, calm weather. Ridges and hills can also provide localised
screening of how air pollutants move, resulting in poor air quality near a source of a pollutant,
or better-than-expected air quality on the other side of the ridge or hill.
Weather
Temperature, sunshine, humidity, and wind patterns can all influence air quality. High
pressure periods can lead to calmer stable conditions, so pollutants are more likely to
accumulate. In contrast, higher winds can disperse pollutants and raise the level of natural
sea salt in the air. Wind patterns are also important as wind can blow pollutants towards or
away from urban areas.
Time and seasonality
There are daily, weekly, seasonal, and even inter-annual patterns in air quality that are
influenced by cycles in both emissions and atmospheric conditions. Air pollutant
concentrations can vary by:
• time of day – emissions of different pollutants rise and fall during the day; eg vehicle
emissions peak during rush hour traffic, while home-heating emissions peak in the evening
and the morning as people fire up their wood burners
• day of the week – motor-vehicle emissions are higher during weekdays when workers are
commuting and more commercial vehicles are on the road; also, industrial emissions are
generally higher on weekdays
• season – our air quality changes seasonally along with the weather; eg colder
temperatures during autumn and winter lead to an increase in home-heating emissions,
while windier weather in spring and summer disperses pollutants; however, some
pollutants (eg ozone) need sunlight to form, so their concentrations are higher in summer
• inter-annual cyclical climatic factors – particularly El Niño and La Niña phases of climate
oscillations that cause certain weather patterns to become more prevalent. For example,
a study in the Wairarapa region found that an increase in westerly winds associated with
El Niño was likely a major factor in better air quality in the winter of 2015 (Pezza &
Mitchell, 2016).
20 New Zealand’s Environmental Reporting Series: Our air 2018Temperature inversions influence air quality
Temperature inversions exacerbate air quality problems in some towns and cities during the
cooler months, when people are burning wood or coal to heat their homes. On clear nights,
cooling near the ground’s surface leads to cold air near the ground being overlaid by a layer of
warm air, the opposite of the normal temperature gradient. This warm air acts as a lid, trapping
pollutants (both particulate matter and gaseous pollutants), and allowing them to build up (see
figure 4). Topography such as valleys and basins can act as additional barriers.
These inversion events are responsible for peak PM concentrations at many of the monitoring
sites in residential areas. Natural sources of PM, such as sea salt, are low under these
conditions so most of the air pollution is from human activities, particularly emissions from
domestic heating.
Figure 4: Local weather and topography can cause temperature inversion that traps pollution
New Zealand’s Environmental Reporting Series: Our air 2018 21Particulate matter pollution This section discusses health impacts from particulate matter (PM), sources of PM (or pressures), and concentrations (or state). This section refers to thresholds in legislation and guidelines, which are summarised in Air quality standards: legislation and guidelines. Health impacts of particulate matter pollution In New Zealand and worldwide, the most significant human health impacts from poor air quality are associated with exposure to PM (Health Effects Institute, 2018). At the less-severe end, breathing PM can cause mild and reversible effects such as shortness of breath, coughing, or chest pain. At the other end of the scale, there is strong evidence for much more severe effects of exposure to PM. It can cause disease and premature death from cardiovascular and respiratory problems, such as heart attack, stroke, or emphysema. It can also cause lung cancer and exacerbate asthma. Recent studies point to possible links with diabetes and atherosclerosis due to an increase in inflammation (WHO, 2013). People with pre-existing heart or lung disease, young children, and the elderly, are the most likely to suffer adverse health effects. Exposure to PM can be especially serious for the very young. It has been associated with premature birth, low birth weight, and infant bronchiolitis. Associations have also been identified between PM exposure and respiratory infections, asthma, and chronic reduced rate of lung growth in young children (US EPA, 2009; WHO, 2013). The effects that exposure to PM can have on our health depends on factors that include: • the size of the particles • the amount of particles, and length of time exposed to them • their composition • individual susceptibility. The smaller the particle, the greater the health impact The smaller a particle is, the farther into the respiratory tract it will penetrate – to interact and cause adverse health effects (see figure 5). Different sizes of PM can result in differing health effects. This is because they deposit in different parts of the respiratory tract, they have diverse sources, and they can interact partly through different biological mechanisms (WHO, 2013). Fine particles are now recognised as having the highest health risk and are mainly created by human activities. Larger, coarse PM (2.5–10 µm) generally deposits in the nose, throat, and upper airways, while fine PM (2.5 µm and smaller) can deposit deep in the lungs where the air-blood exchange occurs. Ultrafine particles (0.1 µm and smaller), the smallest of the small, behave more like a gas than a particle. They are small enough to cross into the blood and circulate throughout the body (see Ultrafine particles have health impacts). 22 New Zealand’s Environmental Reporting Series: Our air 2018
Figure 5: The impact of particulate matter on the human body

Exposure matters for health consequences
The amount (concentration) of PM and length of time someone is exposed to it contributes to
the health consequences.

Higher concentrations of PM result in an increased risk of health impacts. For example,
long-term risk of death from heart and lung disease increases by 6–13 percent for
every 10 micrograms per cubic metre (µg/m3) increase in annual PM2.5 concentration.
However, evidence has also been building for impacts at levels below the current WHO
PM2.5 long-term exposure guideline of 10 µg/m3 (WHO, 2013; WHO Regional Office for
Europe, 2016). This indicates there is no threshold for safe exposure where adverse effects
do not occur (WHO, 2013).

The length of time someone is exposed to PM also influences their health outcomes.

Studies show that short-term exposure to PM can have significant impacts, even in people with
no pre-existing health issues. Some impacts, such as shortness of breath are reversible, but
repeated exposure can cause chronic inflammation, leading to respiratory and cardiovascular
disease. Short-term exposure to fine PM can even cause premature death in vulnerable
people, whereas, short-term exposure to coarse PM is only associated with these impacts.

It is increasingly recognised that health effects from PM exposure may occur at much shorter
timescales than previously thought (WHO, 2013). Physiological changes can occur within hours
of exposure to high concentrations, and can be associated with premature death and illness
immediately after exposure and in the following days (WHO, 2013). This is an important
consideration for places with low long-term average PM2.5 concentrations, but that experience
periodic spikes of high PM2.5 levels.

                                              New Zealand’s Environmental Reporting Series: Our air 2018   23
Evidence for effects from long-term exposure (years) to fine PM is strong and continues to
build for cardiovascular, respiratory, and other chronic diseases. Risk factors for outcomes
such as premature death from heart and lung disease are higher for long-term exposure, and
it has much greater health impact than short-term exposure (hours to days). This is because
effects from repeated short-term exposure can develop into chronic disease, and partly
because it may progress underlying diseases (WHO, 2013). However, there is currently only
limited evidence for the health effects from long-term exposure to coarse particles – it has
only recently begun to attract researchers’ attention (WHO, 2013).
Particle composition affects health
Because the size, source, and composition of particles are intricately linked, the source and
composition of airborne particles are also relevant to health impacts. Research shows that
PM’s effect on health may be associated with specific sub-components of particle composition.
Understanding the effect of a particle’s composition can be difficult because atmospheric
particles are a complex mixture of elements and compounds, with particle sizes that span
nanometres to millimetres (see figure 6). Mixtures of particles also vary depending on the time
of the day, season, and location.
Figure 6: Relative sizes of particulate matter in the air
Human-generated combustion particles tend to be much smaller than natural particles (Left to right: particles
of sea salt, soil, motor-vehicle emissions, and home-heating emissions. All images are at approximately the
same scale).
Source: GNS Science
Generally the most prevalent human-made source of particles in our urban atmospheres
are emissions from the combustion of fuels (such as wood and petrol). The composition of
the particles produced generally depends on the composition of the fuel burnt and the
temperature at which it burns – elements and compounds with their own health effects may
be incorporated into the particles during the combustion process. These include arsenic, lead,
or other heavy metals present in the fuel; and polycyclic aromatic hydrocarbons from
incomplete combustion of the fuel itself.
To date, most work has investigated traffic-related, industrial, and secondary PM; however,
recent studies indicate that particles from burning organic matter (eg vegetation or forest
residue) are equally as harmful (WHO, 2013).
There is some evidence for health effects (such as heart and lung disease and premature
death) specifically from exposure to black carbon particles (WHO, 2013). Black carbon comes
from all combustion processes, such as burning wood, diesel, and coal. However, the health
effects associated with black carbon may be those of combustion-related PM in general (WHO,
2013). Black carbon is discussed in more detail in the section on air pollution and the climate
because it also has negative implications for the climate.
24 New Zealand’s Environmental Reporting Series: Our air 2018In contrast, there is little evidence that sea salt particles (the most significant natural source of
PM in New Zealand) are harmful to human health. Sea salt in the air comes from oceanic and
meteorological processes. A 2008 study found that exposure to sea salt PM was much less
toxic than the same amount of PM from combustion sources (WHO, 2013).
Particulate matter pollution affects New Zealanders
PM pollution causes a wide array of health impacts.
Although there is a depth of knowledge from international See Health impacts
studies on the effects PM can have on the human body, of PM10
few studies have measured the health impacts on
New Zealanders specifically. Recent research, based on data from the ‘Growing up in
New Zealand’ child cohort study, found that living in a neighbourhood with a higher density of
wood burners was associated with the increased risk of a non-accidental emergency
department visit before the age of three by 28 percent (Lai et al, 2017).
Modelling the health effects of exposure to PM10 in New Zealand
Because of the difficulty in separating air pollution effects from other causes, modelling is
commonly used to estimate health impacts from air pollution. In New Zealand, we use a
modelling methodology taken from the Health and Air Pollution in New Zealand (HAPINZ) study,
which was developed in accordance with international best practice (Kuschel et al, 2012).
The HAPINZ model determines air pollution health effects by estimating the concentration of
PM10 in the air that the population is exposed to (using air quality and population data), and the
relative risk of different health impacts occurring at that concentration, based on national and
international studies. Air pollution health impacts are typically estimated for the number of days
that people feel unable to undertake daily activities (eg going to school or work), hospitalisations,
and premature death (see table 3).
The primary purpose of using the HAPINZ model is to estimate the relative impact that air
pollution has on our health and the likely socio-economic effects. It can also be used to
see changes over time (eg comparing 2006 with 2016) and understand the drivers behind
any changes.
Although the model has limitations, HAPINZ is the only New Zealand-specific model available.
The figures represent the most robust estimates of the number of New Zealanders experiencing
serious health impacts from air pollution.
However, caution should be used when comparing the results in this report with those in
previous reports because the output of HAPINZ depends on the input available at the time.
The HAPINZ modelling in this report used more-recent information, including: updated health
incidence data, updated source apportionment, updated population data, and a change to using
census area units for all population information.
Modelling estimated the number of premature adult (over 30 years of age) deaths per 100,000
people in New Zealand was 8 percent lower in 2016 than in 2006. It also estimated 4,500 fewer
restricted activity days per 100,000 people (ie 12 percent fewer days where individuals were
not able to go about their daily activities because of poor health).
New Zealand’s Environmental Reporting Series: Our air 2018 25The relative improvements in human-generated air pollution health effects (per 100,000)
appear to be largely due to more people living in areas with lower PM10, such as Auckland,
rather than a reduction in PM10, lowering the overall health impacts per 100,000 people.
Although PM10 concentrations appear to have decreased in other areas, these have only a
minor contribution to health impacts calculations because of the smaller populations that
are exposed.
Table 3: Modelled health effects from exposure to human-generated PM10, 2006 and 2016
Number of cases per
100,000 people
Health effect 2006 2016
Premature mortality (adults 30+) 29 27
Cardiac hospital admissions 6 5
Hospital admissions Respiratory hospital admissions 9 9
Total hospital admissions 15 14
Restricted activity days 36,300 31,800
Data source: HAPINZ Exposure Model (Kuschel et al, 2012), Emission Impossible Ltd
Note: The health effects from exposure to PM10 are modelled. The estimates are determined from the PM10
concentrations that the population is exposed to and the estimated health risks associated with these
concentrations. Hospital admissions are not a direct reflection of hospital records because they indicate the illness
being experienced but cannot confirm the cause. The estimated health risks are determined from national and
international epidemiological studies.
Number of cases per 100,000 people for premature adult mortality and hospital admissions are rounded to the
nearest whole number and restricted activity days to the nearest one hundred.
Population estimates are based on estimated resident population data at 30 June of the given year.
Premature mortality is calculated assuming a 7 percent increase in mortality per 10 μg/m3 increase in annual
average PM10 exposure (Hales et al, 2010).
Other impacts of particulate matter pollution
Aside from the impact on human health, PM has other impacts, including those on
natural ecosystems and biodiversity, agriculture, visibility, recreation, and cultural values.
Data are lacking in New Zealand for these types of impacts, but they have been studied
extensively overseas. There are also climate change implications related to PM (see
Air pollution and the climate affect each other).
Impact on natural ecosystems and agriculture
Overseas studies have shown that when PM settles from the air onto land and water bodies, it
can affect the natural environment, resulting in damage to vegetation and loss of biodiversity
(Grantz, Garner, & Johnson, 2003; Varela et al, 2018). When PM lands on crops it can reduce
the amount of sunlight available for photosynthesis, thus reducing yields (Grantz, Garner, &
Johnson, 2003).
When PM containing hazardous substances eventually makes its way back to the ground and
waterways, some of these substances can bioaccumulate; that is, they build up in higher levels
of the food chain. This can lead to toxic effects on animals, and can be dangerous to humans
that eat them, which potentially affects mahinga kai (traditional food gathering areas). These
hazardous substances include heavy metals (eg arsenic, lead, mercury, and zinc), polycyclic
aromatic hydrocarbons, and pesticides.
26 New Zealand’s Environmental Reporting Series: Our air 2018More data are needed to understand the specific effects of air quality on New Zealand
ecosystems and agriculture.
Impact on visibility and recreation
Visibility is the most widely perceived measure of air quality and is highly influenced by PM.
Reduced visibility can influence people’s perception of air quality and sometimes the activities
they engage in.
Tourism is New Zealand's largest export industry by foreign exchange earnings (Stats NZ,
2017). Visitors come to enjoy our abundant scenic richness and the beauty of our natural
environment. The clarity of New Zealand’s air is essential for people to enjoy the exceptional
scenery and for perceiving this country as a clean, green, natural environment.
We do not have quantitative measures of the impact of air pollution on visibility in
New Zealand, or on how air pollution affects recreation activities.
Particulate matter in New Zealand
Information on the sources of human-made emissions is provided by an emissions inventory
– an accounting of sources and the quantity of pollutants emitted. National emissions are
reported for 2015, the most-recent year that data are available.
Changes to the emissions inventory
Emissions were calculated using nationwide fuel consumption and other statistics, mostly from
New Zealand’s National Greenhouse Gas Inventory 1990–2015 (Ministry for the Environment,
2017), which were multiplied by an emissions factor (the amount of pollutant released by a
specific fuel or process) to calculate the amount of pollutant released from each emission-
source type.
The emissions inventory for this report used a different methodology from previous
inventories (eg Environment Aotearoa 2015, 2014 Air domain report), which summed
individual sources, rather than national data, to obtain emissions estimates. Because the
coverage of sources is now wider, it includes emissions from sources that may be in remote or
unpopulated areas (eg unsealed road dust). The new methodology has the advantage of being
more complete at a national level and more easily updatable, but with more uncertainty in
finer-scale estimates than summing individual sources offers.
The comprehensive nationwide nature of the current methodology results in significant
differences from previous inventories (described in more detail below). Due to the different
methodologies used, current results should not be compared with previous inventories. In
addition, because of the high-level approach, localised inventories that are focused on urban
areas will more accurately reflect the dominant emission sources at those locations.
Industrial emissions are about double the quantity in the previous inventory because the latest
inventory accounts for all fuel consumption from all sources, as well as non-combustion PM
emissions, and diesel burned by off-road vehicles and equipment. New Zealand is the only
country in the OECD without a pollutant release and transfer register to keep track of
individual sources of industrial emissions. Having such a register would increase the accuracy
of industrial sources in future inventories.
New Zealand’s Environmental Reporting Series: Our air 2018 27You can also read


